. 2022 Jan 10;13(1):18.
doi: 10.1038/s41467-021-27689-4.

Maternal regulation of biliary disease in neonates via gut microbial metabolites

Affiliations

Maternal regulation of biliary disease in neonates via gut microbial metabolites

Jai Junbae Jee et al. Nat Commun. .

Abstract

Maternal seeding of the microbiome in neonates promotes a long-lasting biological footprint, but how it impacts disease susceptibility in early life remains unknown. We hypothesized that feeding butyrate to pregnant mice influences the newborn's susceptibility to biliary atresia, a severe cholangiopathy of neonates. Here, we show that butyrate administration to mothers renders newborn mice resistant to inflammation and injury of bile ducts and improves survival. The prevention of hepatic immune cell activation and survival trait is linked to fecal signatures of Bacteroidetes and Clostridia and increases glutamate/glutamine and hypoxanthine in stool metabolites of newborn mice. In human neonates with biliary atresia, the fecal microbiome signature of these bacteria is under-represented, with suppression of glutamate/glutamine and increased hypoxanthine pathways. The direct administration of butyrate or glutamine to newborn mice attenuates the disease phenotype, but only glutamine renders bile duct epithelial cells resistant to cytotoxicity by natural killer cells. Thus, maternal intake of butyrate influences the fecal microbial population and metabolites in newborn mice and the phenotypic expression of experimental biliary atresia, with glutamine promoting survival of bile duct epithelial cells.


Conflict of interest statement

The authors declare no competing interests.

Figures

Fig. 1
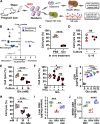
Fig. 1. Maternal intake of butyrate suppresses liver and bile duct injury in the offspring.
A Schematic representation showing butyrate or water administration followed by evaluation of biliary disease in rotavirus (RRV)-infected mice. B Jaundice (generalized linear mixed effect model with logit link and two-sided Wald test with Bonferroni correction; ****p < 0.0001) and C survival (two-sided log-rank test; ****p < 0.0001) rates in RRV-infected newborn mice from water- or butyrate-fed mothers (n = 67–74 mice per group). Plasma alanine aminotransferase (ALT, [D]) and total bilirubin (E) from newborn mice 12–14 days after RRV (n = 5) or phosphate-buffered saline (PBS; Ctrl, n = 4) from water- or butyrate-fed mothers (bile duct injury/obstruction = Dis., n = 5; asymptomatic/resistant = Res., n = 7; mean ± SD, two-tailed ANOVA with Duncan’s multiple comparison; ***p < 0.001, ****p < 0.0001). F Extrahepatic bile duct (EHBD) and liver sections 12–14 days after RRV or PBS (water and butyrate = maternal feeding; magnification bar = 100 μm; PV portal vein). In all, 15–30 EHBD and 5–10 liver sections (corresponding to >100 sections at ×200 or ×400 magnification fields from n = 11–22 mice) stained with H&E per tissue specimen were evaluated for histology analysis. G Virus titers in EHBD and livers at day 7 after RRV infection of newborn mice from water and butyrate-fed dams (mean ± SD, two-tailed unpaired Student’s t test with Welch’s correction; n = 5 biologically independent EHBD or livers per group; ns = not significant). H Volcano plot illustrating hepatic mononuclear cells with p values and fold changes between neonatal mice from water- and butyrate-treated mothers 7 days after RRV infection. The replicate values were determined using biologically distinct samples and p values calculated using unpaired Student’s t test with two-tailed distribution. The gating strategy for flow cytometric analyses is shown in Fig. S10A–K. Source data for this figure are provided as a Source data file.
Fig. 2
Fig. 2. Treatment of neonates with butyrate decreases hepatobiliary injury.
A Diagrammatic outline of gavaging RRV-infected neonatal mice with sodium butyrate. B Jaundice (generalized linear mixed effect model with logit link and two-sided Wald test with Bonferroni correction; ****p < 0.0001) and C survival (two-sided log-rank test; ***p < 0.001) rates in RRV-infected newborn mice treated daily with butyrate or PBS. D Virus titers in EHBD and livers at day 7 after RRV infection of newborn mice from water-fed dams (mean ± SD, two-tailed unpaired t test with Welch’s correction; n = 5 per group; ns = not significant) and E section of EHBD from butyrate-treated mice 14 days after RRV. In all, 15–30 EHBD sections (corresponding to >100 sections at ×200 or ×400 magnification fields from n = 11 mice) stained with H&E per tissue specimen were evaluated for histology analysis. Scale bar  = 50 µM. Foxp3 (F) and Il10 (G) mRNA in RRV-naive or primed hepatic mononuclear cells cultured with or without butyrate, normalized to Gapdh (mean ± SD, two-tailed ANOVA with Duncan’s multiple comparisons, n = 3 per group. *p < 0.05, **p < 0.01, ns = not significant). Source data for this figure are provided as a Source data file.
Fig. 3
Fig. 3. Shared microbial signatures between butyrate-fed mother and offspring resistant to the disease phenotype.
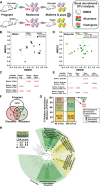
A An experimental overview of stool microbiome analysis from RRV-infected mice from water- and butyrate-fed females. Non-metric multidimensional scaling (NMDS) ordinations and analysis of similarities (ANOSIM) of 16s rRNA organismal taxonomic units (OTUs) of fecal specimens from water- (B, C) and butyrate-fed (D, E) mothers and offspring 12–14 days after RRV or PBS injection. F Venn diagram depicting the number of OTUs from butyrate-treated pregnant female and their offspring infected with RRV with (diseased) or without (resistant) biliary obstruction (Fisher’s exact test and Z-score value from adjusted standardized residuals, n = 6–11 per group). G Bacterial communities in 85 OTUs shared between butyrate-fed mothers and diseased and resistant offspring compared to 508 OTUs shared between butyrate-fed mothers and resistant offspring (Chi-square test and Z-score value from adjusted standardized residuals, n = 6–11 per group). H Cladogram showing a significantly different abundance of bacterial taxa with LDA scores >3.5 magnitude changes between diseased and resistant phenotypes in RRV-infected newborn mice from butyrate-fed mothers (Kruskal–Wallis sum-rank test, n = 6–11 per group). Source data for this figure are provided as a Source data file.
Fig. 4
Fig. 4. Murine fecal metabolites suppress activated immune cells and are enriched with hypoxanthine/inosine and glutamate/glutamine.
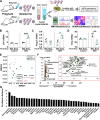
A Schematic illustration of in vitro fecal supernatant–immune cell cultures and stool metabolite analysis. mRNA expression for Il10 (B), Foxp3 (C), and Tnfa (D) as a ratio to Gapdh in RRV-primed hepatic MNCs cultured in the presence of fecal supernatants from neonatal mice of water- or butyrate-fed mothers (mean ± SD, two-tailed unpaired Student’s t test, n = 4 per group; *p < 0.05, **p < 0.01, ***p < 0.001). E NMDS and ANOSIM of metabolites in fecal supernatants of neonatal mice from water- or butyrate-fed mothers at 14 days of age. F Volcano plot illustrating fecal metabolites with p values and fold changes between neonatal mice from water- and butyrate-fed mothers (inset depicts metabolites of lower distance). The replicate values were determined using biologically distinct samples and p values calculated using unpaired Student’s t test with two-tailed distribution. G Fecal metabolites ordered by Euclidean distance measured from the volcano plot. Source data for this figure are provided as a Source data file.
Fig. 5
Fig. 5. Microbiome analysis and functional pathways in human fecal specimens.
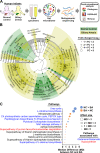
A Schematic overview of fecal microbiome analysis from infants with biliary atresia and healthy controls. B Cladogram showing a significantly different abundance of bacterial taxa with Log2 scaled fold changes between infants with biliary atresia (n = 102) and age-matched controls (n = 28) (adjusted p value <0.05). C Functional pathways significantly regulated by microbial community of biliary atresia and controls, calculated by HUMAnN2 on the basis of MetaCyC pathways (adjusted p value <0.05). Source data for this figure are provided as a Source data file.
Fig. 6
Fig. 6. Glutamine suppresses the obstructive phenotype of experimental biliary atresia and improves survival.
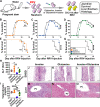
A An experimental design for the treatment of RRV-infected neonatal mice with inosine and/or glutamine. BD Incidence of jaundice in phosphate-buffered saline (PBS)-injected or RRV-infected newborn mice treated with intraperitoneal doses of inosine, glutamine, and inosine + glutamine (n = 22–29 per group; generalized linear mixed effect model with logit link and two-sided Wald test with Bonferroni correction. **p < 0.01, ***p < 0.001, ns = not significant). EG Survival rates of neonatal mice treated with inosine (E), glutamine (F), and inosine + glutamine (G), compared to those receiving PBS (control) during the first 2 weeks of life (n = 22–29 per group; two-sided log-rank test for survival rate, ****p < 0.0001, ns = not significant). Plasma alanine aminotransferase (ALT, [H]) and total bilirubin levels (I) at days 12–14 after phosphate-buffered saline (PBS; Ctrl, n = 4) injection or RRV infection and daily treatment of inosine (n = 4), glutamine (n = 4), and inosine ± glutamine (n = 4; mean ± SD, two-tailed ANOVA with Duncan’s multiple comparison; *p < 0.05, **p < 0.01, ***p < 0.001, ****p < 0.0001). Hematoxylin–eosin-stained sections of extrahepatic bile ducts (EHBD) and livers sections (JO) from newborn mice 12–14 days after RRV and daily treatment of inosine, glutamine, and inosine ± glutamine 12–14 days after RRV injection (magnification bar = 100 μm; PV portal vein; magnification bar = 100 μm). In all, 15–30 EHBD and 5–10 liver sections (corresponding to >100 sections at ×200 or ×400 magnification fields from n = 9–11 mice) stained with H&E per tissue specimen were evaluated for histology analysis. Source data for this figure are provided as a Source data file.
Fig. 7
Fig. 7. Glutamine suppresses hepatic immune cells and promotes cholangiocyte resistance to NK cell-mediated lysis.
A Diagrammatic representation of hepatic mononuclear cell flow cytometry and in vitro NK cell-mediated cholangiotoxicity assay. B Volcano plot illustrating hepatic immune cells with p values and fold changes between phosphate-buffered saline (PBS)- and glutamine-injected neonatal mice 7 days after RRV injection. The replicate values were determined using biologically distinct samples and p values calculated using unpaired Student’s t test with two-tailed distribution. The gating strategy for flow cytometric analyses is shown in Fig. S10A–K. C Percent lysis of cholangiocytes after co-culture with RRV-primed hepatic NK cells from PBS (n = 3) or glutamine (n = 3) injected neonatal mice and a murine cholangiocyte cell line or D in the presence (n = 3) or absence (n = 3) of 30 ng/ml of IL-10 (mean ± SD, unpaired Student’s t test with two-tailed distribution; ****p < 0.0001, ns = not significant). Assay of cholangiocyte lysis by RRV-primed NK cells co-cultured with increasing concentrations of glutamine (n = 4 per group) (E), or F when individual cell type is preincubated with glutamine (n = 4 per group; mean ± SD, two-tailed ANOVA with Duncan’s multiple comparison; *p < 0.05, **p < 0.01, ***p < 0.001, ****p < 0.0001, ns = not significant). G shows total GSH levels measured in cholangiocytes after incubation with various concentrations of glutamine (n = 3–4 per group; mean ± SD, two-tailed ANOVA with Duncan’s multiple comparison; ***p < 0.001, ****p < 0.0001). H NK cell-mediated cholangiocyte lysis in the presence of glutamine (n = 8; 2 technical replicates and 4 biological replicates) and N-acetyl cysteine (NAC) (n = 8, 2 technical replicates and 4 biological replicates; mean ± SD, two-tailed ANOVA with Duncan’s multiple comparison; ***p < 0.001, ****p < 0.0001). I Total GSH levels measured in supernatants of livers (n = 4 biological replicates per group) and J extrahepatic bile ducts (n = 4 biological replicates per group) from control and RRV-infected neonatal mice with or without glutamine treatment (mean ± SD, two-tailed ANOVA with Duncan’s multiple comparison; **p < 0.01, ***p < 0.001, ****p < 0.0001). Source data for this figure are provided as a Source data file.

References

    1. Mohammadkhah, A. I., Simpson, E. B., Patterson, S. G. & Ferguson, J. F. Development of the gut microbiome in children, and lifetime implications for obesity and cardiometabolic disease. Children10.3390/children5120160 (2018). - PMC - PubMed
    1. Stearns JC, et al. Ethnic and diet-related differences in the healthy infant microbiome. Genome Med. 2017;9:32. - PMC - PubMed
    1. Arrieta MC, et al. Early infancy microbial and metabolic alterations affect risk of childhood asthma. Sci. Transl. Med. 2015;7:307ra152. - PubMed
    1. Del Chierico F, et al. Gut microbiota profiling of pediatric nonalcoholic fatty liver disease and obese patients unveiled by an integrated meta-omics-based approach. Hepatology. 2017;65:451–464. - PubMed
    1. Milani, C. et al. The first microbial colonizers of the human gut: composition, activities, and health implications of the infant gut microbiota. Microbiol. Mol. Biol. Rev. 10.1128/MMBR.00036-17 (2017). - PMC - PubMed

Publication types