. 2022 Jan 10;13(1):69.
doi: 10.1038/s41467-021-27734-2.

C/EBPB-dependent adaptation to palmitic acid promotes tumor formation in hormone receptor negative breast cancer

Affiliations

C/EBPB-dependent adaptation to palmitic acid promotes tumor formation in hormone receptor negative breast cancer

Xiao-Zheng Liu et al. Nat Commun. .

Abstract

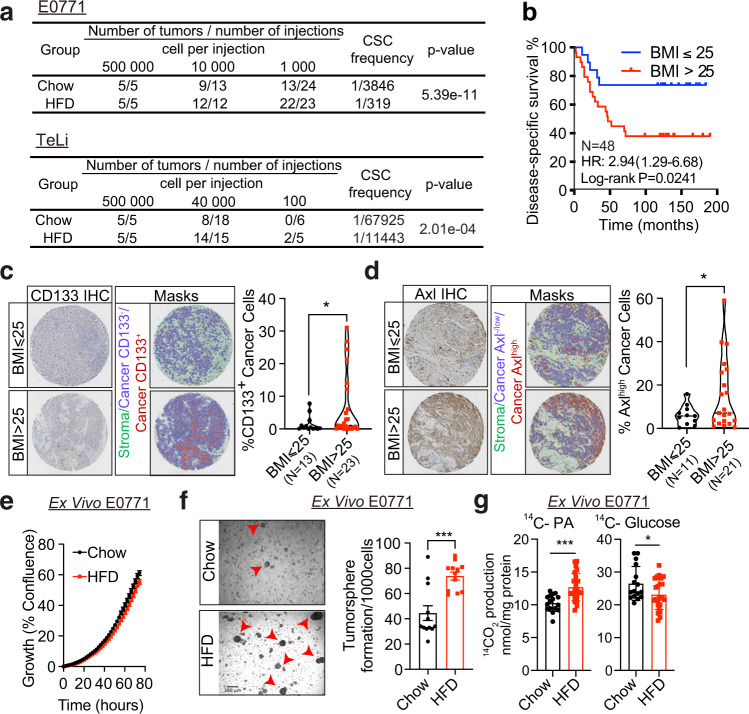
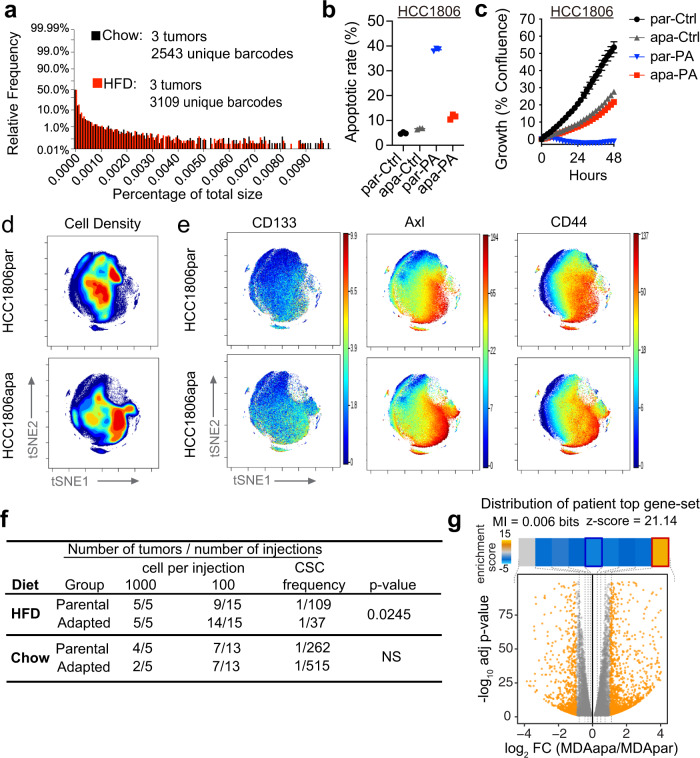
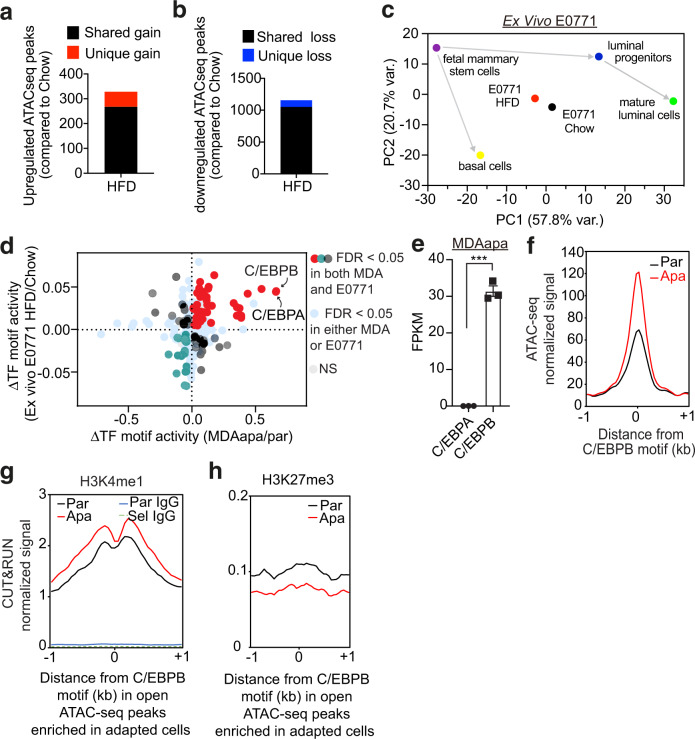
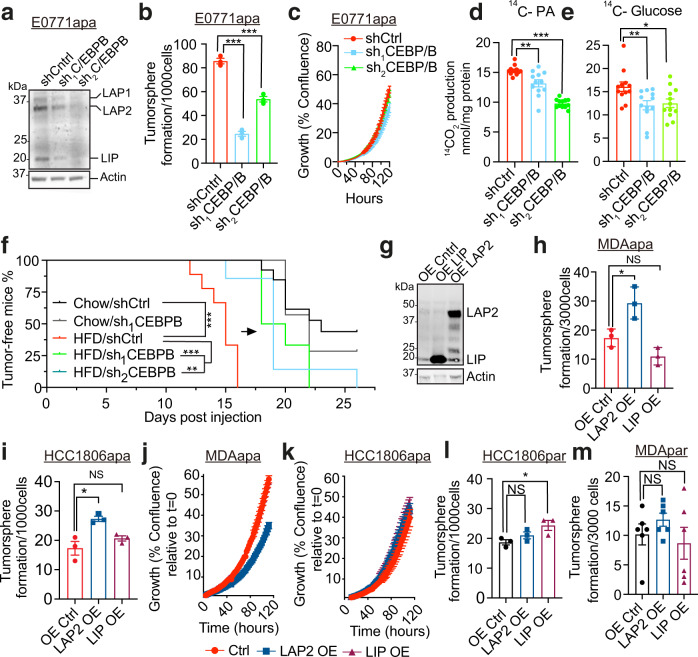
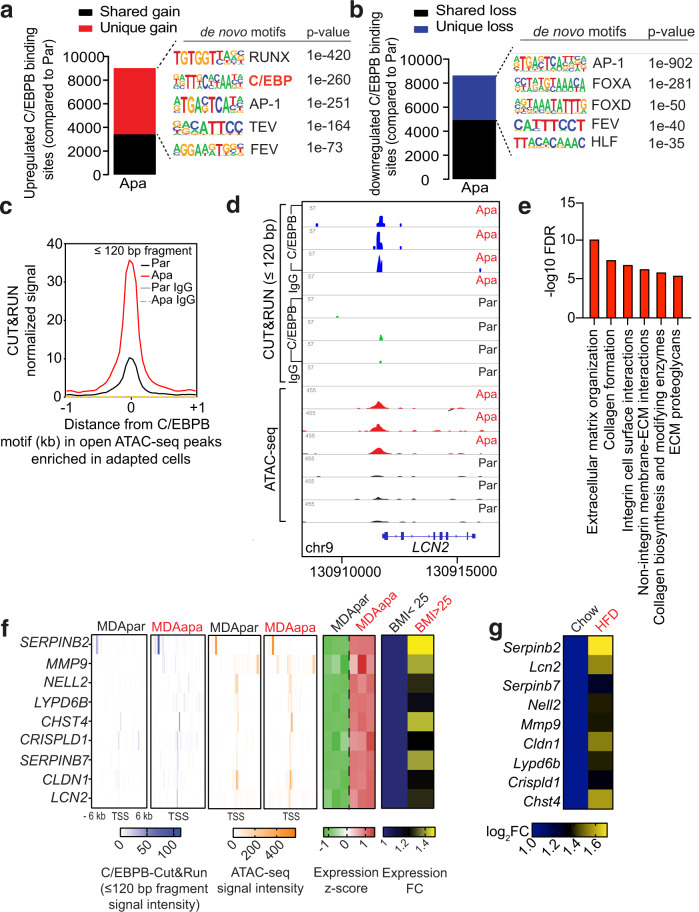
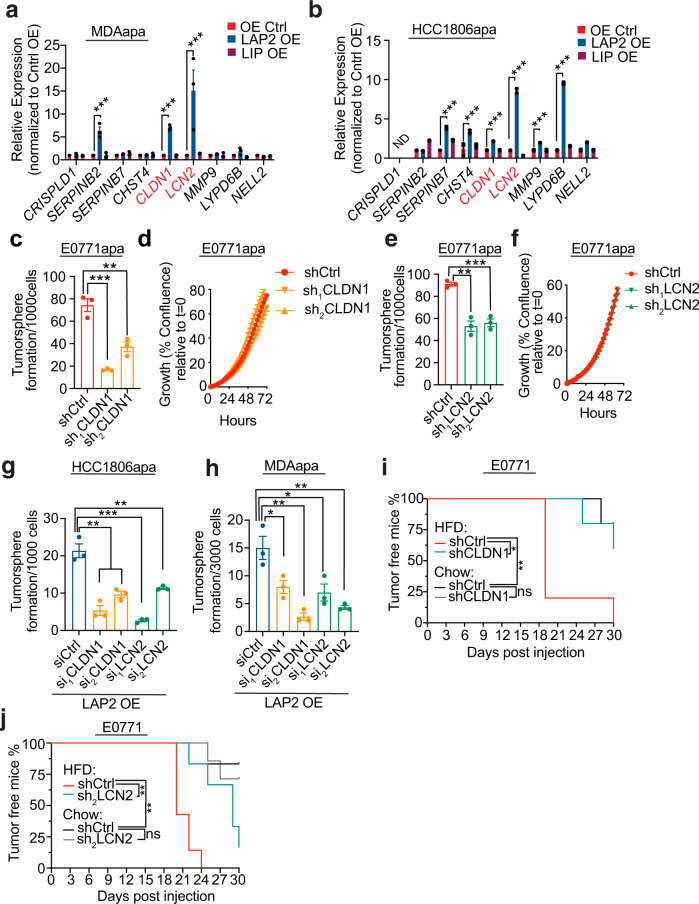
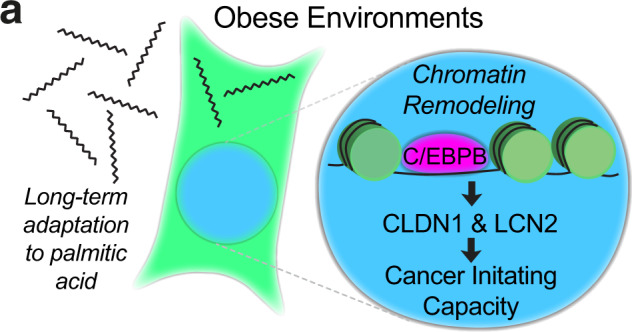
Epidemiological studies have established a positive association between obesity and the incidence of postmenopausal breast cancer. Moreover, it is known that obesity promotes stem cell-like properties of breast cancer cells. However, the cancer cell-autonomous mechanisms underlying this correlation are not well defined. Here we demonstrate that obesity-associated tumor formation is driven by cellular adaptation rather than expansion of pre-existing clones within the cancer cell population. While there is no correlation with specific mutations, cellular adaptation to obesity is governed by palmitic acid (PA) and leads to enhanced tumor formation capacity of breast cancer cells. This process is governed epigenetically through increased chromatin occupancy of the transcription factor CCAAT/enhancer-binding protein beta (C/EBPB). Obesity-induced epigenetic activation of C/EBPB regulates cancer stem-like properties by modulating the expression of key downstream regulators including CLDN1 and LCN2. Collectively, our findings demonstrate that obesity drives cellular adaptation to PA drives tumor initiation in the obese setting through activation of a C/EBPB dependent transcriptional network.


Conflict of interest statement

The authors declare no competing interests.

Figures

Fig. 1
Fig. 1. Obesity is associated with increased frequency of stem cell-like cancer cells in PM/ER/PR breast cancer patients and mouse models of breast cancer.
a Tumor incidence following orthotopic implantation of cancer cells into the mammary fat pads of chow- and HFD-fed mice. b Kaplan–Meier curves show disease-specific survival for PM/ER/PR patients (n = 48) with high (red) or low (blue) BMI. Log-rank (Mantel–Cox) P value is denoted for difference in disease-specific survival. c, d Representative tissue microarray and QuPath analysis mask pictures of CD133 (c) and Axl (d) staining in high (BMI > 25, n = 23 for CD133; n = 21 for Axl) or low (BMI ≤ 25, n = 13 for CD133; n = 11 for Axl) BMI PM/ER/PR patients’ tumor samples, stroma is marked in green, CD133 or Axl−/low cancer cells are marked in blue and positive staining cancer cells are marked in red (for c, P = 0.0245; d, P = 0.023). e Time-dependent proliferation assay of ex vivo E0771 cells isolated from chow or HFD-fed mice. For each time point, data are represented as mean ± SEM of four tumor samples (eight replicates per tumor sample were measured) from each group. f Tumorsphere formation assay of E0771 ex vivo cells isolated from chow diet or HFD-fed mice. Representative images of day-5 tumorspheres formation of E0771 ex vivo cells and red arrowheads mark the identified tumorspheres. Quantification of day-5 tumorspheres is represented as mean ± SEM of four tumor samples from each group and three replicates were measured for each sample, P = 0.0002. g Fatty acid and glucose oxidation on E0771 ex vivo cells isolated from two chow diet-fed mice and three HFD-fed mice. The oxidation data are normalized to cell protein content. For each sample, 8 replicates are measured and data are represented as mean ± SEM of all replicates from each group. Fatty acid oxidation P = 0.0002, Glucose oxidation P = 0.0365. For c, d, unpaired, two-tailed Welch’s t-test was used for statistical testing. For f, g, statistical significance determined with unpaired, two-tailed Student’s t-test (*P value <0.05; ***P value <0.001). Source data are provided as a Source data file.
Fig. 2
Fig. 2. Long-term adaptation to PA phenocopy obesity-induced stem-cell features.
a Distributions of relative barcode frequency for three tumors in each group. b Apoptotic rate of parental and adapted HCC1806 cells which were treated with 400 µM PA and vehicle (Ctrl) for 48 h. Both early (Annexin V+/PI) and late (Annexin V+/PI+) apoptotic cells were included for the apoptotic rate % calculation. Data are represented as mean ± SEM of 3 replicates. c Time-dependent proliferation assay of parental and adapted HCC1806 following 48 h. Cells were exposed to 400 µM PA and vehicle (Ctrl). Cell growth was determined by high content imaging and represented as % confluence normalized to t = 0. For each time point, data are represented as mean ± SEM of 6 replicates. d Representative contour plots of mass cytometry data colored by density of cells showing the changes between parental and adapted HCC1806 cells. Color code represents the cell density from low (blue) to high (red). e Representative tSNE plots of single parental and adapted HCC1806 cells colored by expression of CD133, Axl, and CD44. f Tumor incidence following orthotopic implantation of the indicated number of parental and adapted E0771 cells into chow and HFD-fed mice. The frequency of cancer stem-like cells was calculated by the extreme limiting dilution analysis. The default Chisquare test in ELDA was performed to evaluate the differences between parental and adapted cells (NS, P value >0.05). g The distribution of genes induced by obesity (obese and overweight compared to non-obese patients) in PM hormone negative breast cancers patients among the gene expression changes observed in PA-adapted cell lines. We have included the mutual information value (MI) and its associated z-score reported by iPAGE. For visualization, the enrichment/depletion of the query gene-set was determined using the hyper-geometric test and the resulting p-value was used to define an enrichment score that is shown as a heatmap across the expression bins. The obesity-induced genes were significantly enriched in the top-most bin. The red and blue borders in the heatmap denoted statistical significance for enrichment and depletion respectively. Source data are provided as a Source data file.
Fig. 3
Fig. 3. Adaptation to obese environments induces open chromatin linked with C/EBPB occupancy.
a, b Total number of significantly upregulated (a) and downregulated (b) ATACseq peaks in E0771 HFD (n = 3) relative to chow (n = 4) by DiffBind with a false discovery rate (FDR) < 0.05. Unique gain (a) or loss (b) peaks refer to the peaks identified only in the HFD or chow condition, respectively, whereas shared peaks are peaks called in both conditions. c Principal component analysis showing principal components (PC) 1 and 2 of E0771 ex vivo cells and different cell lineages along the mammary gland developmental trajectory (GEO: GSE116386) using the average transcription factor motif activity estimated by chromVar. d Overlap of differential transcription factor binding motif activity between MDA-MD-231 (apa/par) and E0771 (HFD/Chow) as determined by diffTF. e Within-sample normalized gene expression of transcription factor homologs C/EBPA and C/EBPB in PA-adapted MDA-MB-231 cells using RNA-seq. FPKM = fragments per kilobase of transcript per million mapped reads. Data are represented as mean ± SEM of 3 replicates from each group. Statistical significance determined with unpaired, two-tailed Student’s t-test (P < 0.0001). f Metagene representation of the mean ATACseq signal across more accessible C/EBPB motif regions in parental (n = 3) or adapted (n = 3) MDA-MB-231 cells. The mean signal of three adapted or parental MDA-MB-231 biological replicates was determined by averaging signals of 1 kb around the center of C/EBPB DNA-binding motifs. g, h Metagene representation of the mean H3K4me1 (par n = 2; apa n = 2) and IgG signals (g) and the mean H3K27me3 signals (par n = 3; apa n = 3) (h) across more accessible C/EBPB motif regions as in (f) in MDA-MB-231 cells. The mean signals of biological replicates were determined by averaging signals of 1 kb around the center of C/EBPB DNA-binding motifs. Source data are provided as a Source data file.
Fig. 4
Fig. 4. C/EBPB promotes tumor stemness specifically in obese environments.
a Western blots of C/EBPB and Actin in cell lysates extracted from knockdown control (shCtrl) and two independent C/ebpb knockdown adapted E0771 cells. Three C/EBPB isoforms, LAP1, LAP2, and LIP are marked in the blots. Experiment was independently repeated twice. b The changes of tumorsphere formation upon knockdown of C/ebpb on adapted E0771 cells. Data are represented as mean ± SEM of 3 replicates. Pctrl/sh1 < 0.0001, Pctrl/sh2 = 0.0006. c Proliferation assay of control and C/ebpb knockdown adapted E0771 cells (n = 6 replicates). For each time point, data are represented as mean ± SEM. d, e The changes of fatty acid (d) and glucose (e) oxidation upon C/ebpb knockdown in adapted E0771 cells. The oxidation data are normalized to cell protein content (n = 12, fatty acid oxidation: Pctrl/sh1 = 0.0028, Pctrl/sh2 < 0.0001. Glucose oxidation: Pctrl/sh1 = 0.0097, Pctrl/sh2 = 0.0165). f Tumor-free survival curves of chow diet and HFD-fed mice orthotopically implanted with E0771 knockdown control and C/ebpb knockdown cells. (Chow: shCtrl n = 13, sh1CEBPB n = 7; HFD: shCtrl n = 9, sh1CEBPB n = 6, sh2CEBPB n = 7; PHFDctrl/sh1 = 0.0004, PHFDctrl/sh2 = 0.0012, Pchowctrl/HFDctrl < 0.0001). g Western blots against C/EBPB in cell lysates extracted from control, LAP2 and LIP overexpressed MDA-MB-231 PA-adapted cell line. Actin was used for the normalization. Experiment was independently repeated three times. h, i The changes of tumorsphere formation upon the overexpression of C/EBPB LAP2 and LIP isoforms on adapted MDA-MB-231 (h) (n = 3, Pctrl/LAP2 = 0.0299, Pctrl/LIP = 0.0625) and HCC1806 (i) (n = 3, Pctrl/LAP2 = 0.016, Pctrl/LIP = 0.2524) cells. j, k Proliferation assay of control, LAP2 and LIP overexpressed adapted MDA-MB-231 (j) and HCC1806 (k) cells. For each time point, data are represented as mean ± SEM of 5 replicates and 4 replicates for HCC1806 LAP2 OE. l, m The changes of tumorsphere formation upon the overexpression C/EBPB LAP2 and LIP isoforms on parental HCC1806 (l) (n = 3 Pctrl/LAP2 = 0.1836, Pctrl/LIP = 0.0397) and MDA-MB-231 (m) (n = 6, Pctrl/LAP2 = 0.2611, Pctrl/LIP = 0.6529) cells. For b, d, e, h, i, l, and m, statistical significance determined with unpaired, two-tailed Student’s t-test. For f, Log-rank (Mantel–Cox) test was used for statistical testing. (NS, P value >0.05; *P value <0.05; **P value <0.01; ***P value <0.001). Source data are provided as a Source data file.
Fig. 5
Fig. 5. Differential C/EBPB occupancy regulates extracellular matrix organization.
a, b Total number of upregulated (a) and downregulated (b) C/EBPB binding sites in adapted (n = 3) MDA-MB-231 cells relative to the parental (n = 3) using DiffBind with an FDR < 0.05 (The p-values were determined using default binomial distribution in HOMER). Unique gain or loss sites refer to binding sites identified only in the adapted or parental condition, whereas shared peaks are peaks called in both conditions. Top 5 significant de novo motifs enriched in the unique gain or loss sites were called by HOMER. c Metagene representation of the mean C/EBPB Cut&Run signal (fragment length ≤120 bp) across the same chromatin regions as in open ATACseq peak enriched in adapted cells from three biological replicates of adapted or parental MDA-MB-231 cells. Control IgG Cut&Run experiment in adapted and parental cells was included for comparison. d Representative genome browser tracks of normalized C/EBPB and IgG Cut&Run and ATACseq profiles around the LCN2 locus in biological replicates of parental and adapted MDA-MB-231 cells. e Reactome pathway analysis of genes containing gained chromatin accessibility to C/EBPB. f Heatmaps showing average Cut&Run and ATACseq signal intensity centered around the transcription start site (TSS) of the nine putative C/EBPB target genes, and the corresponding mRNA expression of the same genes in three biological replicates of MDApar and MDAapa cells (panels 1–5). Heatmap of expression fold change of the same genes in obese and overweight compared to lean patients was also shown (panel 6). g Heat map showing mRNA expression of potential C/EBPB targets in E0771 cells isolated from chow diet and HFD-fed mice. mRNA expression was measured by RT-qPCR with cells isolated from n = 2 chow tumors and n = 3 HFD tumors. Source data are provided as a Source data file.
Fig. 6
Fig. 6. CLDN1 and LCN2 are required for C/EBPB-dependent stem cell-like capabilities.
a, b The changes in the expression of C/EBPB potential target genes upon the overexpression of LIP and LAP2 on adapted MDA-MB-231 (For SERPINB2 adjust P = 0.0002, and for CLDN1 and LCN2 adjust P < 0.0001) (a) and HCC1806 (adjust P < 0.0001, ND = not detectable) (b) cells. The expression of target genes is shown as relative fold change over Control OE. Data shown as mean ± SEM of 3 independently repeated experiments, two-way ANOVA multiple comparisons were performed to assess statistical significance. c The changes of tumorsphere formation of Cldn1 depletion in E0771apa cells (n = 3; Pctrl/sh1 = 0.0006, Pctrl/sh2 = 0.0068). d Proliferation of control and Cldn1 knockdown adapted E0771 cells. For each time point, data are represented as mean ± SEM of 8 replicates. e The changes of tumorsphere formation of Lcn2 depletion in E0771apa cells (Pctrl/sh1 = 0.0015, Pctrl/sh2 = 0.0008). f Proliferation of control and Lcn2 knockdown E0771apa cells. For each time point, data are represented as mean ± SEM of 8 replicates. g, h The changes of tumorsphere formation upon knockdown of CLDN1 and LCN2 with two independent siRNAs on the LAP2 overexpressed adapted HCC1806 (n = 3; Pctrl/si1CLDN1 = 0.0022, Pctrl/si2CLDN1 = 0.0047, Pctrl/si1LCN2 = 0.0006, Pctrl/si2CLDN1 = 0.0061) (g) and MDA-MB-231 (n = 3; Pctrl/si1CLDN1 = 0.0424, Pctrl/si2CLDN1 = 0.0049, Pctrl/si1LCN2 = 0.0363, Pctrl/si2CLDN1 = 0.0072) (h) cells. i Tumor-free survival curves of chow and HFD-fed mice orthotopically implanted with 100 E0771 control and Cldn1 knockdown cells (n = 5 in each condition, PHFDctrl/sh1 = 0.0173, PHFDctrl/Chowctrl = 0.0074). Tumor volume was measured every 2–3 days and tumor formation were recorded when reached a volume 50 mm3. j Tumor-free survival curves of chow diet and HFD-fed mice orthotopically implanted with 100 E0771 control and Lcn2 knockdown cells. The analysis was performed by using the mice from two independent experiments (HFD/shCtrl n = 7, HFD/sh2LCN2 n = 6; Chow/shCtrl n = 6, Chow/sh2LCN2 n = 7, PHFDctrl/sh1 = 0.0018, PHFDctrl/Chowctrl = 0.0018). For c, e, g, h, data shown as mean ± SEM of 3 replicates, and statistical significance determined with unpaired, two-tailed Student’s t-test. For i, j, P values were determined with Log-rank (Mantel–Cox) test (NS, P value >0.05; *P value <0.05; **P value <0.01; ***P value <0.001). Source data are provided as a Source data file.
Fig. 7
Fig. 7. A schematic model of obese environment on breast cancer-initiating capacity.
Long-term adaptation of breast cancer cells to palmitic acid promotes tumor-initiating capacity through increased accessibility of C/EBPB binding motifs, which induces the expression of C/EBPB targets CLDN1 and LCN2.

References

    1. Munsell MF, Sprague BL, Berry DA, Chisholm G, Trentham-Dietz A. Body mass index and breast cancer risk according to postmenopausal estrogen-progestin use and hormone receptor status. Epidemiol. Rev. 2014;36:114–136. - PMC - PubMed
    1. Jiralerspong S, Goodwin PJ. Obesity and breast cancer prognosis: evidence, challenges, and opportunities. J. Clin. Oncol. 2016;34:4203–4216. - PubMed
    1. Chan DS, et al. Body mass index and survival in women with breast cancer-systematic literature review and meta-analysis of 82 follow-up studies. Ann. Oncol. 2014;25:1901–1914. - PMC - PubMed
    1. Niraula S, Ocana A, Ennis M, Goodwin PJ. Body size and breast cancer prognosis in relation to hormone receptor and menopausal status: a meta-analysis. Breast Cancer Res. Treat. 2012;134:769–781. - PubMed
    1. Picon-Ruiz M, Morata-Tarifa C, Valle-Goffin JJ, Friedman ER, Slingerland JM. Obesity and adverse breast cancer risk and outcome: Mechanistic insights and strategies for intervention. CA Cancer J. Clin. 2017;67:378–397. - PMC - PubMed

Publication types

LinkOut - more resources