. 2022 Jan 10;13(1):110.
doi: 10.1038/s41467-021-27750-2.

Yeast-derived nanoparticles remodel the immunosuppressive microenvironment in tumor and tumor-draining lymph nodes to suppress tumor growth

Affiliations

Yeast-derived nanoparticles remodel the immunosuppressive microenvironment in tumor and tumor-draining lymph nodes to suppress tumor growth

Jialu Xu et al. Nat Commun. .

Abstract

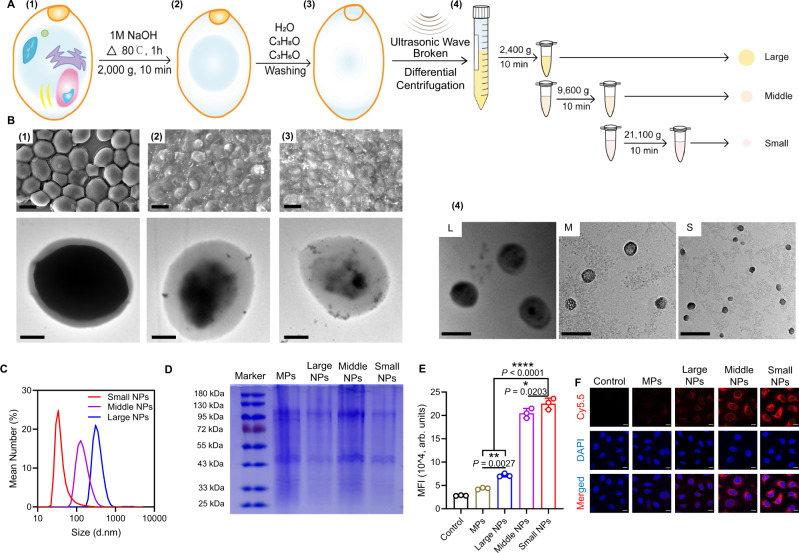
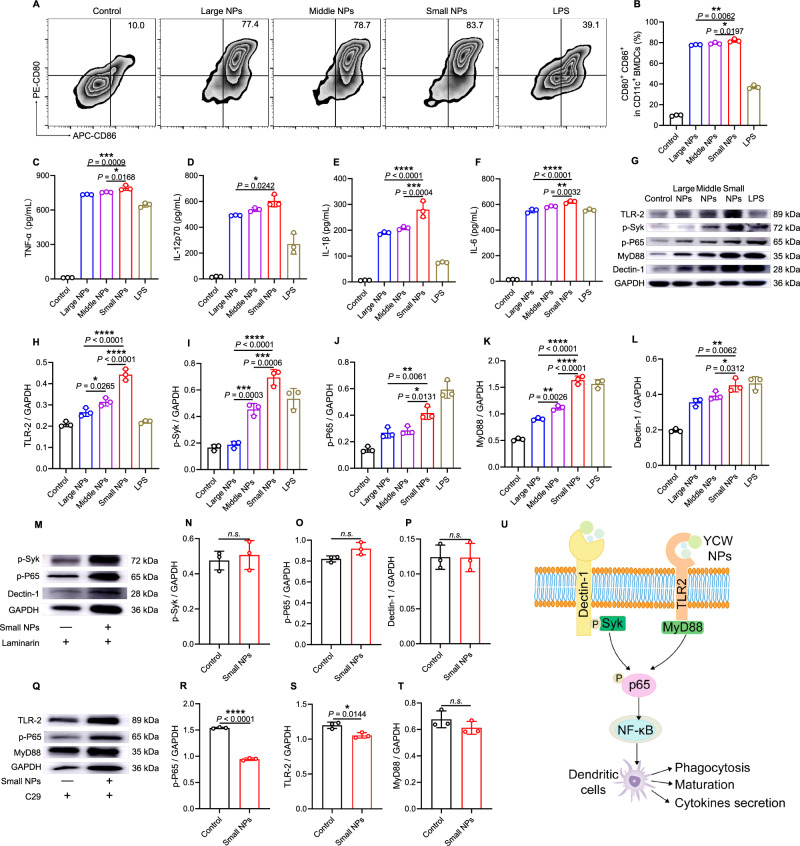
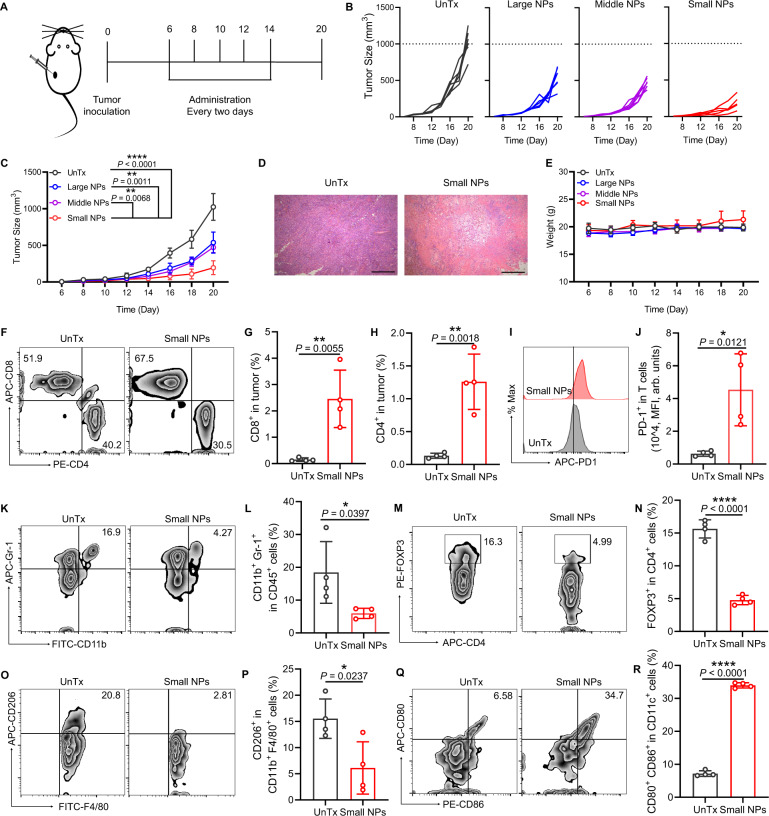
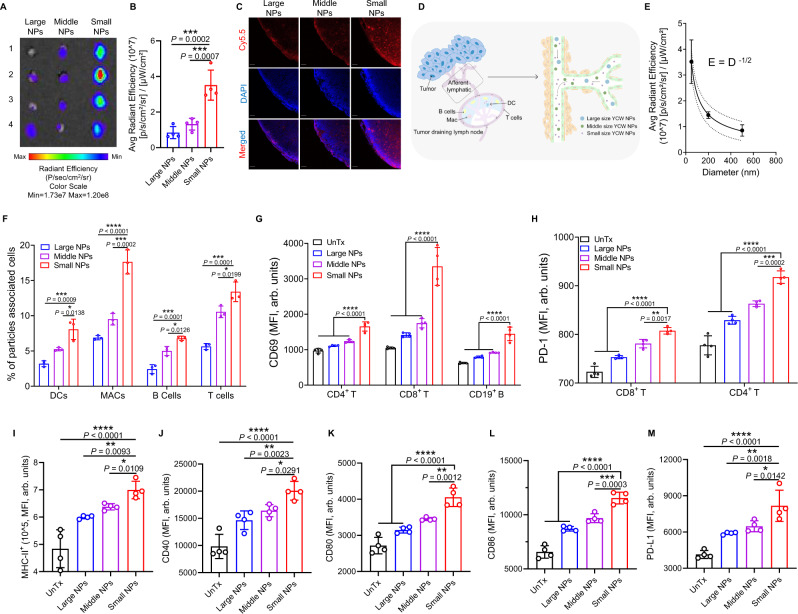
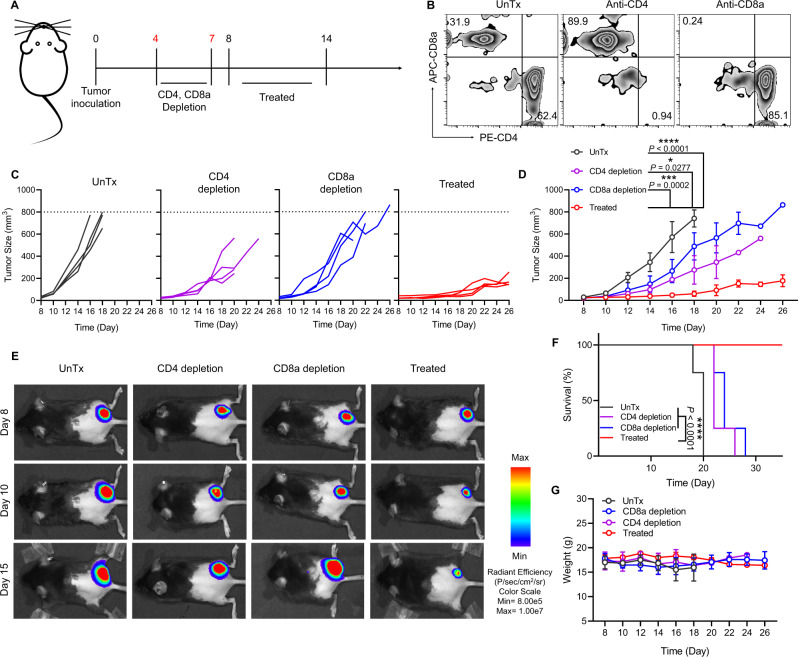
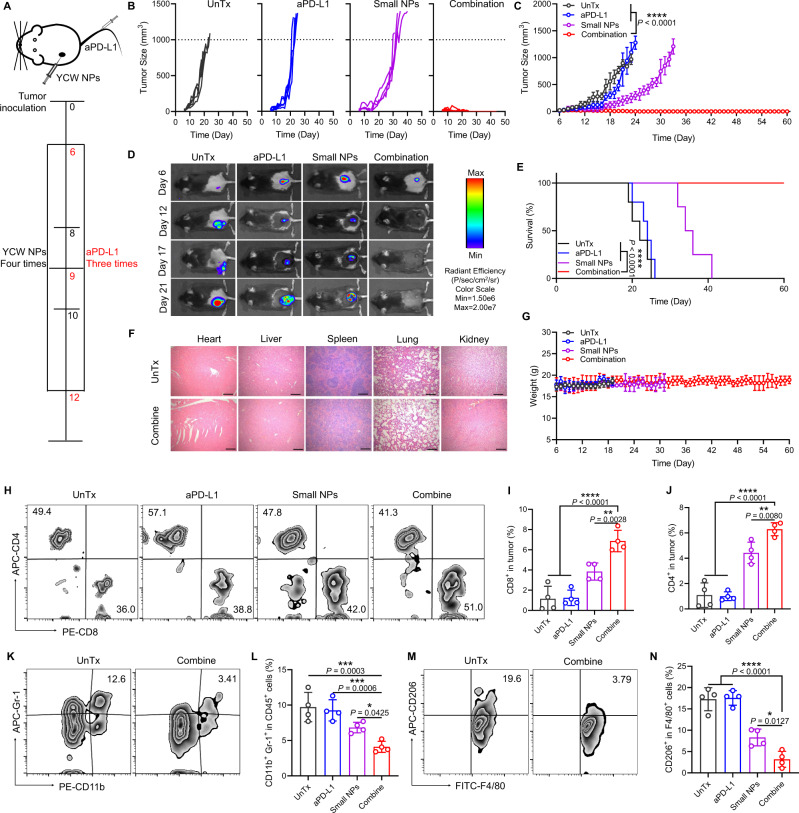
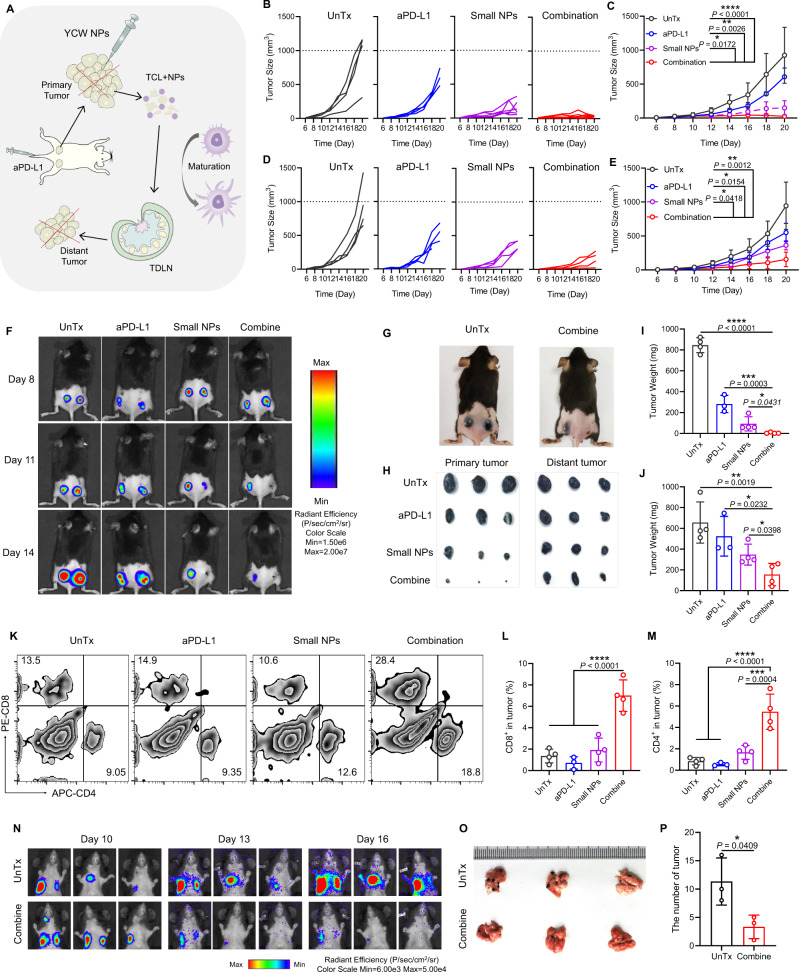
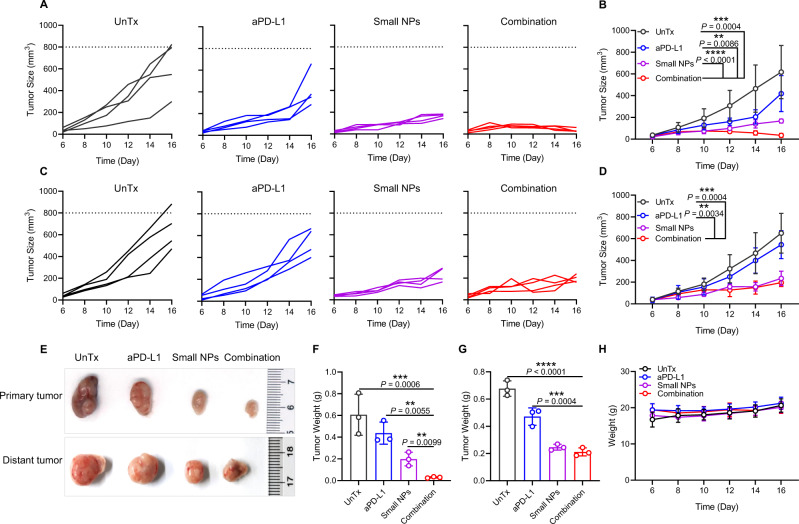
Microbe-based cancer immunotherapy has recently emerged as a hot topic for cancer treatment. However, serious limitations remain including infection associated side-effect and unsatisfactory outcomes in clinic trials. Here, we fabricate different sizes of nano-formulations derived from yeast cell wall (YCW NPs) by differential centrifugation. The induction of anticancer immunity of our formulations appears to inversely correlate with their size due to the ability to accumulate in tumor-draining lymph node (TDLN). Moreover, we use a percolation model to explain their distribution behavior toward TDLN. The abundance and functional orientation of each effector component are significantly improved not only in the microenvironment in tumor but also in the TDLN following small size YCW NPs treatment. In combination with programmed death-ligand 1 (PD-L1) blockade, we demonstrate anticancer efficiency in melanoma-challenged mice. We delineate potential strategy to target immunosuppressive microenvironment by microbe-based nanoparticles and highlight the role of size effect in microbe-based immune therapeutics.


Conflict of interest statement

The authors declare no competing interests.

Figures

Fig. 1
Fig. 1. Preparation and characterization of YCW particles.
A Schematic of preparation of YCW nanoparticles (NPs). B SEM and TEM images of every procedure from yeast to different size of YCW NPs. Upper left: SEM image of procedure (1)–(3), Scale bar = 3 μm. Bottom left: TEM image of procedure (1)–(3), Scale bar = 1 μm. Right: TEM image of procedure (4) (three different sizes of YCW NPs), Scale bar = 500 nm. C Distribution of three different sizes of YCW NPs observed by DLS. D SDS-PAGE of YCW particles, including MPs (micro-particles), Large NPs, Middle NPs and Small NPs, using Coomassie Brilliant Blue Staining. E The corresponding quantification of Cy5.5 (MFI) after DC2.4 incubation with Cy5.5-labelled particles for 24 h (n = 3, n means the number of samples included in an individual experiment). F Confocal imaging of Cy5.5-labelled YCW particles with different sizes after incubation with DC2.4 for 24 h (blue: DAPI; red: Cy5.5; Scale bar = 10 μm, n = 3). All experiments were run in triplicate. Statistical significance between different groups was obtained by one-way ANOVA using the Tukey post-test. ****P < 0.0001; **P < 0.01; *P < 0.05. Data are means ± SD. YCW: yeast cell wall, SEM: scanning electron microscopy, TEM: transmission electron microscopy, DLS: dynamic light scattering, MFI: mean fluorescence intensity, arb. units: arbitrary units.
Fig. 2
Fig. 2. Activation of dendritic cells induced by YCW NPs and its mechanism.
AB Activation of BMDCs after BMDCs incubation with different sizes YCW NPs (including large NPs, middle NPs, and small NPs) and LPS (positive control) for 24 h. A Representative dot plots of co-stimulatory molecules CD80 and CD86 expression on BMDCs and (B) corresponding quantification of BMDCs maturation (n = 3). CF Concentration of pro-inflammatory cytokines secreted by BMDCs after incubation with different sizes YCW NPs as indicated (n = 3). C TNF-α; D IL-12p70; E IL-1β; F IL-6. GL Representative Western blotting result of Dectin-1/Syk pathway and TLR2/MyD88 pathway from proteins of BMDCs after incubation with three YCW NPs and LPS for 24 h (n = 3), including (H) TLR2, (I) p-Syk, (J) p-P65, (K) MyD88, (L) Dectin-1. MP After utilizing Dectin-1 competitor laminarin for 2 h, representative western blotting result of Dectin-1/Syk pathway from proteins of BMDCs after incubation with small NPs for 24 h (n = 3), including (N) p-Syk, (O) p-P65, (P) Dectin-1. QT After utilizing TLR2 inhibitor C29 for 2 h, representative western blotting result of TLR2/MyD88 pathway from proteins of BMDCs after incubation with small NPs for 24 h (n = 3), including (R) p-P65, (S) TLR2, (T) MyD88. U A scheme revealing the mechanism of YCW NPs to activate dendritic cells via a Dectin-1 and TLR2-mediated manner. All experiments were run in triplicate. Statistical significance between different groups was obtained by Student’s t tests (two-tailed) (NP, RT) and one-way ANOVA using the Tukey post-test (B, CF, HL). ****P < 0.0001; ***P < 0.005; **P < 0.01; *P < 0.05. Data are means ± SD. BMDCs: bone marrow-derived dendritic cells, LPS: lipopolysaccharides. The samples for western blotting analysis derived from the same experiments and the blots were processed in parallel.
Fig. 3
Fig. 3. YCW NPs inhibited tumor growth by remodeling immunosuppressive tumor microenvironment.
A Schematic diagram of therapeutic strategy with YCW NPs, including large NPs, middle NPs and small NPs. BC Individual (B) and average (C) tumor growth curves in groups of untreated and treated with three different sizes of YCW NPs (UnTx: n = 6; Large NPs: n = 6; Middle NPs: n = 6; Small NPs: n = 5). D Representative H&E staining image of tumors in untreated and small size of YCW NPs treated group (Scale bar = 200 µm, n = 3). E Weight of mice of four different groups during treatment (UnTx: n = 6; Large NPs: n = 6; Middle NPs: n = 6; Small NPs: n = 5). F Representative flow cytometric analysis for CD8+ and CD4+ in tumors and (GH) corresponding quantitative analysis (n = 4) of untreated group and small NPs group. I Representative flow cytometric analysis for PD-1+ expression in T cells and (J) corresponding quantitative analysis. KR Analysis of TME of untreated group and small NPs group. K Flow cytometry plots of MDSCs (CD45+ CD11b+ Gr-1+ cells); L Proportion of CD11b+ Gr-1+ in CD45+ cells; M Flow cytometry plots of Tregs (CD3+ CD4+ FOXP3+ cells); N Proportion of FOXP3+ in CD4+ T cells; O Flow cytometry plots of TAMs (CD206+ CD11b+ F4/80+ CD45+ cells); P Proportion of CD206+ in CD11b+ F4/80+ CD45+ cells. Q Flow cytometry plots and (R) quantification of co-stimulatory factor CD80 and CD86 expression on DCs in tumors. n = 4. Statistical significance between different groups was obtained by Student’s t tests (two-tailed) (G, H, J, L, N, P, R) and one-way ANOVA using the Tukey post-test (C). ****P < 0.0001; **P < 0.01; *P < 0.05. Data are means ± SD. MFI: mean fluorescence intensity, arb. units: arbitrary units.
Fig. 4
Fig. 4. Accumulation of YCW NPs to tumor draining lymph nodes (TDLNs) and activation of immune cells in vivo.
A Fluorescence imaging of TDLNs ex vivo after injection of three different YCW NPs for 48 h. B Signal quantification of Cy5.5-labelled YCW NPs in TDLNs (n = 4). C Representative confocal imaging of TDLNs to monitor the signal of Cy5.5 (blue: DAPI; red: Cy5.5; Scale bar = 50 µm, n = 3). D Imaging of draining lymph nodes and model of the distribution of YCW NPs in lymph nodes vessels. E Mathematical model to explain the relationship between size and distribution behavior (n = 3). F Proportions of particles associated cells of tumor draining lymph nodes after intratumorally injection for 48 h (n = 3). G Corresponding quantification of MFI of CD69 expression on CD4+ T cells, CD8+ T cells, CD19+ B cells (n = 4) after injection of YCW NPs for 48 h. H Corresponding quantification of MFI of PD-1 expression on CD4+ T cells and CD8+ T cells (n = 4) after injection of YCW NPs for 48 h. IM Corresponding quantification of MFI of MHC-II (I); CD40 (J); CD80 (K); CD86 (L); PD-L1 (M) expression on DCs (n = 4) after injection of YCW NPs for 48 h. Statistical significance between different groups was obtained by one-way ANOVA using the Tukey post-test. ****P < 0.0001; ***P < 0.005; **P < 0.01; *P < 0.05. Data are means ± SD. DC: dendritic cells, MFI: mean fluorescence intensity, arb. units: arbitrary units.
Fig. 5
Fig. 5. T-cell-mediated anti-tumor immune responses induced by small size of YCW NPs.
A Schematic diagram of therapeutic strategy with T cell depletion, including CD4 depletion and CD8a depletion. B Representative flow cytometric analysis for CD8+ and CD4+ in CD3+ T cells in peripheral blood to confirm the depletion of CD4 and CD8a in vivo. CD Individual (C) and average (D) tumor growth curves in four groups, including UnTx group, CD4 depletion group, CD8a depletion group and treated group. E Fluorescence imaging of B16-luc established mice on day 8, 10, 15 in four different groups. F Survival curves for the depletion groups and treated group. G Weight curves of different groups. Statistical significance was obtained by one-way ANOVA using the Tukey post-test (n = 4). ****P < 0.0001; ***P < 0.005; *P < 0.05. Data are means ± SD. MFI: mean fluorescence intensity, arb. units: arbitrary units.
Fig. 6
Fig. 6. Therapeutic efficacy of YCW NPs in combination with PD-L1 blockade.
A Schematic diagram of combination treatment, including UnTx group, aPD-L1 group, small NPs group, combination group. BC Individual (B) and average (C) tumor growth curves in four groups (UnTx: n = 5; aPD-L1: n = 5; Small NPs: n = 4; Combination: n = 6) within 60 days. D In vivo bioluminescence imaging of B16-luc established mice in four different groups. E Survival curves of combination therapy. F Representative H&E staining imaging of main organs, including heart, liver, spleen, lung, kidney in group of untreated and combination (Scale bar = 200 µm, n = 3). G Weight curve of different groups. H Flow cytometry plots of CD4+ T cells and CD8+ T cells of tumors in four groups. I Corresponding quantitative analysis of CD8+ T cells of tumor. J Corresponding quantitative analysis of CD4+ T cells of tumor. K Flow cytometry plots of MDSCs (CD45+ CD11b+ Gr-1+ cells) in untreated and combination group. L Corresponding quantitative analysis of CD11b+ Gr-1+ in CD45+ cells. M Flow cytometry plots of TAMs (CD206+ CD11b+ F4/80+ CD45+ cells) in untreated and combination group; N Corresponding quantitative analysis of CD206+ in CD11b+ F4/80+ CD45+ cells (n = 4). Statistical significance between combination group and other groups was obtained by one-way ANOVA using the Tukey post-test. ****P < 0.0001; ***P < 0.005; **P < 0.01. Data are means ± SD.
Fig. 7
Fig. 7. YCW NPs in combination with PD-L1 blockade inhibit metastatic tumor growth.
A Schematic diagram of applying combination therapy to induce anti-tumor immune responses systemically. BC Individual (B) and average (C) tumor growth curves in four groups of primary tumors, including UnTx group (n = 4), aPD-L1 group (n = 4), small NPs group (n = 6), combination group (n = 6). DE Individual (D) and average (E) tumor growth curves of distant tumors (n = 4) in four different groups. F Fluorescence imaging of B16-luc established mice on day 8, 11, 14. G Representative photographs of mice in untreated and combination group on day 14. H Photographs and IJ weight of primary tumors and distant tumors within 20 days (UnTx: n = 4; aPD-L1: n = 3; Small NPs: n = 4; Combine: n = 4). K Flow cytometry plots of CD4+ T cells and CD8+ T cells of distant tumors in four groups. L Corresponding quantitative analysis of CD8+ T cells of distant tumor. M Corresponding quantitative analysis of CD4+ T cells of distant tumor (n = 4). (N) Bioluminescence imaging of lung metastasis established by B16-luc in vivo on day 10, 13, 16 in untreated and combination groups. O Imaging of whole lung tissue ex vivo. (P) Number of tumors in lung (n = 3). Statistical significance between different groups was obtained by Student’s t tests (two-tailed) P and one-way ANOVA using the Tukey post-test (C, E, I, J, L, M). ****P < 0.0001; ***P < 0.005; **P < 0.01; *P < 0.05. Data are means ± SD.
Fig. 8
Fig. 8. Combination treatment induced systemic anti-tumor immune response against CT26 tumor.
AB Individual (A) and average (B) tumor growth curves in untreated and treated groups of primary tumors, including UnTx group, aPD-L1 group, Small NPs group, combination group. CD Individual (C) and average (D) tumor growth curves of distant tumors in four different groups (n = 4). E Photographs and (FG) corresponding quantitative weight of primary tumors and distant tumors of four groups (n = 3). H Weight of mice in four groups during treatment (n = 4). Statistical significance was obtained by one-way ANOVA using the Tukey post-test. ****P < 0.0001; ***P < 0.005; **P < 0.01. Data are means ± SD.

References

    1. Irvine DJ, Dane EL. Enhancing cancer immunotherapy with nanomedicine. Nat. Rev. Immunol. 2020;20:321–334. - PMC - PubMed
    1. Sanmamed MF, Chen L. A paradigm shift in cancer immunotherapy: from enhancement to normalization. Cell. 2018;175:313–326. - PMC - PubMed
    1. Hubbell J, Thomas S, Swartz M. Materials engineering for immunomodulation. Nature. 2009;462:449–460. - PubMed
    1. Hegde PS, Chen DS. Top 10 Challenges in Cancer Immunotherapy. Immunity. 2020;52:17–35. - PubMed
    1. Haanen JBAG. Converting Cold into Hot Tumors by Combining Immunotherapies. Cell. 2017;170:1055–1056. - PubMed

Publication types

MeSH terms