. 2022 Jan 10;13(1):120.
doi: 10.1038/s41467-021-27753-z.

Context-independent encoding of passive and active self-motion in vestibular afferent fibers during locomotion in primates

Affiliations

Context-independent encoding of passive and active self-motion in vestibular afferent fibers during locomotion in primates

Isabelle Mackrous et al. Nat Commun. .

Abstract

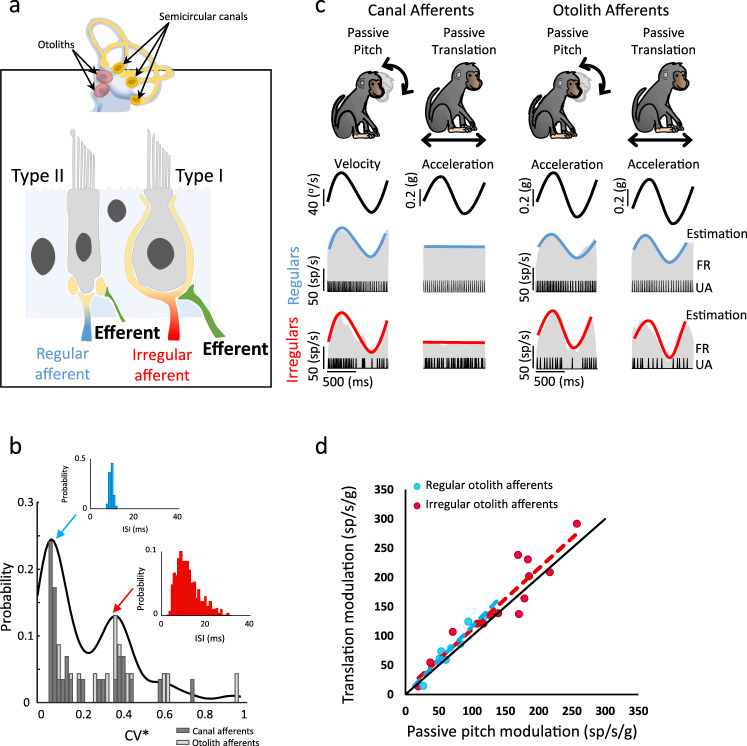
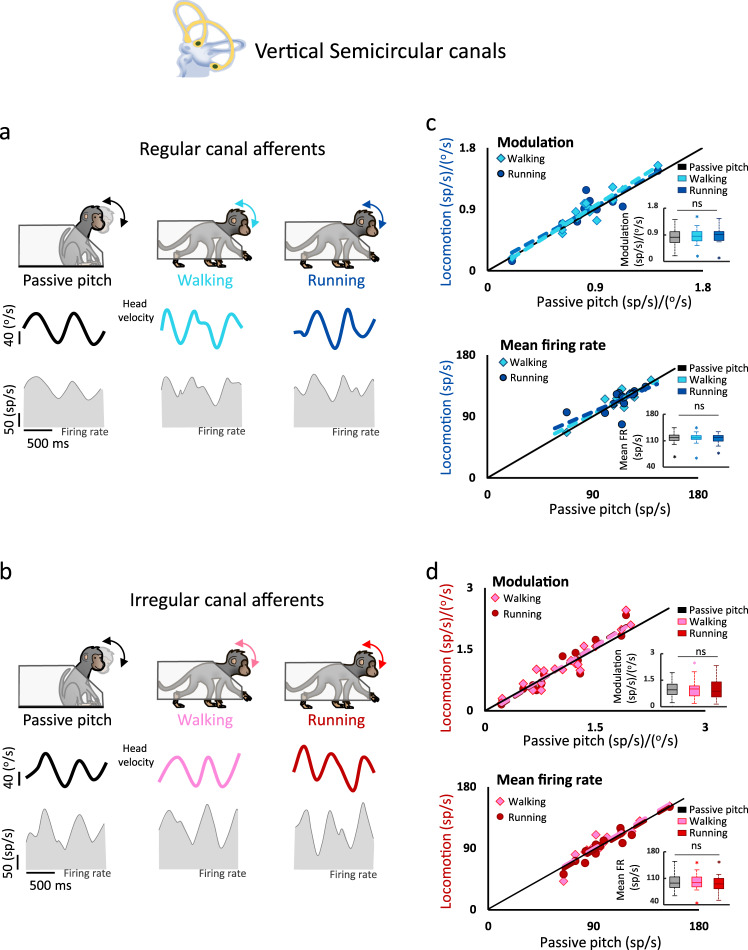
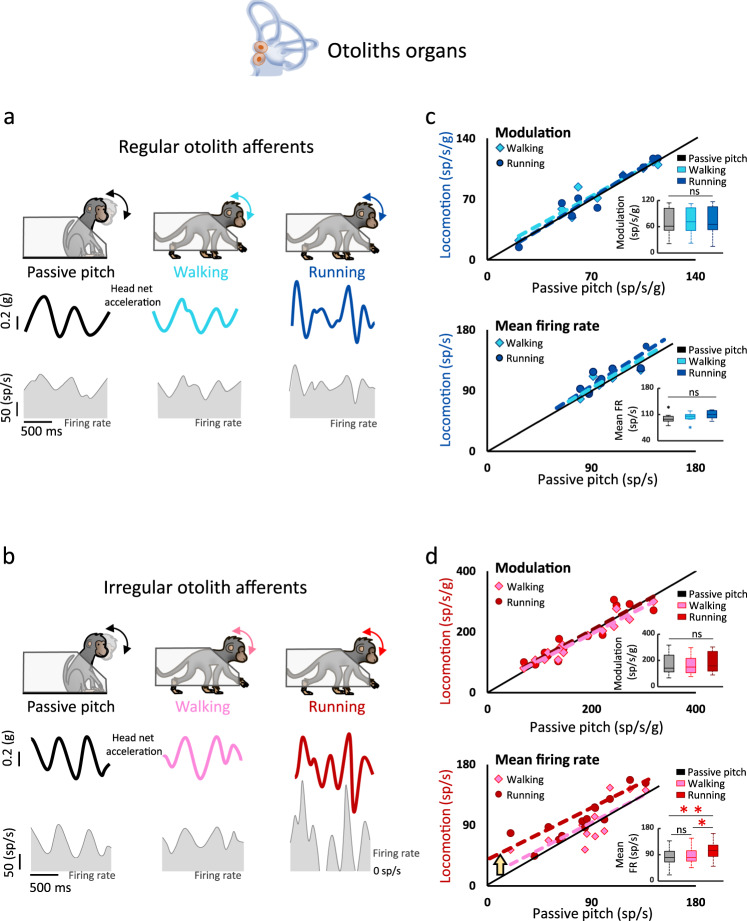
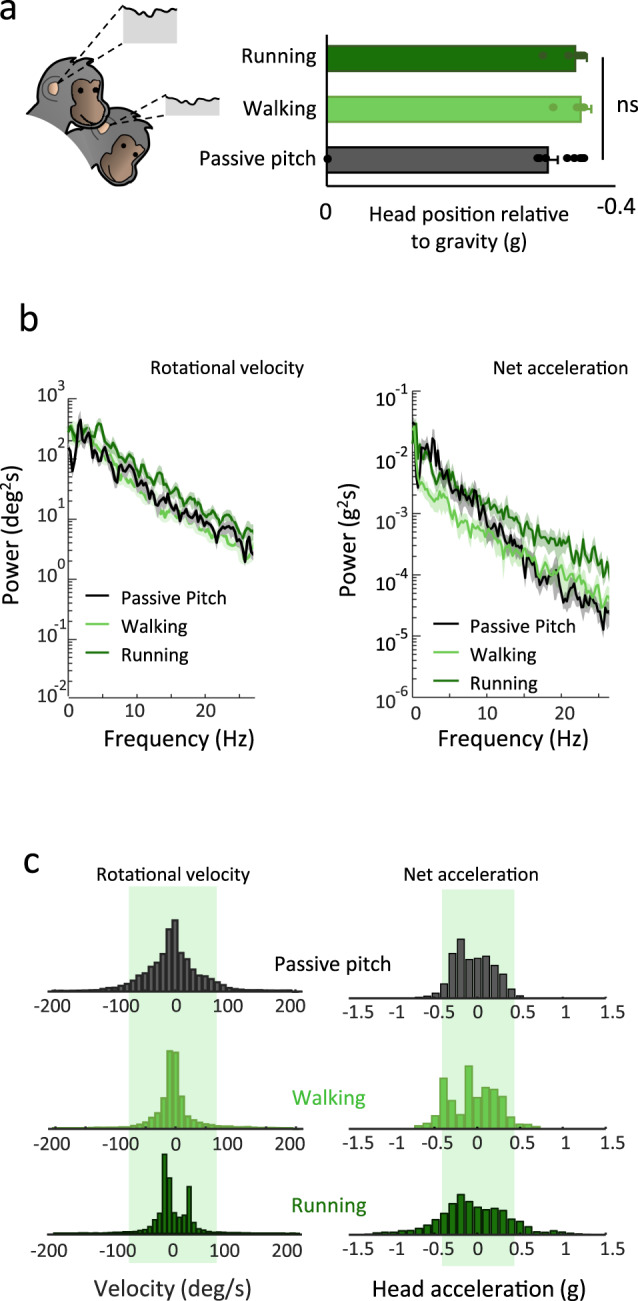
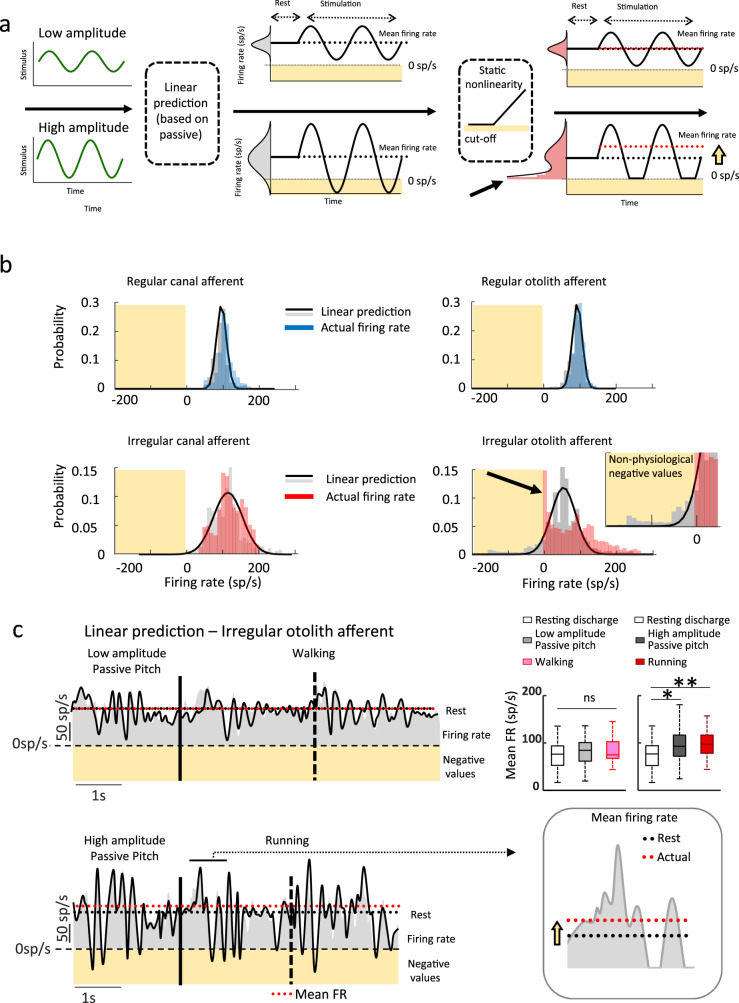
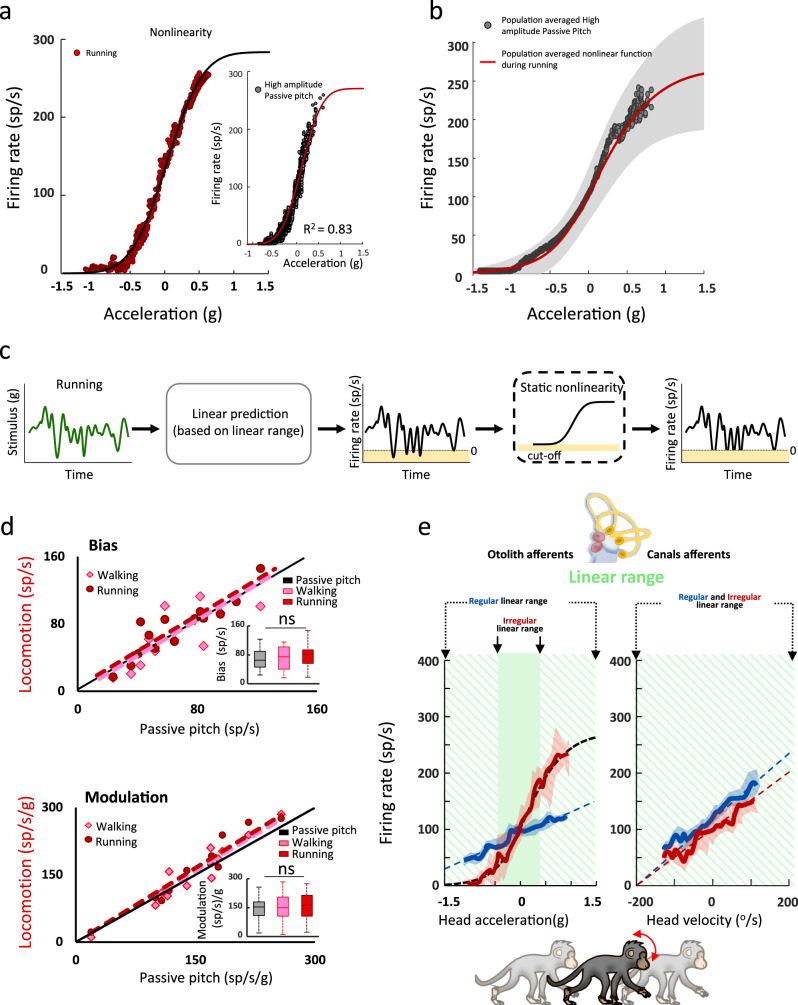
The vestibular system detects head motion to coordinate vital reflexes and provide our sense of balance and spatial orientation. A long-standing hypothesis has been that projections from the central vestibular system back to the vestibular sensory organs (i.e., the efferent vestibular system) mediate adaptive sensory coding during voluntary locomotion. However, direct proof for this idea has been lacking. Here we recorded from individual semicircular canal and otolith afferents during walking and running in monkeys. Using a combination of mathematical modeling and nonlinear analysis, we show that afferent encoding is actually identical across passive and active conditions, irrespective of context. Thus, taken together our results are instead consistent with the view that the vestibular periphery relays robust information to the brain during primate locomotion, suggesting that context-dependent modulation instead occurs centrally to ensure that coding is consistent with behavioral goals during locomotion.


Conflict of interest statement

The authors declare no competing interests.

Figures

Fig. 1
Fig. 1. Characterization of vestibular afferents.
a The vestibular labyrinth comprises five sensory organs: the three semicircular canals and the two otoliths. Within the sensory epithelia of each sensory organ (indicated by arrows) are the receptor cells, which in mammals comprise two types of hair cells: cylindrical type II and flask-shaped type I hair cells. Both canal and otolith afferent fibers are classified on the basis of the regularity of their resting discharge, and in general, irregular afferents (red) preferentially transmit information from the type I hair cells, whereas regular afferents (blue) preferentially transmit information from type II hair cells. The vestibular efferent system (green) consists of a group of neurons located in the brainstem neighboring the abducens nucleus, which projects back out to the vestibular periphery. b Bimodal distribution of the normalized CV (CV*) for all recorded afferents (Hartigan’s dip test, p = 0.04, p = 0.02). Inset shows interspike interval distribution for an example regular (blue) and an example irregular (red) vestibular afferent. c Characterization protocol for vestibular afferents. Semicircular canals afferents encode head velocity during head pitch but not during body translation whereas otoliths afferents encode linear head acceleration during both protocols. d Otolith afferents have similar sensitivity to passive translation and passive pitch (regression slope: regular otolith afferents: p = 2.1 × 10−4, CI = 0.42 VAF: translation = 0.92 ± 0.03, passive pitch = 0.95 ± 0.05; Irregular otoliths: p = 1.0 × 10−6, CI = 0.25, VAF: translation = 0.82 ± 0.04, passive pitch = 0.89 ± 0.06). Source data are provided as a Source Data file.
Fig. 2
Fig. 2. Semicircular canal afferents similarly respond to head velocity during passively applied pitch and locomotion.
a, b Semicircular canal afferents robustly respond in the passive pitch, walking, and running conditions. Bottom panels show the firing modulation (shaded area) of an example regular afferent (a) and example irregular afferent (b) in each condition. c Population comparison of regular semicircular canal afferent responses during locomotion and passive stimulation (n = 15). Neuronal modulation (top panel) as well as mean firing rates (bottom panel) were comparable across all conditions, as shown by the slopes of the regressions (top panel; walking: p = 3.9 × 10−8, slope = 1.1, CI = ±0.21 and running: p = 7.0 × 10−6 slope = 0.97, CI = ±0.28; bottom panel; walking: p = 3.0 × 10−6, slope = 1.1, CI = ±0.2; running: p = 0.02, slope = 1.1, CI = ±0.35; insets: ANOVA, F(2,28) = 1.2, p = 0.31 and F(2,28) = 0.38, p = 0.96 for modulation and mean firing rate). d Population comparison of irregular semicircular canal afferent responses during locomotion and passive stimulation (n = 17). Response modulation (top panel) as well as mean firing rates (bottom panel) were similarly comparable across conditions (top panel: walking: p = 2.4 × 10−8, slope = 1.1, CI = ±0.22 and running: p = 3.0 × 10−8, slope = 1.1, CI = ±0.21; bottom panel: walking: p = 1.3 × 10−8, slope = 1.05, CI = ±0.19 and running: p = 1.6 × 10−7, slope = 1.1, CI = ±0.19; inset: ANOVA F(2,32) = 0.16, p = 0.85 and F(2,32) = 1.7, p = 0.20 for the modulation and mean firing rate). For all boxplots, the central mark indicates the median, the middle box indicates the 25th and 75th percentiles and the whiskers extend to the most extreme data points not considered outliers. Source data are provided as a Source Data file.
Fig. 3
Fig. 3. Irregular otolith afferents demonstrate an increase in mean firing rate during running versus walking/passive conditions.
a, b Regular and irregular otolith afferents robustly respond in the passive, walking and running conditions. Bottom panels show the firing modulation (shaded area) of an example regular afferent (a) and an example irregular afferent (b) in each condition. c Population comparison of regular otolith canal afferent responses (n = 9). Neuronal modulations (top panel) and mean firing rates (bottom panel) were comparable across all conditions as shown by the slopes of the regressions (top panel; walking: p = 0.001, slope = 0.95, CI = ±0.27 and running: p =2.6 × 10−4, slope = 0.93, CI = ±0.35; bottom panel; walking: p = 0.03, slope = 1.01, CI = ±0.37; running: p = 0.05, slope = 1.07, CI = ±0.28; inset: ANOVA, F(2,16) = 0.45, p = 0.65 and F(2,16) = 2.7, p = 0.09 for the modulation and mean firing rate, respectively). d Population comparison of irregular otolith afferent responses (n = 14). Neuronal modulation was comparable during locomotion and passive stimulation (walking: p = 1.3 × 10−8, slope = 0.97, CI = ±0.13 and running: p = 4.0 × 10−6, slope = 0.92, CI = ±0.26, respectively; inset: ANOVA, F(2,26) = 1.03, p = 0.37). In contrast, mean firing rate was higher (gold arrow) during running compared to passive pitch and walking (walking: slope = 0.84, p = 0.001, CI = ±0.30; intercept = 14.6 sp/s, p = 0.49; running: slope = 0.77, p = 0.001, CI = ±0.30; intercept = 33.7 sp/s, p = 0.007; inset: ANOVA, F(2,26) = 6.0, p = 0.007). For all boxplots, the central mark indicates the median, the middle box indicates the 25th and 75th percentiles and the whiskers extend to the most extreme data points not considered outliers. Source data are provided as a Source Data file.
Fig. 4
Fig. 4. Comparison of head motion during locomotion and passive conditions.
a Average head position was similar in the three conditions (mean ± 1 STD, ANOVA, F(2,26) = 1.9, p = 0.17). b The spectral power of rotational pitch velocity was comparable during passively applied stimulation and walking, but higher during running (left panel). Similarly, the mean spectral power of net acceleration was greater during running than during passively applied pitch and walking (right panel) which did not differ from each other. Shaded area represent ± 1 STD. c Comparison of probability distributions of motion amplitude across conditions. The shaded green areas represent ± 1.5 STD of movement amplitudes generated by passive stimulation. For the passive pitch, walking, and running conditions, 3%, 2 and 4% of the rotational velocity values were outside of this range, respectively. In contrast, the probability of linear acceleration reaching values beyond ±1.5 SD of the walking-matched passive condition (shaded green area) was more than two times greater during running compared to the walking and passive conditions (15% versus 5 and 3%, respectively)—corresponding to significantly higher kurtosis and standard deviation values in this condition (all p-values < 0.03). Source data are provided as a Source Data file.
Fig. 5
Fig. 5. Irregular otolith afferents show nonlinear responses during running.
a A hypothetical linear neuron’s response to low (top) and high (bottom) amplitude stimulation. In response to high amplitude stimulation, the model predicts negative values resulting in physiological inhibitory cutoff that causes an increase in overall mean firing rate relative to the afferent’s resting discharge. The higher probability of having negative values that result in inhibitory cutoff increases the mean firing rate. b Actual and linear model-predicted probability distributions all afferent classes. The passive-based linear model (Eq. 3) predicts impossible negative firing rates (yellow shaded area; in panels a, b, and c). The probability of zero firing rate (black arrow) was significantly higher for irregular otolith afferents than the other classes of afferents (one-way ANOVA, F(3,45) = 13.45, p = 2.5 × 10−6). c Actual firing rates and linear model predictions across conditions. As shown in panel b, neuron’s nonlinear response (i.e., inhibitory cutoff) resulted in an increase in mean firing rate during high amplitude passive stimulation and running (VAF = 0. 35, and 0.37) for the high amplitude passive pitch and running respectively, while this was not the case for the lower-amplitude stimulation (i.e., walking and walking-matched passive pitch, (VAF = 0.89 and 0.86, respectively). Top right insets: Population-averaged mean firing rates were significantly higher than resting discharges during high amplitude passive motion and running (ANOVA, F(4,52) = 7.8, p = 0.002), which did not differ from each other (p = 0.85). Mean firing rate and resting discharge were comparable for low-amplitude passive pitch and walking were comparable (p = 0.20). For all boxplots, the central mark indicates the median, the middle box indicates the 25th and 75th percentiles and the whiskers extend to the most extreme data points not considered outliers. Source data are provided as a Source Data file.
Fig. 6
Fig. 6. Taking into account response nonlinearity reveals that irregular otolith afferents similarly encode locomotion and passive motion.
a During running, the example irregular otolith afferent’s response as a function of acceleration was well fit by a sigmoid (black sigmoid). The same nonlinearity accurately described this afferent’s responses during high amplitude passive head motion (inset, R2 = 0.83). b The population-averaged response as a function of acceleration was comparable during high amplitude passive head motion (gray dots) and running (red sigmoid). Shaded area represents ± 1 STD of the population average nonlinear function during running. c Schematic of the linear-nonlinear cascade model. In this model the output firing rate is calculated by first linearly filtering the input stimulus and then passing the resulting linear prediction through a static nonlinear function. d Top panel: The bias estimated using the linear-nonlinear cascade model was comparable between conditions (walking: slope = 1.01, p = 0.002, CI = 0.45, intercept = 5.9 sp/s, p = 0.6; running: slope = 1.06, p = 3.2 × 10−4, CI = 0.35, intercept = 6.9sp/s, p = 0.07). Inset: population-averaged bias values for each condition (ANOVA, F(2,26) = 1.7, p = 0.25). Bottom panel: The modulation of irregular otolith afferents is comparable across conditions when using a nonlinear model that accounts for the afferent’s responses to large-amplitude head accelerations (walking: slope = 1.06, p = 3.0 × 10−6, CI = 0.25; running: slope = 1.09, p = 2.8 × 10−7, CI = 0.20; inset: ANOVA, F(2,26) = 2.1, p = 0.14). e Schematic showing that the responses of semicircular canal afferent and regular otolith afferent responses remain in their linear coding range during all conditions (striped green area), but irregular otolith afferent responses extend into a nonlinear coding range during running. Shaded areas represent ± 1 STD of the population average firing rate. For all boxplots, the central mark indicates the median, the middle box indicates the 25th and 75th percentiles and the whiskers extend to the most extreme data points not considered outliers. Source data are provided as a Source Data file.

References

    1. Cullen KE. Vestibular processing during natural self-motion: implications for perception and action. Nat. Rev. Neurosci. 2019;20:346–363. - PMC - PubMed
    1. Goldberg JM. Afferent diversity and the organization of central vestibular pathways. Exp. Brain Res. 2000;130:277–297. - PMC - PubMed
    1. Lysakowski, A. & Goldberg, J. M. In The Vestibular System (eds. Stephen M. Highstein, Richard R. Fay, & Arthur N. Popper) 57–152 (Springer New York, 2004).
    1. Meredith GE. Comparative view of the central organization of afferent and efferent circuitry for the inner ear. Acta Biol. Hung. 1988;39:229–249. - PubMed
    1. Cullen KE, Wei RH. Differences in the structure and function of the vestibular efferent system among vertebrates. Front. Neurosci. 2021;15:684800. - PMC - PubMed

Publication types