Meta-Analysis
. 2022 Jan 10;13(1):40.
doi: 10.1038/s41467-021-27754-y.

DNA methylation aging and transcriptomic studies in horses

Affiliations
Meta-Analysis

DNA methylation aging and transcriptomic studies in horses

Steve Horvath et al. Nat Commun. .

Abstract

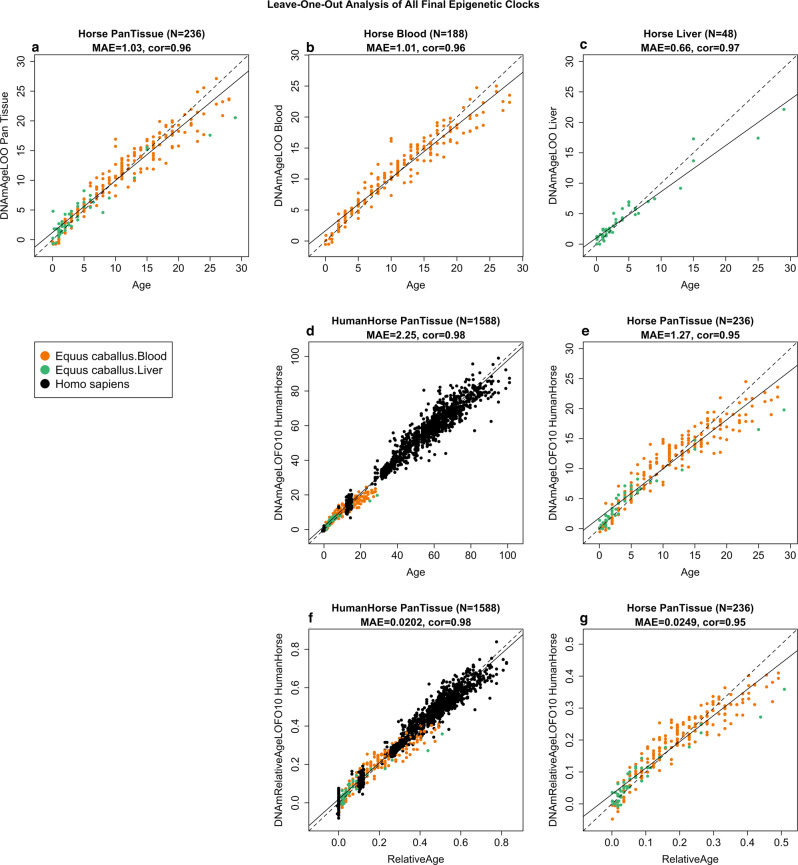
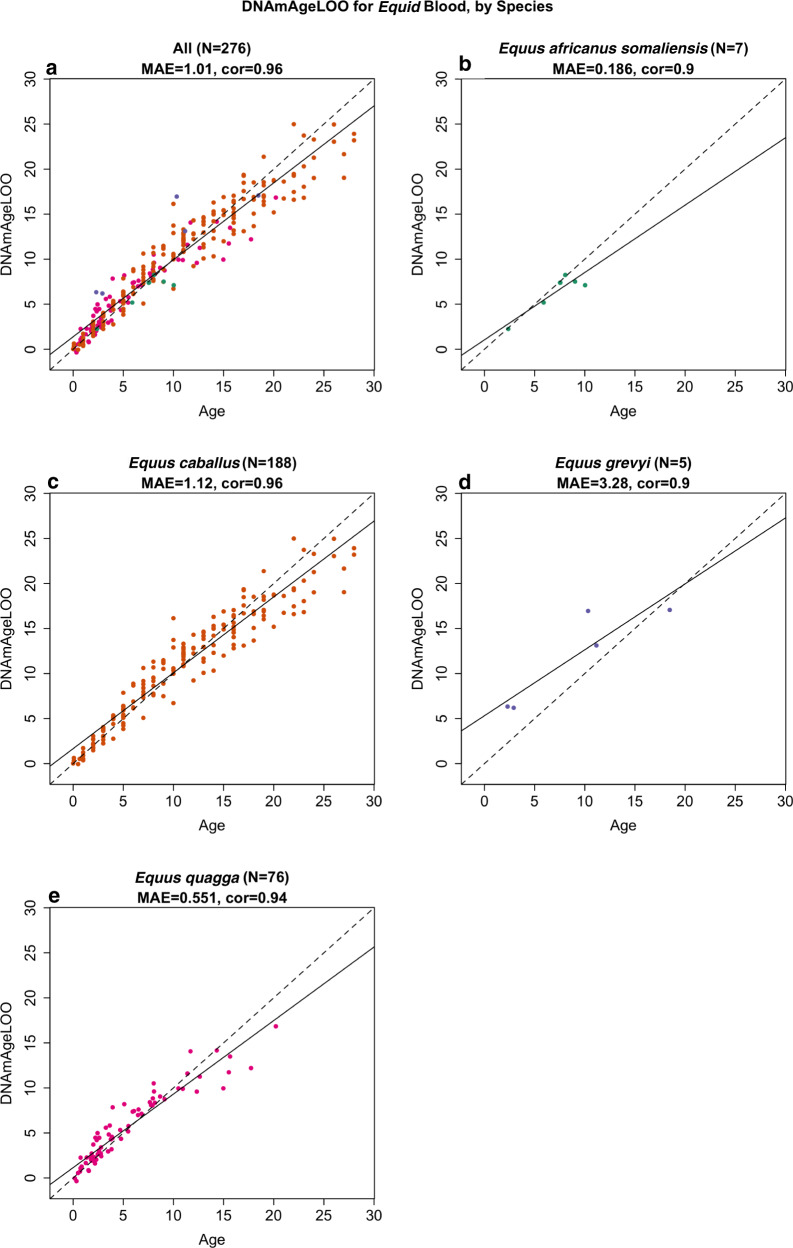
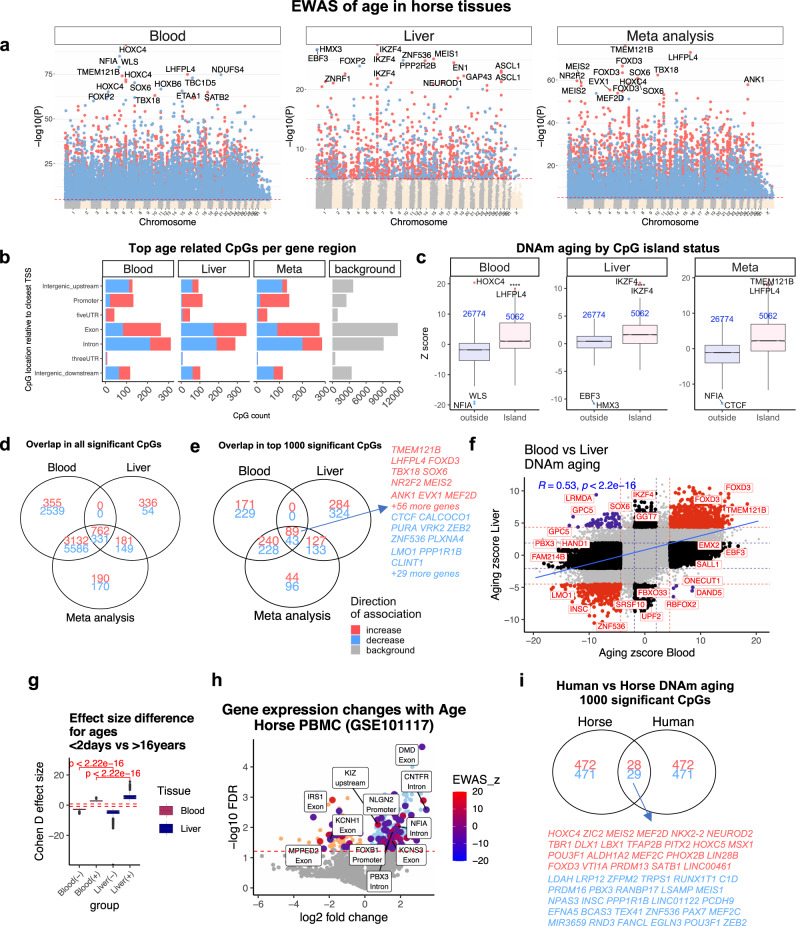
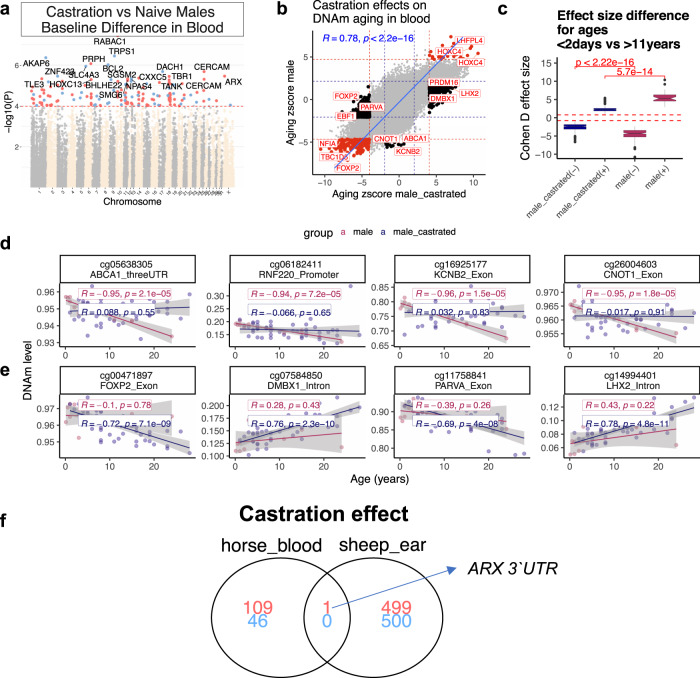
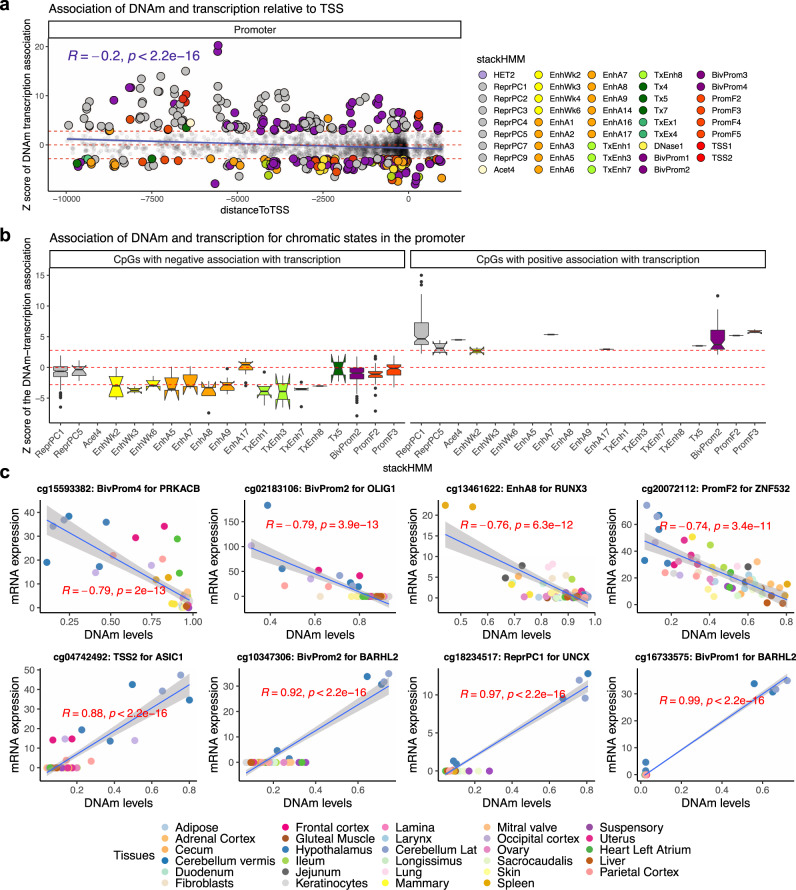
Cytosine methylation patterns have not yet been thoroughly studied in horses. Here, we profile n = 333 samples from 42 horse tissue types at loci that are highly conserved between mammalian species using a custom array (HorvathMammalMethylChip40). Using the blood and liver tissues from horses, we develop five epigenetic aging clocks: a multi-tissue clock, a blood clock, a liver clock and two dual-species clocks that apply to both horses and humans. In addition, using blood methylation data from three additional equid species (plains zebra, Grevy's zebras and Somali asses), we develop another clock that applies across all equid species. Castration does not significantly impact the epigenetic aging rate of blood or liver samples from horses. Methylation and RNA data from the same tissues define the relationship between methylation and RNA expression across horse tissues. We expect that the multi-tissue atlas will become a valuable resource.


Conflict of interest statement

S.H. is a founder of the non-profit Epigenetic Clock Development Foundation, which plans to license several patents from his employer UC Regents. These patents list S.H. as an inventor. The other authors declare no competing interests.

Figures

Fig. 1
Fig. 1. Cross-validation study of epigenetic clocks for horses and humans.
Chronological age (x-axis) versus leave-one-sample-out (LOSO) estimate of DNA methylation age (y-axis, in units of years) for a the multi-tissue clock for horse blood and liver, b horse blood clock, c horse liver clock. d Ten-fold cross-validation (LOFO10) analysis of the human-horse clock for chronological age. Dots are colored by species (black = human) and horse tissue type (green = liver, orange = blood). e Same as panel d but restricted to horses. f Ten-fold cross-validation analysis of the human–horse clock for relative age, which is the ratio of chronological age to the maximum recorded lifespan of the respective species. g The same as panel d but restricted to horses. Each panel reports sample size, correlation coefficient, median absolute error (MAE).
Fig. 2
Fig. 2. The equid clock for blood samples.
Blood samples (dots) are colored by species as indicated in the respective panels. Leave one sample out cross-validation estimate of age (y-axis) versus chronological age in a all species combined, b Equus africanus somaliensis, c Equus caballus, d Equus grevyi, e Equus quagga. Each panel reports the number of blood samples, median absolute error in units of years, and Pearson correlation.
Fig. 3
Fig. 3. EWAS of age in horse blood and liver.
Stouffer meta-analysis results between blood (n = 188) and liver (n = 48). a EWAS of age (Pearson correlation test) versus horse genome coordinates (Equus_caballus.EquCab3.0.100). Red dotted line corresponds to p = 10−5 (blood false discovery rate FDR < 2.5e−5, liver FDR < 0.00018, meta FDR < 3e−5). Significant CpGs are colored in red (age-related increase) and blue (decrease). Top 15 CpGs are labeled by neighboring genes. b Top CpGs in each tissue relative to adjacent transcriptional start sites. Gray corresponds to 31836 CpGs in the horse genome. c Box plot of age effects versus CpG island status. Z statistics resulted from applying the Fisher z-transformation to Pearson correlation coefficients. The numbers of CpGs are reported in blue text. The top four age-related CpGs in each tissue are labeled by adjacent genes. Boxes show the interquartile range (IQR) of the Z scores. The notches indicate the 95% confidence interval of the median. The whiskers represent 1.5*IQR length of the Z scores. Venn diagram of the overlap of (d) all significant CpGs, e) top 1000 (500 in each direction) significant CpGs. Significance thresholds: blood, p < 9.2e−27 (FDR < 2.6e−25); liver, p < 6.9e−6 (FDR < 1.3e−4); meta-analysis, p < 1.2e−20 (FDR < 2.4e−19). f Age effects in blood versus liver. Red dotted line: p < 10−4; blue dotted line: p > 0.05; Red dots: shared CpGs; blue dots: CpGs whose age correlation differs between blood and liver tissue. R: Pearson correlation coefficient. g Effect size (Cohen’s D) of age group (<2 days versus >16 years). Top 500 CpGs that gain methylation (denoted by +) and top 500 CpGs that lose methylation (denoted −). Red dashed line corresponds to Cohen d = |0.8|. Kruskal–Wallis test for tissue comparison. h Age-related mRNA changes in horse blood (GSE101117). Log (base 10) transformed FDR (y-axis) based on linear regression. The large blue and red dots report genes with at least one CpG that change with age in horse blood methylation data (Supplementary Data 3). i Venn diagram of the top 1000 (500 per direction) significant age-related CpGs in the blood of horses and humans (human n = 267, aged between 12 and 68).
Fig. 4
Fig. 4. Castration moderately alters DNAm profile of horse blood.
a Manhattan plots of the EWAS of castration, in the blood of male horses. Statistics: Multivariate linear regression model whose dependent variables are CpGs and whose co-variates are castration status and chronological age. Sample size: geldings, 48; stallions, 10. The coordinates are estimated based on Equus_caballus.EquCab3.0.100 genome assembly. The direction of associations with p < 10−4 (FDR < 0.02, red dotted line) is highlighted by red (increase) and blue (decrease) colors. Top 15 CpGs (p < 4.7e−6, FDR < 0.008) were labeled by the neighboring genes. b Sector plot of aging effects on blood methylation levels by castration status in male horses. The Z statistics result from applying the Fisher z-transformation to the Pearson correlation between CpG and age. Red-dotted line: p < 10−4; blue-dotted line: p > 0.05; Red dots: age-related CpGs not affected by castration; black dots: CpGs whose aging pattern differs between geldings and stallions. c The effect size of age on DNAm is larger in blood of naïve vs the castrated male horses. The effect size is calculated by Cohen D method between age groups <2 days vs. >11 years horses. Only the top 1000 significant CpGs per tissue (500 per direction) are presented in the box plot. (+) and (−) indicate the direction of change for each group. The dashed red line indicates Cohen d > |0.8 | , which means a large effect size. d, e Scatter plots of selected CpGs that change with age only stallions (d), or geldings (e) blood. The red dots and blue dots in the scatter plot correspond to blood samples from geldings and stallions, respectively. The shading visualizes the 95% confidence band of the linear regression model. R: Pearson correlation coefficient. These relationships require validation in new data and also a consideration for a potential confounding effect of horse breeds. f The overlap of castration methylation signatures between horse blood and sheep ears. Although we considered the top 1 thousand significant CpGs in sheep (500 in each direction), we only found one overlapping CpG.
Fig. 5
Fig. 5. DNAm levels in promoters relate to gene expression changes across horse tissues.
This analysis was based on a Pearson correlation of DNAm and mRNA level of the adjacent genes in 29 different tissues from two female horses. Each CpG was assigned to one gene based on the closest distance to the transcriptional start sites. a, b The y-axis reports a Z statistic of a correlation test between the methylation level of each CpG and gene expression of the adjacent gene across tissues. The Z statistics result from applying the Fisher z-transformation to the Pearson correlation between CpG and mRNA. a The x-axis reports the distance to the transcription start site. The analysis is limited to CpGs located in the promoter regions of genes. Genes are colored by chromatin states of their respective gene promoters. The chromatin states are based on the stackHMM annotations, which represent a consensus chromatin state in over 100 human tissues. A description of the chromatin states is provided in Supplementary Data 7. Red horizontal lines correspond to significance threshold (Z > 2.8 and Z < −2.8 values, two-sided p < 0.005). b Boxplot of DNAm-mRNA association by stackHMM state in CpGs with the significant cis-expression relationship. Boxes show the interquartile range of the z scores (i.e. lower and upper 25th percentile). The notches indicate the 95% confidence interval of the median. The whiskers represent 1.5*IQR length of the z scores. This analysis focuses on CpGs that are located in promoter and have a significant (Pearson correlation p < 0.05) DNAm-mRNA association with the adjacent gene. Thus, the CpGs in panel b is the subset of CpGs from panel a, namely those that have a significant mRNA-DNAm association. We found 256 CpGs with a positive association, 2223 CpGs with a negative association. To simplify the figure, we only reported the stackHMM states with a median DNAm-mRNA association of z > 2.8 or z < −2.8 (Pearson correlation p < 0.005). c Scatter plots of selected CpGs with DNAm-mRNA association in horse tissues. R: Pearson correlation coefficient. P: Two-sided Student t-test p-value. Het heterochromatin, ReprPC repressed by polycomb proteins, Acet acetylation, EnhWk weak enhancers, EnhA enhancers, TxEnh transcribed and enhancer, Tx transcription, TxEx exon, BivProm bivalent-promoter, Prom promoter, TSS transcriptional-start-site.

References

    1. Rakyan VK, et al. Human aging-associated DNA hypermethylation occurs preferentially at bivalent chromatin domains. Genome Res. 2010;20:434–439. - PMC - PubMed
    1. Teschendorff AE, et al. Age-dependent DNA methylation of genes that are suppressed in stem cells is a hallmark of cancer. Genome Res. 2010;20:440–446. - PMC - PubMed
    1. Issa J-P. Aging and epigenetic drift: a vicious cycle. J. Clin. Investig. 2014;124:24–29. - PMC - PubMed
    1. Horvath, S. & Raj, K. DNA methylation-based biomarkers and the epigenetic clock theory of ageing. Nat. Rev. Genet. 10.1038/s41576-018-0004-3 (2018). - PubMed
    1. Field AE, et al. DNA methylation clocks in aging: categories, causes, and consequences. Mol. Cell. 2018;71:882–895. - PMC - PubMed

Publication types