. 2022 Jan 10;13(1):48.
doi: 10.1038/s41467-021-27725-3.

Imagined speech can be decoded from low- and cross-frequency intracranial EEG features

Affiliations

Imagined speech can be decoded from low- and cross-frequency intracranial EEG features

Timothée Proix et al. Nat Commun. .

Abstract

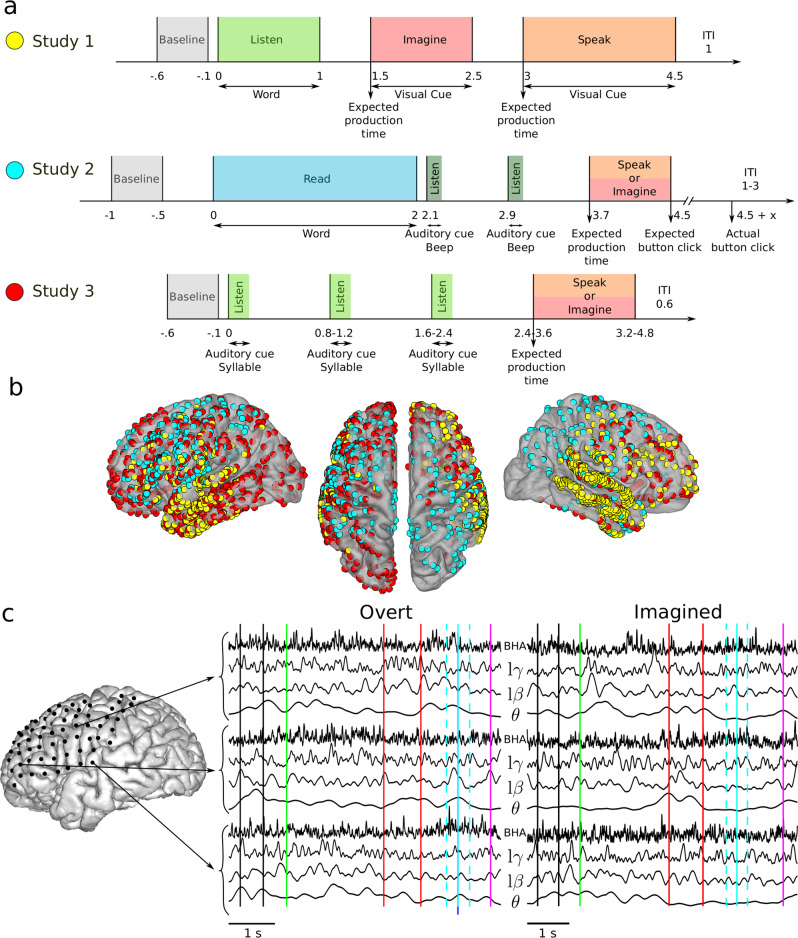
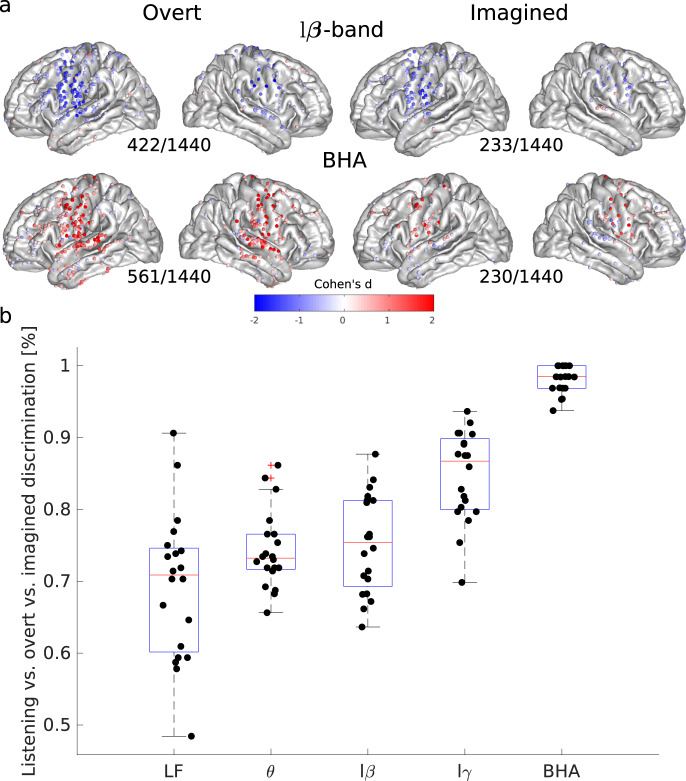
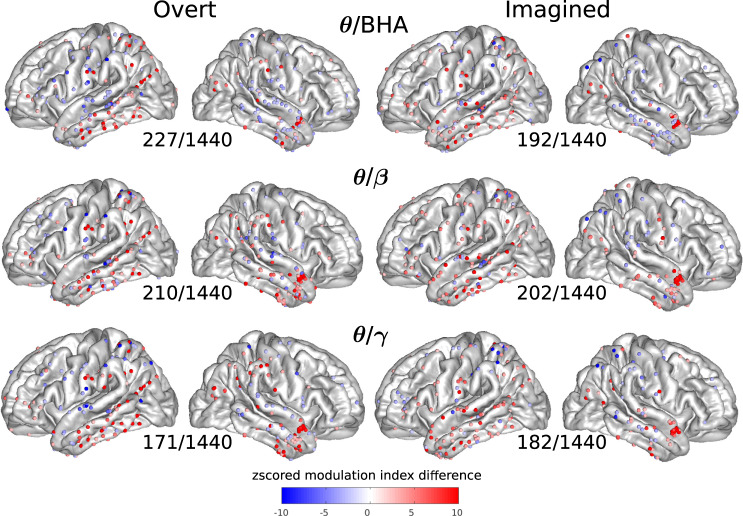
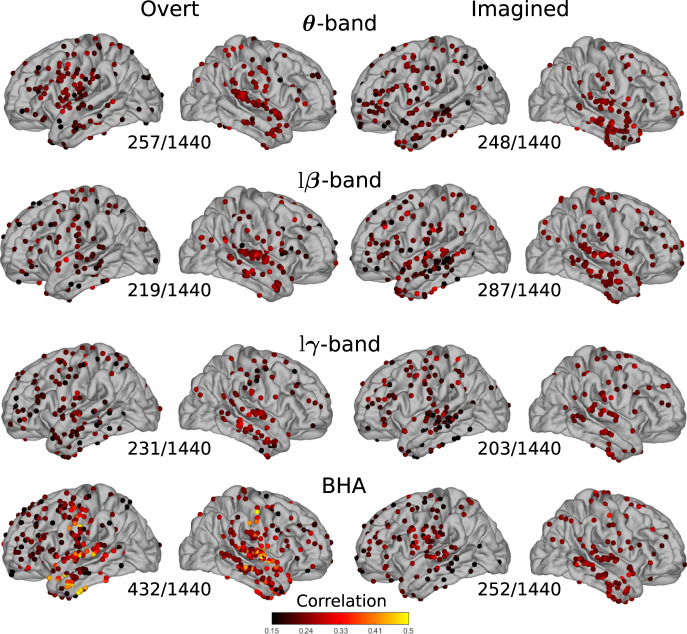
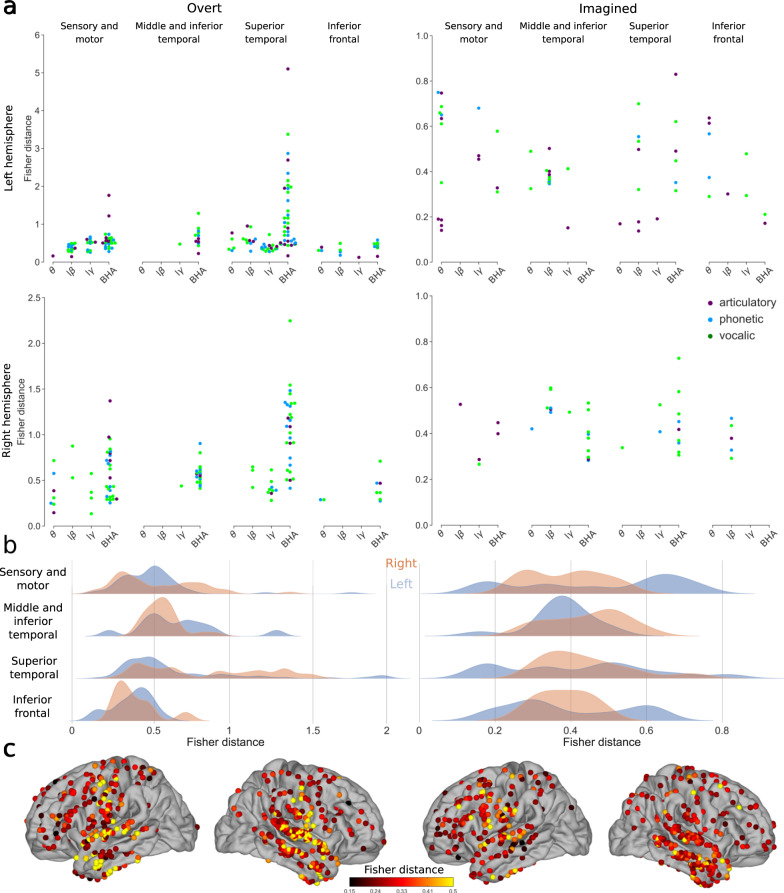
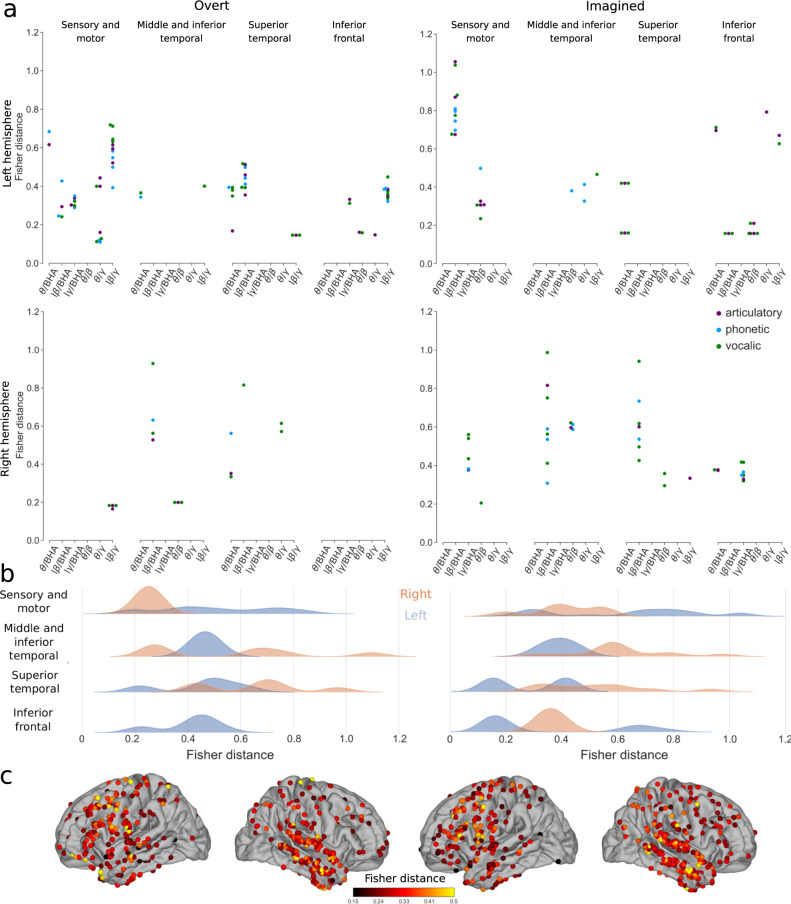
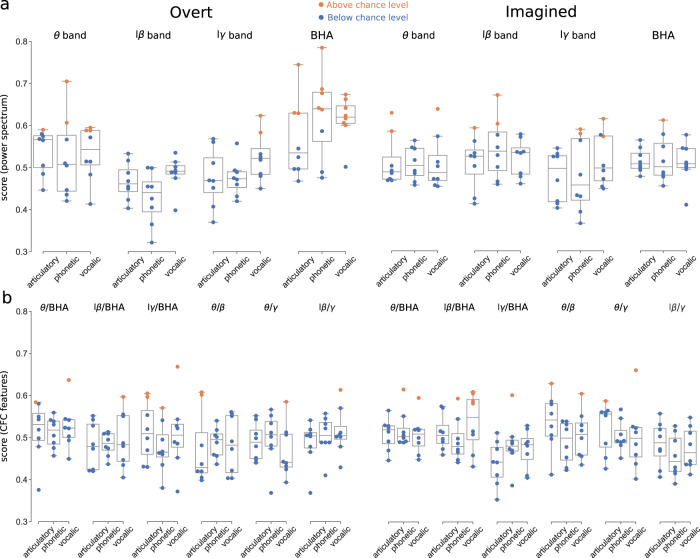
Reconstructing intended speech from neural activity using brain-computer interfaces holds great promises for people with severe speech production deficits. While decoding overt speech has progressed, decoding imagined speech has met limited success, mainly because the associated neural signals are weak and variable compared to overt speech, hence difficult to decode by learning algorithms. We obtained three electrocorticography datasets from 13 patients, with electrodes implanted for epilepsy evaluation, who performed overt and imagined speech production tasks. Based on recent theories of speech neural processing, we extracted consistent and specific neural features usable for future brain computer interfaces, and assessed their performance to discriminate speech items in articulatory, phonetic, and vocalic representation spaces. While high-frequency activity provided the best signal for overt speech, both low- and higher-frequency power and local cross-frequency contributed to imagined speech decoding, in particular in phonetic and vocalic, i.e. perceptual, spaces. These findings show that low-frequency power and cross-frequency dynamics contain key information for imagined speech decoding.


Conflict of interest statement

The authors declare no competing interests.

Figures

Fig. 1
Fig. 1. Experimental studies and electrode coverage.
a Study 1 (top row): after a baseline (0.5 s, gray), participants listened to one of six individual words (1 s, light green). A visual cue then appeared on the screen, during which participants were asked to imagine hearing again the same word (1 s, red). Then, a second visual cue appeared, during which participants were asked to repeat the same word (1.5 s, orange). Study 2 (middle row): after a baseline (0.5 s, gray), participants read one of twelve words (2 s, blue). Participants were then asked to imagine saying (red) or to say out loud (orange) this word following the rhythm triggered by two rhythmic auditory cues (dark green). Finally, they pressed a button, still following the rhythm, to conclude the trial. Study 3 (bottom row): after a baseline (0.5 s, gray), participants listened to three auditory repetitions of the same syllable (light green) at different rhythms, after which they were asked to imagine saying (red) or to say out loud the syllable (orange). b ECoG electrode coverage across all participants. Yellow, blue and red electrode colors correspond to the study 1, 2, and 3 respectively. c Example of one overt and one imagined trial for patient #8 (Geneva study). Time series extracted in the four frequency bands of interest are shown. Vertical lines indicate relevant time events in the study: baseline period (between black lines), word appear on screen (green), auditory cues (red), expected speech time (light blue), actual speech time (dark blue), analysis window (light dashed blue), and manual response (purple).
Fig. 2
Fig. 2. Spatial organization and task discriminability of power spectrum deviations from baseline elicited by overt and imagined speech.
a Effect sizes (Cohen’s d) for significant cortical sites across all participants and studies during overt and imagined speech compared to baseline (only significant electrodes are shown, t-tests, FDR-corrected, target threshold α = 0.05). The number of significant electrodes over the total number of electrodes is indicated below each plot. Left column: overt speech. Right column: imagined speech. Results are pooled across all studies, results for separated studies as shown in Supplementary Figs. 2–4. b Discrimination among tasks (listening vs overt vs imagined) using classification with power features for study 1. Features correspond to concatenated time series for power in the different frequency bands. Low-frequency features correspond to ECoG signal amplitude filtered below 20 Hz using a zero-phase Butterworth filter of order 8, rather than power. A linear discriminant analysis classifier was trained using 5-fold cross-validation (N = 20). Boxplots’ center, bound of box, and whiskers show respectively the median, interquartile range, and the extent of the distribution. Source data are provided as a Source Data file. LF low frequency, lβ low beta, lγ low gamma, BHA broadband high-frequency activity.
Fig. 3
Fig. 3. Cross-frequency coupling (CFC) between the phase of one frequency band and the amplitude of another (higher) frequency band for each electrode.
Z-scored modulation index difference for significant electrodes across all participants and studies during overt and imagined speech with respect to baseline (only significant electrodes are shown, permutation tests, FDR-corrected, target threshold α = 0.05). The number of significant electrodes over the total number of electrodes is indicated below each plot. Left column: overt speech. Right column: imagined speech. Results are pooled across all studies, results for separated studies as shown in Supplementary Figs. 6–8. Source data are provided as a Source Data file. BHA broadband high-frequency activity.
Fig. 4
Fig. 4. Average correlations between individual speech words and their neural representations.
Pairwise correlations between words and power spectrum features averaged across all word pairs for overt and imagined speech on significant electrodes (only significant electrodes are shown, permutation tests, p < 0.05, not corrected for multiple comparisons). The number of significant electrodes over the total number of electrodes is indicated below each plot. Left column: overt speech. Right column: imagined speech. Results are pooled across all studies, results for separated studies as shown in Supplementary Figs. 9–11 and 13–15. Source data are provided as a Source Data file. lβ low beta, lγ low gamma, BHA broadband high-frequency activity.
Fig. 5
Fig. 5. Discriminability between different representations using power spectrum for overt and imagined speech.
a Significant Fisher distances between articulatory (purple), phonetic (blue) and vocalic (green) representations in different brain regions and frequency bands (only significant Fisher distances are shown, permutation tests, FDR-corrected, target threshold α = 0.05). Note the different scales between overt and imagined speech. b Distributions of significant Fisher distances for each brain region and left (blue) and right (orange) hemispheres across all representations and frequency bands (only significant Fisher distances are used, permutation tests, FDR-corrected, target threshold α = 0.05). c Maximum significant Fisher distance for each electrode across all representations and frequency bands. When several significant Fisher distances were found for the same electrode, only the maximum value is shown and only significant electrodes are shown (permutation test, p < 0.05, no FDR correction). Left column: overt speech. Right column: imagined speech. Results are pooled across all studies, results for separated studies as shown in Supplementary Fig. 17. Source data are provided as a Source Data file. lβ low beta, lγ low gamma, BHA broadband high-frequency activity.
Fig. 6
Fig. 6. Discriminability between different representations using phase-amplitude CFC changes for overt and imagined speech.
a Significant Fisher distances between articulatory (purple), phonetic (blue), and vocalic (green) representations in different brain regions and frequency bands (permutation tests, FDR-corrected, target threshold α = 0.05). b Distributions of significant Fisher distance for each brain region and left (blue) and right (orange) hemispheres across all representations and frequency bands (permutation tests, FDR-corrected, target threshold α = 0.05). c Maximum significant Fisher distance for each electrode across all representations and frequency bands. When several significant Fisher distances exist for the same electrode, the maximum value is shown. Only significant electrodes are shown (permutation test, p < 0.05, no FDR correction). Left column: overt speech. Right column: imagined speech. Results are pooled across all studies, results for separated studies as shown in Supplementary Fig. 19. Source data are provided as a Source Data file. lβ low beta, lγ low gamma, BHA broadband high-frequency activity.
Fig. 7
Fig. 7. Decoding overt (left) and imagined (right) speech.
Orange circles indicate above, significant (vs. blue circles below) chance level performance for each participant respectively (N = 8, studies 1 and 2). Boxplots’ center, bound of box, and whiskers show respectively the median, interquartile range, and the extent of the distribution (outliers excepted). Significant levels were obtained for each subject based on the number of trials performed (see Methods section). a Decoding performance using power spectrum features. b Decoding performance using phase-amplitude CFC features. Left column: overt speech. Right column: imagined speech. Source data are provided as a Source Data file. lβ low beta, lγ low gamma, BHA broadband high-frequency activity.

Similar articles

Cited by

References

    1. Hochberg LR, et al. Reach and grasp by people with tetraplegia using a neurally controlled robotic arm. Nature. 2012;485:372–375. - PMC - PubMed
    1. Anumanchipalli GK, Chartier J, Chang EF. Speech synthesis from neural decoding of spoken sentences. Nature. 2019;568:493–498. - PMC - PubMed
    1. Livezey JA, Bouchard KE, Chang EF. Deep learning as a tool for neural data analysis: speech classification and cross-frequency coupling in human sensorimotor cortex. PLOS Comput. Biol. 2019;15:e1007091. - PMC - PubMed
    1. Makin JG, Moses DA, Chang EF. Machine translation of cortical activity to text with an encoder–decoder framework. Nat. Neurosci. 2020;23:575–582. - PMC - PubMed
    1. Moses DA, et al. Neuroprosthesis for decoding speech in a paralyzed person with anarthria. New Engl. J. Med. 2021;385:217–227. - PMC - PubMed

Publication types