. 2022 Jan 10;13(1):139.
doi: 10.1038/s41467-021-27766-8.

Oxylipin metabolism is controlled by mitochondrial β-oxidation during bacterial inflammation

Affiliations

Oxylipin metabolism is controlled by mitochondrial β-oxidation during bacterial inflammation

Mariya Misheva et al. Nat Commun. .

Abstract

Oxylipins are potent biological mediators requiring strict control, but how they are removed en masse during infection and inflammation is unknown. Here we show that lipopolysaccharide (LPS) dynamically enhances oxylipin removal via mitochondrial β-oxidation. Specifically, genetic or pharmacological targeting of carnitine palmitoyl transferase 1 (CPT1), a mitochondrial importer of fatty acids, reveal that many oxylipins are removed by this protein during inflammation in vitro and in vivo. Using stable isotope-tracing lipidomics, we find secretion-reuptake recycling for 12-HETE and its intermediate metabolites. Meanwhile, oxylipin β-oxidation is uncoupled from oxidative phosphorylation, thus not contributing to energy generation. Testing for genetic control checkpoints, transcriptional interrogation of human neonatal sepsis finds upregulation of many genes involved in mitochondrial removal of long-chain fatty acyls, such as ACSL1,3,4, ACADVL, CPT1B, CPT2 and HADHB. Also, ACSL1/Acsl1 upregulation is consistently observed following the treatment of human/murine macrophages with LPS and IFN-γ. Last, dampening oxylipin levels by β-oxidation is suggested to impact on their regulation of leukocyte functions. In summary, we propose mitochondrial β-oxidation as a regulatory metabolic checkpoint for oxylipins during inflammation.


Conflict of interest statement

P.K. is an employee of Cayman Chemical. All other authors declare no competing interests.

Figures
Fig. 1
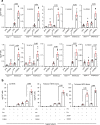
Fig. 1. Inhibition of CPT1 increases oxylipin levels significantly during inflammation in vivo and in peritoneal macrophages.
a, b Plots for individual lipids showing that inhibition of CPT1 enhances oxylipin levels, with a bigger impact during inflammatory challenge with LPS. Wild-type mice (female, 7–9 weeks) were injected i.p. with vehicle (PBS), etomoxir (100 μg), or LPS (1 μg). After 6 h, lavage was harvested and lipids extracted using SPE then analyzed using LC/MS/MS as outlined in Methods. A series of example lipids from 12/15-LOX, COX, and CYP450 are shown (n = 10). c, d Plots for individual lipids showing the impact of etomoxir ± LPS on oxylipin release by peritoneal macrophages in vitro. Peritoneal macrophages were isolated as described in Methods, then cultured in serum-free medium in the presence of etomoxir (25 μM) with/without LPS (100 ng/ml). After 24 h, the supernatant was harvested and lipids extracted using SPE, then analyzed using LC/MS/MS. A series of lipids based on enzymatic origin are shown, n = 3 per sample. For all panels, data are mean ± SEM, one-way ANOVA with Tukey post hoc test, stats are shown for the effect of etomoxir only, where significant. Where no bar is shown no significant difference was seen.
Fig. 2
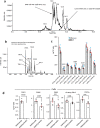
Fig. 2. Inhibition of CPT1 increases secretion of 12/15-LOX-derived eicosanoids from RAW cells overexpressing Alox15, while RAW cells rapidly consume exogenous 12-HETE, secreting two tetranor metabolites that are themselves metabolized by mitochondrial β-oxidation.
a Blockade of CPT1 leads to a significant elevation of 12/15-LOX-derived oxylipins in RAW cells. RAWmock and RAWAlox15 cells were cultured with etomoxir (25 μM) and/or LPS (100 ng/ml) for 24 h before harvest and SPE extraction of supernatant for oxylipin analysis using LC/MS/MS. Bar charts showing how oxylipins from 12/15-LOX are impacted by etomoxir (n = 6, separate wells of cells, mean ± SEM). b CPT1 inhibition prevents the metabolism of 12(S) or 12(R)HETE and their tetranor triene and diene metabolites. RAW cells were supplemented with 1.5 μg 12(S) or 12(R)-HETE/106 cells for 3 h with/without etomoxir (25 μM), then supernatants were analyzed for levels of 12-HETE and its triene and diene tetranor products using LC/MS/MS (n = 3 (LPS alone) or 4 (all other samples), mean ± SEM, separate wells of cells). For all panels, comparisons are with/without etomoxir, one-way ANOVA with Tukey post hoc test, stats are shown for the effect of etomoxir only, where significant.
Fig. 3
Fig. 3. Identification of phospholipid-esterified 12-HETE in RAW cells, and CPT1 knockdown reduces PG levels in RAW cells.
ac Cells (106) were incubated for 3 h with 12(S)-HETE ± LPS before lipids were extracted and analyzed as in Methods. Precursor LC/MS/MS was undertaken as described in Methods, scanning for ions that fragment to generate HETE. a Chromatogram showing elution of precursors that generate product ions with m/z 319.2. b MS spectrum from 10–15 min showing PE and PC species that contain 12-HETE. c Quantification of 12-HETE PE and PC species that are formed following incubation of RAW cells with 12(S)-HETE (n = 3, mean ± SEM, separate wells of cells) compared with/without LPS, Student’s t-test, two-tailed. Where no bar is shown no significant difference was seen. d Cpt1a knockdown dampens cellular levels of PGs in RAW cells. RAW cells expressing either the non-silencing (RAWnonsil) or Cpt1a knockdown siRNA (RAWCpt1aKD) were treated with LPS (100 ng/ml) for 24 h and cell levels of PGs measured using LC/MS/MS as in Methods (n = 6, mean ± SEM, separate wells of cells). Student’s t-test, two-tailed. Where no bar is shown no significant difference was seen.
Fig. 4
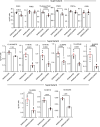
Fig. 4. CPT1 genetic knockdown reduces the secretion of oxylipins.
RAW cells expressing either the non-silencing (RAWnonsil) or Cpt1a knockdown siRNA (RAWCpt1aKD) were treated with LPS (100 ng/ml) for 24 h and secretion of PGs, 17,18-diHETE, or monohydroxy oxylipins were measured using LC/MS/MS as in Methods (n = 6, mean ± SEM, separate wells of cells). Student’s t-test, two-tailed. Where no bar is shown no significant difference was seen.
Fig. 5
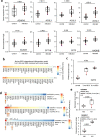
Fig. 5. Cpt1a genetic knockdown modulates the metabolism of 12-HETE and its metabolites by RAW cells, etomoxir reduces the metabolism of tetranor triene in vivo, and prevents LPS stimulation of RANTES/TNFα generation, oxylipins regulate leukocyte responses, and transcriptomics of human neonatal sepsis proposes multiple genes that support a mitochondrial oxylipin β-oxidation pathway.
ac Knockdown of Cpt1a alters 12-HETE metabolism. RAW cells were incubated ± LPS (100 ng/ml, for 4 h) with 12-HETE (2.34 µg/ml) added after the first hour (thus added for 3 h). Supernatants were harvested, then lipids were extracted and analyzed for 12-HETE and metabolites using LC/MS/MS as described in Methods (n = 4 (basal nonsil), 5 (basal Cpt1aKD), or 6 (other groups), separate wells of cells, mean ± SEM). d Tetranor triene 12-HETE is increased in vivo during inflammation with CPT1 inhibition. Wild-type mice (female, 7–9 weeks) were injected i.p. with vehicle (PBS), etomoxir (100 μg), and/or LPS (1 μg). After 6 h, lavage was harvested and lipids extracted and analyzed using LC/MS/MS as outlined in Methods (n = 10, individual mice). Outliers are shown as red, or with values. e, f Etomoxir dampens the generation of RANTES and TNF by peritoneal macrophages. Supernatants from macrophages cultured in vitro for 24 h with LPS (100 ng/ml)/etomoxir (25 μM) were tested for RANTES/CCL5 or TNF using ELISAs as described in Methods (n = 3 per group, separate wells of cells, mean ± SEM). af *p < 0.05, **p < 0.01, ***p < 0.005 with/without etomoxir, one-way ANOVA with Tukey post hoc test was used. g, h Oxylipin levels detected in vivo promote neutrophil ROS generation. Whole blood was incubated with oxylipin mixtures (Supplementary Table 1) , and then ROS generation in response to stimulation using opsonized S. epidermidis was determined by APF fluorescence as indicated in Methods. Three individual donor samples were separately tested. Monocytes and neutrophils were analyzed using the gating strategy as outlined in Methods. Response to high or low oxylipin doses was expressed either as %APF + cells or % of the vehicle (ethanol) response. Each donor is shown separately. Data were analyzed by repeated-measures two-way ANOVA (g—pairing p < 0.0001, cell type p = 0.018, lipid p = 0.0002, and interaction p = 0.0005; h—pairing p = 0.0008, cell type p = 0.0094, lipid p = 0.0082, and interaction p = 0.0024), Sidak’s post hoc tests are indicated—g Neutrophils ethanol vs low lipid p = 0.0001, neutrophils ethanol vs high lipid p < 0.0001, neutrophils low lipid vs high lipid p = 0.0350, monocytes ethanol vs low lipid p = 0.7020, monocytes ethanol vs high lipid p = 0.8075, monocytes low lipid vs high lipid p = 0.8075—h neutrophils low lipid vs high lipid p = 0.0023, monocytes low lipid vs high lipid p = 0.2363). i Oxylipin levels detected in vivo modulate CD4+ and CD8+ T-cell activation. Whole blood was incubated with oxylipin mixtures (Supplementary Table 1), and then generation of TNF was determined in response to activation using CD3/CD28 beads as indicated in Methods. CD8+ and CD4+ T cells were analyzed using the gating strategy outlined in Methods. Data from individual donors is shown. Two-way ANOVA (repeated measures) was used, pairing p = 0.0039, interaction p = 0.1690, cell type p = 0.0007, effect of lipid p = 0.0253, Sidak’s post hoc tests are indicated—CD4: no lipid vs low lipid p = 0.0461, CD4: no lipid vs high lipid p = 0.7115, CD4: low lipid vs high lipid p = 0.9989, CD8: no lipid vs low lipid p = 0.3742, CD8: no lipid vs high lipid p = 0.0449, CD8: low lipid vs high lipid p = 0.9952). j Human transcriptomics data show significant upregulation of several genes including ACSL and CPT isoforms. Gene expression (log2 expression data) from 35 controls and 26 bacterial confirmed sepsis cases published in were compared for expression of 32 genes putatively involved in mitochondrial import and β-oxidation of oxylipins, based on known metabolic pathways for long-chain native FA. *p < 0.05, ***p < 0.005, Student’s t-test, two-tailed, then adjusted using Benjamini–Hochberg test.
Fig. 6
Fig. 6. Transcriptomics of the mitochondrial β-oxidation pathway reveals ACSL1/Acsl1 as a key checkpoint response to LPS inflammation in human and mouse macrophages.
a Plots for the eight significantly upregulated genes in the human neonatal dataset are shown. n = 35 and 26 for infection and controls, respectively. Student’s t-test, two-tailed, then adjusted using Benjamini–Hochberg test. b, c Transcriptomics of mouse peritonitis shows significant upregulation of Cpt1a at 6 h post SES. Gene expression data from peritoneal membranes harvested post SES challenge were analyzed for expression of 32 genes (n = 3 per group) *p < 0.05, Student’s t-test, two-tailed, adjusted using Benjamini–Hochberg test. c The plot for Cpt1a expression. d, e Transcriptomics reveals Ascl1 and Eci1 to be highly upregulated in response to LPS/IFN-γ in murine BMDM. Transcriptomics data obtained from GEO database were analyzed as outlined in Methods for expression of 34 genes selected for potential or known involvement in mitochondrial β-oxidation. Samples were BMDM treated with either LPS/IFN-γ or IFNγ alone as indicated. For all genes, the log2fold change was calculated and plotted using Pheatmap in R (d). e Box and whisker plots for normalized expression (using Limma and Oligo Bioconductor packages) of Eci1 in mouse datasets with n = 3 for all groups, adjusted using Benjamini–Hochberg test (n = 3 for all groups except for GSE53053 M0 (n = 2)). Box shows median, and interquartile ranges (IQR). The ends of the whisker are at 1.5 × IQR above the third quartile (Q3) and 1.5 × IQR below the first quartile (Q1). If minimum or maximum values are outside this range, then they are shown as outliers.
Fig. 7
Fig. 7. Elevated Acsl1/ACSL1 in mouse and human GEO datasets, triascin C significantly inhibits 12-HETE removal by cells, and prevents generation of tetranor diene or triene HETE metabolites, while etomoxir alters AA levels in RAW cells.
a Plots for normalized expression (using Limma and Oligo Bioconductor packages) of Acsl1 in the mouse datasets, with n = 3 for all groups except for GSE53053 M0 (n = 2) adjusted using Benjamini–Hochberg test. b ACSL1 is strongly induced in human M1 macrophages. Human transcriptomics data for ACSL1 expression were downloaded from GEO and normalized expression level plotted. GSE46903 (n = 3, 10 for M0, M1 respectively), GSE35499 (n = 7), GSE5099 (n = 3). Data were normalized using Limma and Oligo Bioconductor packages as outlined in Methods, then adjusted using the Benjamini–Hochberg test. Box shows median, and interquartile ranges (IQR). The ends of the whisker are at 1.5 × IQR above the third quartile (Q3) and 1.5 × IQR below the first quartile (Q1). If minimum or maximum values are outside this range, then they are shown as outliers. c Triascin C alters metabolism of 12-HETE. RAW cells were cultured for 3 h in serum/phenol red-free medium with 12(S)-HETE (1.4 μg/106 cells), with/without 100 ng/ml LPS with/without 7 μM Triascin C. Cells and supernatant were harvested and 12-HETE and its tetranor metabolites measured using LC/MS/MS (n = 3, mean ± SEM, separate wells of cells). Significance was tested using ANOVA with Tukey post hoc test. The impact of LPS (either with or without Triascin C) was not significant for any conditions or lipids, except for diene. d Etomoxir modulates levels of AA in RAW cells. RAW cells were cultured for 3 h in serum/phenol red-free medium with 12(S)-HETE (1.4 μg/106 cells), with/without 100 ng/ml LPS with/without 25 μM etomoxir. Cells and supernatant were harvested and 16:0, 18:0, and 20:4 measured using LC/MS/MS (n = 3, mean ± SEM, separate wells of cells). Significance was tested using ANOVA with Tukey post hoc test. For 16:0 and 18:0, there were no significant differences found.

References

    1. Funk CD. Prostaglandins and leukotrienes: advances in eicosanoid biology. Science. 2001;294:1871–1875. - PubMed
    1. Simmons DL, Botting RM, Hla T. Cyclooxygenase isozymes: the biology of prostaglandin synthesis and inhibition. Pharm. Rev. 2004;56:387–437. - PubMed
    1. Smith WL, DeWitt DL, Garavito RM. Cyclooxygenases: structural, cellular, and molecular biology. Annu Rev. Biochem. 2000;69:145–182. - PubMed
    1. Serhan CN, Chiang N, Van Dyke TE. Resolving inflammation: dual anti-inflammatory and pro-resolution lipid mediators. Nat. Rev. Immunol. 2008;8:349–361. - PMC - PubMed
    1. Capdevila JH, Falck JR, Imig JD. Roles of the cytochrome P450 arachidonic acid monooxygenases in the control of systemic blood pressure and experimental hypertension. Kidney Int. 2007;72:683–689. - PubMed

Publication types

MeSH terms