. 2022 Jan 10;13(1):92.
doi: 10.1038/s41467-021-27760-0.

Dynamics of GLP-1R peptide agonist engagement are correlated with kinetics of G protein activation

Affiliations

Dynamics of GLP-1R peptide agonist engagement are correlated with kinetics of G protein activation

Giuseppe Deganutti et al. Nat Commun. .

Abstract

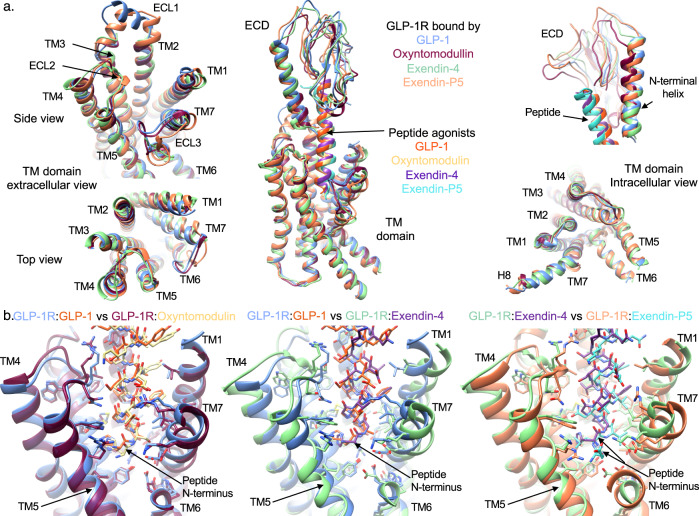
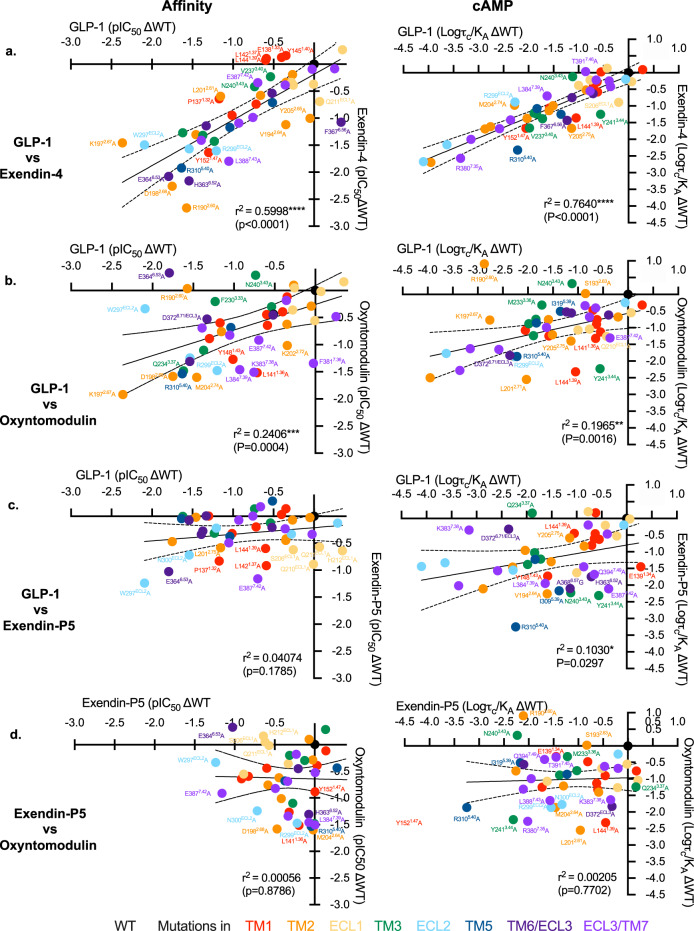
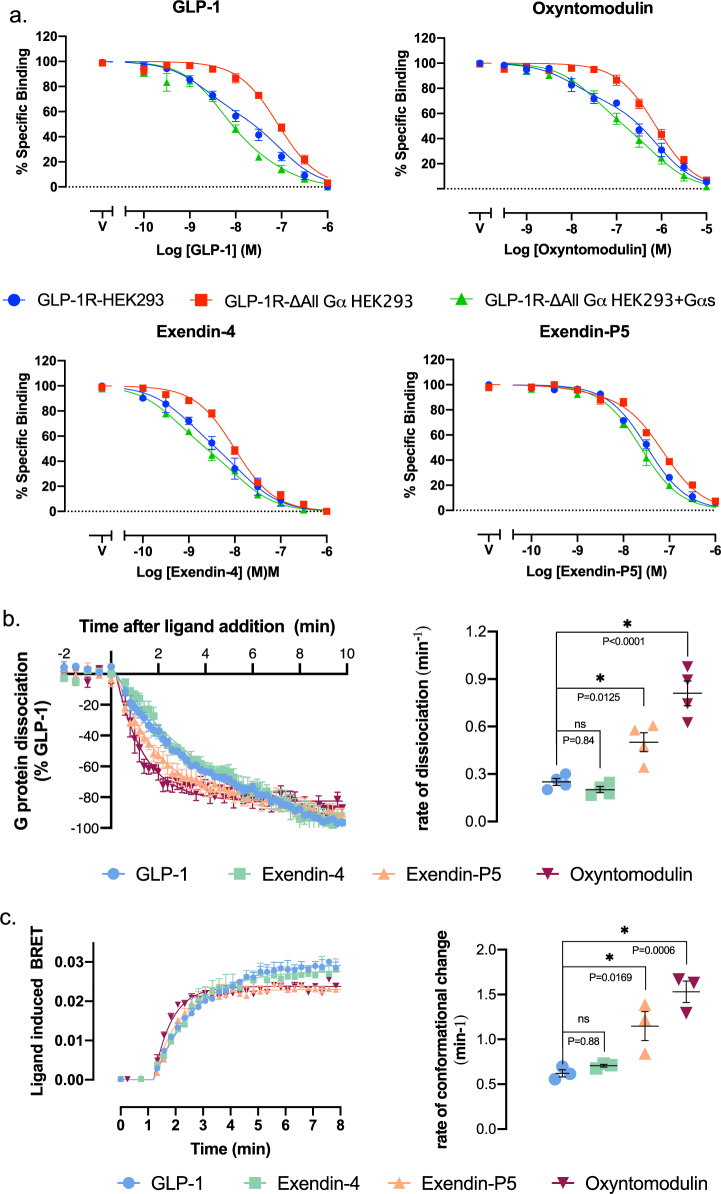
The glucagon-like peptide-1 receptor (GLP-1R) has broad physiological roles and is a validated target for treatment of metabolic disorders. Despite recent advances in GLP-1R structure elucidation, detailed mechanistic understanding of how different peptides generate profound differences in G protein-mediated signalling is still lacking. Here we combine cryo-electron microscopy, molecular dynamics simulations, receptor mutagenesis and pharmacological assays, to interrogate the mechanism and consequences of GLP-1R binding to four peptide agonists; glucagon-like peptide-1, oxyntomodulin, exendin-4 and exendin-P5. These data reveal that distinctions in peptide N-terminal interactions and dynamics with the GLP-1R transmembrane domain are reciprocally associated with differences in the allosteric coupling to G proteins. In particular, transient interactions with residues at the base of the binding cavity correlate with enhanced kinetics for G protein activation, providing a rationale for differences in G protein-mediated signalling efficacy from distinct agonists.


Conflict of interest statement

The authors declare no competing interests.

Figures

Fig. 1
Fig. 1. Cryo-EM structures of GLP-1R:Gs complexes with different agonists.
a Sequence of peptides was assessed in this study. b and c orthogonal views of the cryo-EM maps (left), and the backbone models built into the maps in ribbon format (right) for oxyntomodulin (b) and exendin-4 (c) bound GLP-1R:Gs complexes. Colouring denotes the protein segments as highlighted on the figure panels.
Fig. 2
Fig. 2. Interactions of oxyntomodulin and exendin-4 peptides within the TMD binding cavity of the GLP-1R.
a GLP-1R (dark pink) and oxyntomodulin peptide (pale yellow). b GLP-1R (pale green) and exendin-4 (purple). For each binding site two views are depicted for clarity; Left, side view of the TM bundle viewed from the upper portion of TM4/TM5 where TM4-ECL2-TM5 have been removed; Right; side view of the TM bundle viewed from the upper portion of TM6/TM7 where TM6-ECL3-TM7 has been removed. Dashed lines depict hydrogen bonds as determined using default settings in UCSF chimera. Superscript numbering for receptor residues refers to the generic Wootten et al. class B1 numbering system.
Fig. 3
Fig. 3. Comparisons of the GLP-1R conformations and binding pockets stabilised by GLP-1, exendin-4, oxyntomodulin and exendin-P5.
a Superimposition of the receptor from the GLP-1R:Gs complex structures bound with GLP-1 (6X18—receptor-blue, peptide-orange), oxyntomodulin (receptor-dark pink, peptide-pale yellow), exendin-4 (receptor-pale green, peptide-purple) and exendin-P5 (6B3J—receptor-pale orange, peptide-cyan). Middle, Overlay of full-length receptors with bound peptides; Left, close up of an extracellular portion of the receptor TMD viewed from the side (top) and looking down on the TMD-binding cavity (bottom); Right, close up of the ECD showing the distinct location of the ECD N-terminal α-helix and the location of the peptide C-terminus in the different structures (top) and the receptor TM domain viewed from the intracellular G protein binding site. b Superimposition of the peptide binding sites within the GLP-1R TMD comparing GLP-1 with oxyntomodulin (left), GLP-1 with exendin-4 (middle) and exendin-4 with exendin-P5 (right). Colouring denotes the different peptide bound receptors as highlighted on the figure panels.
Fig. 4
Fig. 4. Heat maps depicting the 3D representation of the effect of alanine mutation of residues within the TMD peptide-binding cavity on affinity and signalling.
Models of the peptide bound GLP-1Rs showing residues (in space fill) that altered affinity (top) or signalling (bottom) of GLP-1, exendin-4, oxyntomodulin and exendin-P5 relative to the wild type receptor when mutated. These are coloured depending on their level of effect highlighted in the colour key. TM domains are labelled on the GLP-1-bound model depicting affinity changes, with the same receptor views used for the remaining models.
Fig. 5
Fig. 5. Correlation plots of the changes in peptide affinity and efficacy for TMD mutations relative to the wildtype receptor.
a GLP-1 vs. exendin-4; b GLP-1 vs. oxyntomodulin; c GLP-1 vs. Exendin-P5; d Exendin-P5 vs. Oxyntomodulin. Data were fit by linear regression and Pearson correlations (r) were determined and squared (r2), and the P value was calculated using a two-tailed critical t value analysis in Prism 9. The line of regression and 99% confidence intervals are displayed. Mutations are coloured relative to the receptor TM or ECL that they are located as indicated in the legend. Mutant receptors that fall outside of the 99% confidence intervals are labelled. Source data are provided in the Source Data file.
Fig. 6
Fig. 6. Contact differences in GLP-1R interactions of GLP-1, exendin-4, oxyntomodulin and exendin-P5 from MD simulations.
a Top; contact differences of each peptide with the GLP-1R TMD and ECD plotted on the receptor ribbon viewed from the side, Bottom; contact differences of each peptide with the TMD plotted on the GLP-1R surface viewed from the extracellular side (ECD not shown for clarity). The first column shows the GLP-1R contacts formed by GLP-1 during the simulations with no/min contacts in cyan and contacts heat-mapped from white to dark pink with increasing number/occupancy of interactions. The other three columns report the contacts differences for each residue of the GLP-1R during the MD simulation performed in the presence of other agonists with white indicating similar interactions to GLP-1, blue decreased contacts and red increased contacts. b Hydrogen bond differences between the four peptides plotted on the surface of the TMD viewed from the extracellular side with the ECD removed for clarity. The first column shows the GLP-1R residues involved in hydrogen bonds with GLP-1 during the MD simulations with a blue to red heatmap indicating the relative extent of interaction for each residue. The other three columns report the hydrogen bond differences for each GLP-1R residue during the MD performed in the presence of the other agonists with blue indicating fewer interactions, white similar and red more interactions, compared to GLP-1.
Fig. 7
Fig. 7. Allosteric effect of the G protein on peptide affinity and the peptide on Gs activation.
a Equilibrium competition binding assays assessing the ability of GLP-1, oxyntomodulin, exendin-4 and exendin-P5 to compete for the probe Rox-Ex4, in HEK293 cells overexpressing the GLP-1R in the presence of endogenous Gα proteins (blue), the absence of Gα proteins (red) and when Gαs is overexpressed (no endogenous Gα proteins) (green). Data are presented as % specific binding with 100% binding defined as total probe binding in the absence of competing ligand and non-specific (0%) binding determined as probe binding in the presence of 1 μM exendin-4. Data are means ± s.e.m. of 7 independent experiments performed in duplicate. b HEK293A cells are transiently transfected with the GLP-1R and the NanoBit constructs for Gαs (Gα-Lgbit, Gγ2-Smbit). Left; Luminescence signal was assessed over time (0–20 min) in the presence of saturating concentrations of GLP-1 (1 μM), exendin-4 (1 μM), oxyntomodulin (10 μM) and exendin-P5 (10 μM) and responses were normalised to the max loss of luminescence observed with GLP-1. Data shown are mean ± s.e.m. of four independent experiments performed in triplicate. Right; Quantification of the rate of G protein dissociation (luminescence change) for each agonist was calculated by applying a one-phase decay curve to the kinetic data with values from each individual experiment shown in circles with the mean ± s.e.m. of the four individual experiments. c Agonist-induced changes in trimeric Gs protein conformation. Left; Ligand-induced changes in BRET were measured in plasma membrane preparations performed in a kinetic mode in the presence of saturating concentrations of GLP-1 (1 μM), exendin-4 (1 μM), oxyntomodulin (10 μM) and exendin-P5 (10 μM). Data shown are mean ± s.e.m. of three independent experiments performed in triplicate. Right; Quantification of the rate of ligand-induced conformational change for each agonist was calculated by applying a one-phase association curve to the kinetic data with values from each individual experiment shown in circles with the mean ± s.e.m. of the four individual experiments. * Represents statistically different to GLP-1 (P < 0.05) when assessed using a one-way ANOVA of variance with a Dunnett’s post hoc test. Exact P values are shown on the relevant figures. Source data are provided in the Source Data file.
Fig. 8
Fig. 8. Interaction of Gs with the GLP-1R in the presence of different peptide agonists.
a Superimposition of GLP-1R:Gs structures bound with GLP-1 (PDB – 6X18, blue), exendin-4 (pale green), oxyntomodulin (dark pink) and exendin-P5 (pale orange) (PDB - 6B3J), viewing the GLP-1R interface. b Contact differences between the four complexes plotted on the receptor (top) and Gs (bottom) surface determined from MD simulations. The first column shows the contacts between GLP-1R (top) and Gs (bottom) during the MD simulations in the presence of GLP-1, with no contacts in cyan and increasing contacts heat mapped from white to dark pink. The other three columns report the contact differences (relative to GLP-1) for each residue of the GLP-1R and Gs during the MD performed in the presence of the other agonists with blue indicating fewer contacts, white similar contacts, and red enhanced contacts.
Fig. 9
Fig. 9. Position of critical nodes within GLP-1R, in complex with GLP-1, exendin-4, oxyntomodulin, or exendin-P5.
GLP-1R is in white ribbon, Gα in tan ribbon, Gβ in orange ribbon, and Gγ in yellow ribbon. Nodes and edges are in red. Peptides are not displayed as these were not considered during network analysis.

References

    1. Graaf C, et al. Glucagon-like peptide-1 and its Class B G protein-coupled receptors: a long march to therapeutic successes. Pharm. Rev. 2016;68:954–1013. - PMC - PubMed
    1. Nauck MA, Meier JJ. MANAGEMENT OF ENDOCRINE DISEASE: are all GLP-1 agonists equal in the treatment of type 2 diabetes? Eur. J. Endocrinol. 2019;181:R211–R234. - PubMed
    1. Wootten D, et al. The extracellular surface of the GLP-1 receptor is a molecular trigger for biased agonism. Cell. 2016;165:1632–1643. - PMC - PubMed
    1. Koole C, et al. Allosteric ligands of the glucagon-like peptide 1 receptor (GLP-1R) differentially modulate endogenous and exogenous peptide responses in a pathway-selective manner: implications for drug screening. Mol. Pharm. 2010;78:456–465. - PMC - PubMed
    1. Wootten D, et al. Differential activation and modulation of the glucagon-like peptide-1 receptor by small molecule ligands. Mol. Pharm. 2013;83:822–834. - PubMed

Publication types

MeSH terms