. 2022 Jan 10;13(1):169.
doi: 10.1038/s41467-021-27798-0.

Spatial transcriptomics using combinatorial fluorescence spectral and lifetime encoding, imaging and analysis

Affiliations

Spatial transcriptomics using combinatorial fluorescence spectral and lifetime encoding, imaging and analysis

Tam Vu et al. Nat Commun. .

Abstract

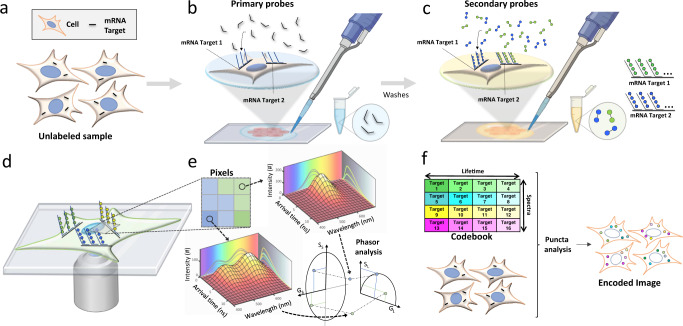
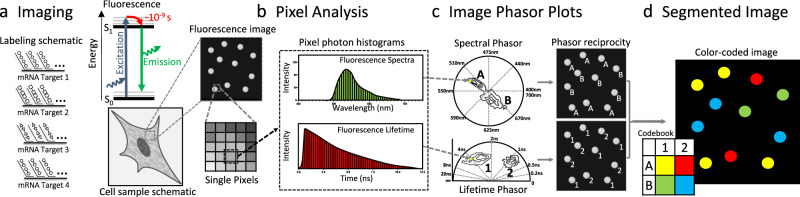
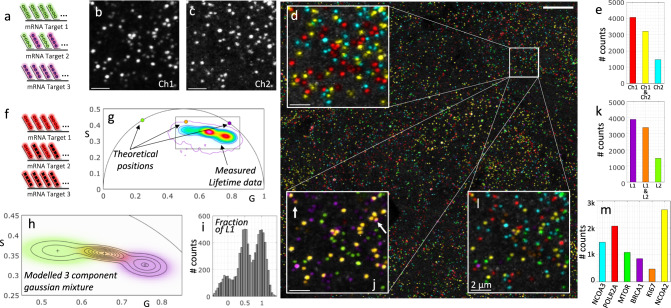
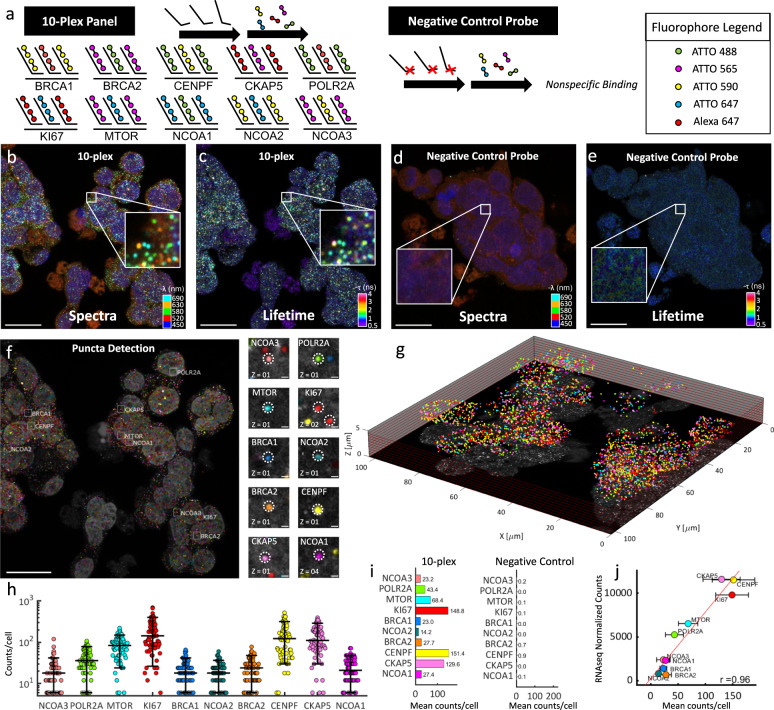
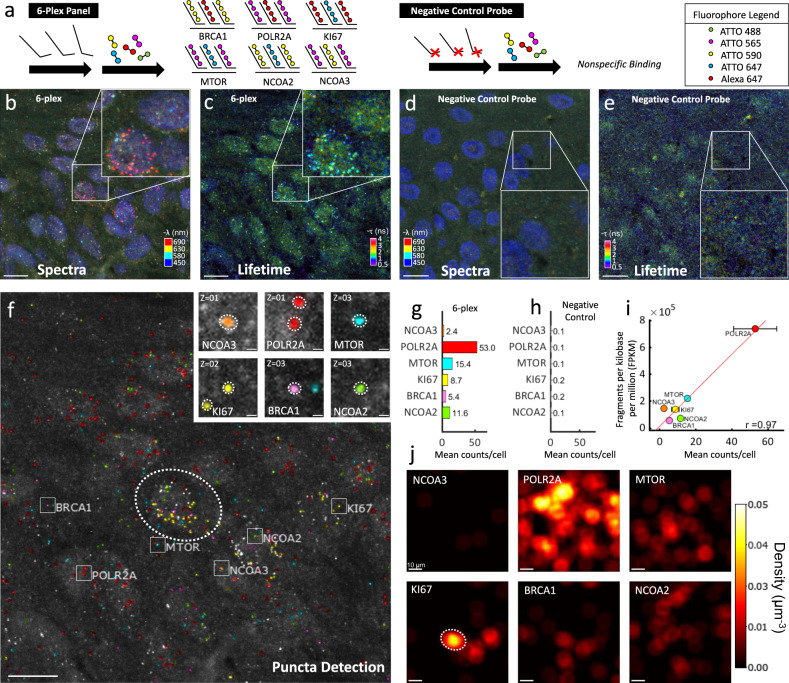
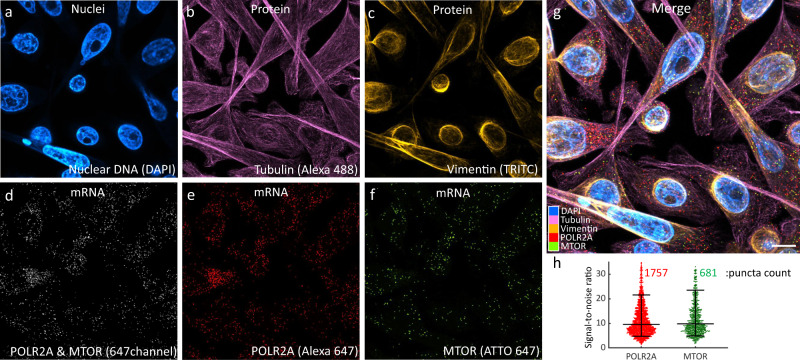
Multiplexed mRNA profiling in the spatial context provides new information enabling basic research and clinical applications. Unfortunately, existing spatial transcriptomics methods are limited due to either low multiplexing or complexity. Here, we introduce a spatialomics technology, termed Multi Omic Single-scan Assay with Integrated Combinatorial Analysis (MOSAICA), that integrates in situ labeling of mRNA and protein markers in cells or tissues with combinatorial fluorescence spectral and lifetime encoded probes, spectral and time-resolved fluorescence imaging, and machine learning-based decoding. We demonstrate MOSAICA's multiplexing scalability in detecting 10-plex targets in fixed colorectal cancer cells using combinatorial labeling of five fluorophores with facile error-detection and removal of autofluorescence. MOSAICA's analysis is strongly correlated with sequencing data (Pearson's r = 0.96) and was further benchmarked using RNAscopeTM and LGC StellarisTM. We further apply MOSAICA for multiplexed analysis of clinical melanoma Formalin-Fixed Paraffin-Embedded (FFPE) tissues. We finally demonstrate simultaneous co-detection of protein and mRNA in cancer cells.


Conflict of interest statement

T.V. and A.V. are now Arvetas Biosciences Inc employees. W.Z. is a cofounder of Velox Biosystems Inc., Amberstone Biosciences Inc., and Arvetas Biosciences Inc. P.N.H. holds a part-time position at Amberstone Biosciences Inc. A.G. is a founder of Alyra therapeutics. The remaining authors declare no competing interests.

Figures

Fig. 1
Fig. 1. Schematic of the MOSAICA approach for labeling and analysis of spectral and time-resolved components.
a Sample(s) can be fixed cells or tissues. RNA transcripts from genes of interest are targeted for detection. Protein targets can be stained too in mRNA and protein codetection. b Primary labeling probes are designed to include two functional regions: a target region which is complementary and can bind to the mRNA target and an adjacent readout region which can subsequently bind to fluorescently labeled oligonucleotides. c Secondary fluorescent probes are added to bind to the primary probes to form different combinations (combinatorial labeling) through a “readout” domain. d Labeled targets are measured under a fluorescent microscope to interrogate the spectral and lifetime characteristics of the labeled moieties. e Phasor analysis is used to identify which fluorophore labels are present in each pixel and puncta. f Labeled targets eliciting the encoded intensity-based and time-based signature are decoded to reveal the locations, identities, counts, and distributions of the present mRNA targets in a multiplexed fashion.
Fig. 2
Fig. 2. Image and phasor analysis with spectrum and lifetime analysis in MOSAICA.
a As an example, four different probes are used to target the transcripts of four different genes. The fluorescence is collected using the spectral and Fluorescence Lifetime Imaging and Microscopy (FLIM) instrument to form images where each pixel carries information of the spectra and lifetime. b At each pixel we compute the photon distribution in the spectral and temporal dimension. The phasor transform maps these distributions in each pixel to a position on the phasor space. c The phasor plots reveal the presence of different populations. These populations are identified and then mapped back to the original image. d We color code the pixels based on the combination of the two properties. This allows us to separate by lifetime probes that were emitting with similar spectra and vice-versa, separate by spectra probes that fluoresce with similar lifetimes.
Fig. 3
Fig. 3. Working example of combinatorial labelling of three mRNA targets with two probes.
a Transcripts of three different target genes are tagged using two probes with different spectra. Targets 1 and 3 are tagged each with one probe, Target 2 is tagged with both simultaneously. b, c The fluorescence is collected in the two expected spectral channels for the known emission of the two probes (representative small regions of a whole 3D field of view). d The maximum projection of the two channels is shown and pseudo-colored depending on the presence in the respective channels (as an inset within the whole field of view. e The actual counts of each target within the whole field of view. f As a parallel example, transcripts of three different target genes are tagged using two probes with different lifetime. Targets 1 and 3 are tagged each with one probe, Target 2 is tagged with both simultaneously. g The phasor plot presents three populations, corresponding to the pixels with the three combinations; the two components by themselves plus the linear combination falling in the middle. h) Machine learning clustering technique is used to identify the groups (Gaussian mixture model). i) The multicomponent method is used to extract the fraction of one of the components in each detected puncta. j The same inset is shown with the pseudocoloring now depending on the lifetime clustering. k The counts for each lifetime cluster in the whole field of view. l The combination of the information in both the spectral and the lifetime dimension yields a final 6-plex. m The overall counts for the 6-plex detection of transcripts including POLR2A (Alexa647 & ATTO565), MTOR (ATTO647 & ATTO565), KI67 (Alexa647 & ATTO647), BRCA1 (Alexa647), NCOA2 (ATTO647), NCOA3 (ATTO565) with the appropriate expressed genes that correspond to each combination. Experiments were conducted with cultures of mNeon green cells. Scale bar 10 µm in large image and 2 µm in insets. Source data are provided as a Source Data file.
Fig. 4
Fig. 4. Simultaneous 10-plex detection of transcripts for genes in colorectal cancer SW480 cells in a single round of labeling and imaging.
a 10 different gene transcripts are labeled with primary probes followed by respective and complementary fluorescent secondary probes. Each transcript is labeled with a combination of 2 out of 5 fluorophores for 10 combinations. Negative control probes (mNeonGreen, DCT, TYRP1, and PAX3) targeting transcripts not present in the sample were used with their respective secondary fluorophore probes. b Spectral image (max-projection in z) of a field of view of the labeled 10-plex sample (5-channel pseudo coloring). c Lifetime image (max-projection in z) of a field of view of the labeled 10-plex sample (phasor projection on universal circle pseudo coloring). d Spectral image of the labeled negative control probe sample. e Lifetime image of the labeled negative control probe sample. f Final puncta detection after being processed in our analysis software showing highlighted example puncta of each target (insets, right). g 3D representation of the field of view for the 10-plex sample. h Number of puncta detected for each gene target expression in each cell for the labeled 10-plex samples (overlaid lines correspond to quantiles [10,50,90]%, n=364 cells). i) Mean puncta counts per cell of transcripts for each gene in the 10-plex samples (left, n=3 experimental replicates, 364 total cells profiled) and negative control probe samples (right, n=3 experimental replicates, 189 total cells profiled). j Correlation of detected puncta (mRNA puncta count) vs. RNA-bulk sequencing (normalized counts) is shown for each target (mean + /− standard deviation, n=3 experimental replicates), yielding a correlation (Pearson r) of 0.96. Scale bar 20 µm in large images and 1 µm in insets. Source data are provided as a Source Data file.
Fig. 5
Fig. 5. Multiplexed mRNA detection in epidermis region of human skin melanoma FFPE tissue.
a 6 different types of gene transcripts were labeled with primary probes followed by respective and complementary fluorescent secondary probes. Each transcript was labeled with a combination of two different fluorophores for six combinations. Negative control probes targeting transcripts not present in the sample were used with their respective secondary fluorophore probes. b Spectral image (max-projection in z) of a field of view of the labeled 6-plex sample (three channel pseudo coloring). c Lifetime image (max-projection in z) of a field of view of the labeled 6-plex sample (phasor projection on universal circle pseudo coloring). d Spectral image of the labeled negative control probe sample is depicted. e Lifetime image of the labeled negative control probe sample. f Final puncta detection of the 6-plex field of view after being processed in our analysis software showing highlighted example puncta of each target (insets, right). g Mean puncta counts per cell of transcripts for each gene in the 6-plex sample (n=2 experimental replicates, 174 cells). h Puncta count for the negative control probe sample (n=2 experimental replicates, 375 cells). i Correlation of detected puncta (mRNA puncta count) vs. bulk sequencing (fragments per kilobase per million) is shown for each target. j Transcript density in the field of view for each of the expressed genes reveals clustering of specific genes, as an example KI67 appears highly expressed in three cells, one of them marked with a dotted ellipse that corresponds to location in f). Scale bars 10 µm in large images and 1 µm in insets. Source data are provided as a Source Data file.
Fig. 6
Fig. 6. Simultaneous 4-plex co-detection of protein and mRNA in colorectal cancer SW480 cells.
a Intensity imaging showing nuclei labeled with DAPI. b Intensity image showing Tubulin protein labeled with Alexa488. c Intensity image showing Vimentin protein labeled with TRITC. d Intensity image at 647 nm showing mRNA targets, POLR2A and MTOR, which were further resolved by lifetime. e Unmixed lifetime image showing POLR2A puncta labeled with Alexa647. f Unmixed lifetime image showing mTOR puncta labeled with ATTO647. g Merged image of all channels. Scale bar is 10 µm. h Signal-to noise and puncta count analysis for the mRNA targets. Overlaid lines correspond to quantiles [10,50,90]%, n=1757 and n=681 transcripts respectively. Source data are provided as a Source Data file.

References

    1. Pichon X, Lagha M, Mueller F, Bertrand E. A Growing Toolbox to Image Gene Expression in Single Cells: Sensitive Approaches for Demanding Challenges. Mol. Cell. 2018;71:468–480. - PubMed
    1. Barsoum I, Tawedrous E, Faragalla H, Yousef GM. Histo-genomics: digital pathology at the forefront of precision medicine. Diagnosis. 2018;6:203–212. - PubMed
    1. Hu L, et al. Fluorescence in situ hybridization (FISH): An increasingly demanded tool for biomarker research and personalized medicine. Biomark. Res. 2014;2:1–13. - PMC - PubMed
    1. Gryglewski G, et al. Spatial analysis and high resolution mapping of the human whole-brain transcriptome for integrative analysis in neuroimaging. Neuroimage. 2018;176:259–267. - PubMed
    1. HuBMAP Consortium. The human body at cellular resolution: the NIH Human Biomolecular Atlas Program. Nature. 2019;574:187–192. - PMC - PubMed

Publication types

MeSH terms