. 2022 Jan 10;13(1):171.
doi: 10.1038/s41467-021-27796-2.

Hypocrates is a genetically encoded fluorescent biosensor for (pseudo)hypohalous acids and their derivatives

Affiliations

Hypocrates is a genetically encoded fluorescent biosensor for (pseudo)hypohalous acids and their derivatives

Alexander I Kostyuk et al. Nat Commun. .

Abstract

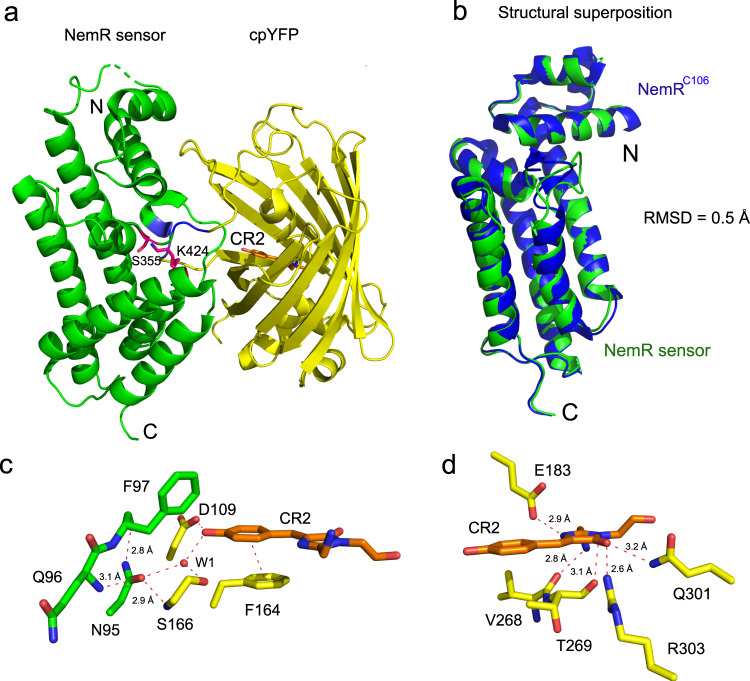
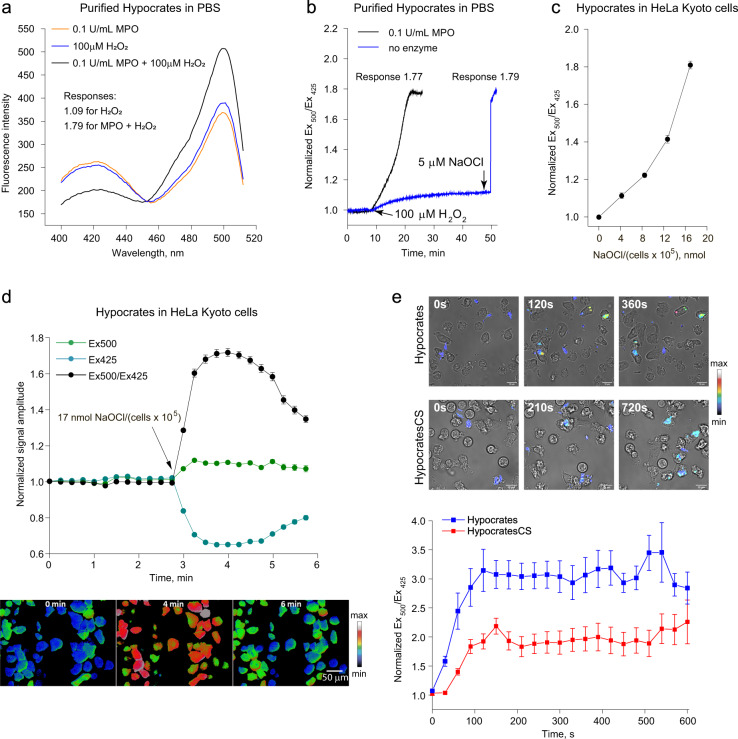
The lack of tools to monitor the dynamics of (pseudo)hypohalous acids in live cells and tissues hinders a better understanding of inflammatory processes. Here we present a fluorescent genetically encoded biosensor, Hypocrates, for the visualization of (pseudo)hypohalous acids and their derivatives. Hypocrates consists of a circularly permuted yellow fluorescent protein integrated into the structure of the transcription repressor NemR from Escherichia coli. We show that Hypocrates is ratiometric, reversible, and responds to its analytes in the 106 M-1s-1 range. Solving the Hypocrates X-ray structure provided insights into its sensing mechanism, allowing determination of the spatial organization in this circularly permuted fluorescent protein-based redox probe. We exemplify its applicability by imaging hypohalous stress in bacteria phagocytosed by primary neutrophils. Finally, we demonstrate that Hypocrates can be utilized in combination with HyPerRed for the simultaneous visualization of (pseudo)hypohalous acids and hydrogen peroxide dynamics in a zebrafish tail fin injury model.


Conflict of interest statement

The authors declare no competing interests.

Figures

Fig. 1
Fig. 1. Hypocrates (NemR-cpYFP biosensor) design and spectral characteristics.
a The structure of NemRC106 (PDB ID: 4YZE) shows the N-terminal DNA-binding domain (colored blue), the C-terminal sensory domain (colored cyan), Cys106 and Lys175 (colored yellow), and the flexible loop (colored red) into which cpYFP was inserted. The N- and C-termini are indicated with N and C, respectively. b The proposed simplified scheme of NemR-cpYFP biosensors functioning in living cells. c The structure of Hypocrates is presented with NemRC106 colored blue/cyan, cpYFP colored yellow, the linkers between NemRC106 and cpYFP colored green, and the flexible loop colored red. The upper numbers represent amino acid numbering corresponding to the intact NemRC106, while the lower numbers represent numbering corresponding to the biosensor. d Optical properties of purified Hypocrates protein in PBS. e Hypocrates fluorescence excitation spectra in E. coli cells in reduced and NaOCl-oxidized forms. f Purified Hypocrates (0.5 µM) fluorescence excitation spectrum behavior in the presence of NaOCl in saturating concentration. g Purified Hypocrates (0.5 µM) fluorescence excitation spectrum behavior in the presence of N-chlorotaurine (NCT) in saturating concentration. h HypocratesCS fluorescence excitation spectra in E. coli cells in reduced and NaOCl-oxidized forms. i HypocratesKA fluorescence excitation spectra in E. coli cells in reduced and NaOCl-oxidized forms. Source data are provided as a Source Data file.
Fig. 2
Fig. 2. The selectivity of Hypocrates.
a Far-UV circular dichroism spectra of reduced and NaOCl oxidized Hypocrates. With increasing NaOCl concentration, an increase of the molar ellipticity [θ] at 208 nm and 222 nm and a decrease at 194 nm were observed. b Upon reduction with DTT, the NaOCl-treated biosensor restores its overall secondary structure to the reduced form. c The excitation ratio of reduced and oxidized Hypocrates depends on the pH value of the buffer solution. NCT – N-chlorotaurine. The data are presented as a mean ± SEM, n = 4 for reduced Hypocrates, n = 3 for other curves. d Selectivity profile of purified Hypocrates (2 µM) towards a set of various redox compounds. ROS - reactive oxygen species, RNS - reactive nitrogen species, RES - reactive electrophilic species, XOX - xanthine oxidase, X - xanthine, CAT - catalase. The data are presented as the mean ± SEM, n = 8 for NaOCl, n = 5 for NCT, n = 6 for ONOO, n = 3 for other compounds. Source data are provided as a Source Data file.
Fig. 3
Fig. 3. Hypocrates sensitivity and reaction rates.
Changes in the fluorescence excitation spectra of Hypocrates (0.5 µM) obtained by additions of a NaOCl or b N-chlorotaurine (NCT) aliquots. c Titration curves of Hypocrates (0.5 µM) in sodium phosphate buffer obtained by additions of NaOCl, NaOBr, HOSCN, or NCT aliquots. The data are presented as a mean ± SEM (for n > 2), n ≥ 2. The maximum amplitudes of response are 2.0-, 1.8-, 1.8- and 1.7-fold for NaOBr, HOSCN, NaOCl, and NCT, respectively. In the presence of NaOBr, NaOCl, and NCT, the probe is saturated at ~5 µM, and for HOSCN at ~1 µM. d The same data as in c, Hypocrates sensitivity towards NaOCl, NaOBr, NCT, and HOSCN is shown. The data are presented as a mean ± SEM (for n > 2), n ≥ 2. eg Hypocrates reaction rates. Changes in cpYFP fluorescence at > 515 nm cut-off (λex = 485 nm) were measured as a function of time (insert). The curves were fitted to a double exponential to obtain the observed rate constants (kobs/fast), which were plotted as a function of different e NaOCl, f NCT, or g NaOBr concentrations. The second-order rate constants for NaOCl (1.4 ± 0.056) × 106 M−1s−1, NCT (6.1 ± 0.3) × 104 M−1s−1, and NaOBr (4.5 ± 0.25) × 106 M−1s−1 were determined from the slope of the straight line [kfast = kon⋅[oxidant] + koff]. The data are presented as a mean ± SD (for n > 2), n ≥ 2. Source data are provided as a Source Data file.
Fig. 4
Fig. 4. The structure of HypocratesCS, a cpYFP-based biosensor (PDB ID: 6ZUI).
a The NemR-sensor domain (green) and the cpYFP domain (yellow) are shown. The chromophore (CR2) in the cpYFP β-barrel is shown in orange stick representation. S355 (to which the reactive C355 was mutated to) and K424 (two orientations of the side chain) are shown in red stick representation. The linkers “SAG” and “GT” are colored blue. The N-terminal residues 1–7 and segments (residues 40-42 and 193–207) are missing. b Superposition of NemRC106 (blue – PDB ID: 4YZE) with the NemR-sensor domain (green). RMSD - root-mean-square deviation. c N95 connects the sensor domain (green) with cpYFP (yellow). N95 interacts with the backbone of Q96, F97 of the NemR-sensor domain and with S166 of the cpYFP domain. The 4-hydoxybenzyl group of CR2 interacts with the phenyl-ring of F164 over a distance of 3.8 Å. d The imidazolinone ring of CR2 interacts with R303, Q301, V268, E183, and T269.
Fig. 5
Fig. 5. Hypocrates performance in vitro and in eukaryotic cell culture.
a Fluorescence excitation spectra of purified Hypocrates (0.5 µM) in the presence of individual myeloperoxidase (MPO), H2O2 and the MPO-H2O2 system. b Hypocrates (0.5 µM) signal as a function of time in the presence of individual H2O2 and the MPO-H2O2 system. HOCl, generated by MPO, leads to the development of a saturating response, while a physiologically irrelevant H2O2 concentration induces only minor signal changes. c The titration curve of Hypocrates in HeLa Kyoto cells exposed to different concentrations of NaOCl (values ± SEM, N = 2 experiments, n ≥ 25 cells per experiment). d Upper part: Hypocrates fluorescence changes induced by 17 nmol NaOCl/(105 cells) (values ± SEM, N = 2 experiments, n ≥ 30 cells per experiment). Lower part: Images of Hypocrates in transiently transfected HeLa Kyoto cells exposed to 17 nmol/(105 cells) NaOCl at different time points. Scale bar = 50 µm. The lookup table indicates changes in the Ex500/Ex425 ratio. e Upper part: Images of human neutrophils phagocytosing E. coli cells that express Hypocrates or the control version HypocratesCS. Scale bar = 10 µm. The lookup table indicates changes in the Ex500/Ex425 ratio. Lower part: Hypocrates (blue line) and HypocratesCS (red line) fluorescence changes in E. coli cells phagocytosed by human neutrophils. The starting point on the graph corresponds to the moment at which individual bacteria are phagocytosed by a neutrophil (values ± SEM, N = 3 experiments, 35 bacterial cells in total for each version of the sensor). Source data are provided as a Source Data file.
Fig. 6
Fig. 6. Hypohalous acids and H2O2 dynamics during zebrafish larvae wounding.
a Hypocrates and HyPerRed imaging. Zebrafish embryos were co-injected with Hypocrates or HypocratesCS and HyPerRed mRNAs at the 1-cell stage, and a tail fin amputation assay was performed on 48 h post-fertilization larvae. Images were taken before amputation, and time lapse imaging was performed up to 60 min post-amputation (mpa). The lookup tables indicate changes in the oxidation states of the sensors. Scale bar = 100 µm. b Hypocrates ratio and HyPerRed fluorescence were quantified at the amputation plane and normalized to the mean fluorescence on the uncut tail for each larva. Ratio quantification on larvae tail fin expressing Hypocrates (blue lines) or HypocratesCS (red lines) is shown. Two-way ANOVA test with a Tukey’s multiple comparisons posttest was used to determine if the observed difference was statistically significant. Non-amputated embryos (dashed lines) expressing Hypocrates or HypocratesCS were also imaged as a control (values ± SEM; N = 4 experiments, n ≥ 3 embryos/timepoint; ns no significant, **P< 0.01, ***P< 0,001, versus HypocratesCS cut larvae, P-values are shown). For control embryos (dotted lines), fluorescence has been normalized for each embryo to the first image of the time lapse (t = 0). HyPerRed fluorescence quantification on larvae tail fin expressing HyPerRed (black lines) is shown (values ± SEM, N = 3 experiments, n ≥ 7 embryos/timepoint; ***P< 0.001, versus uncut larvae (dashed line), P-values are shown). Source data are provided as a Source Data file.

References

    1. Finkel T. Signal transduction by reactive oxygen species. J. Cell Biol. 2011;194:7–15. - PMC - PubMed
    1. Dröge W. Free radicals in the physiological control of cell function. Physiol. Rev. 2002;82:47–95. - PubMed
    1. Sies H. Hydrogen peroxide as a central redox signaling molecule in physiological oxidative stress: oxidative eustress. Redox Biol. 2017;11:613–619. - PMC - PubMed
    1. Davies MJ, Hawkins CL, Pattison DI, Rees MD. Mammalian heme peroxidases: from molecular mechanisms to health implications. Antioxid. Redox Signal. 2008;10:1199–1234. - PubMed
    1. Pattison DI, Davies MJ. Absolute rate constants for the reaction of hypochlorous acid with protein side chains and peptide bonds. Chem. Res Toxicol. 2001;14:1453–1464. - PubMed

Publication types

MeSH terms