. 2022 Jan 10;13(1):181.
doi: 10.1038/s41467-021-27801-8.

Single cell transcriptomic landscape of diabetic foot ulcers

Affiliations

Single cell transcriptomic landscape of diabetic foot ulcers

Georgios Theocharidis et al. Nat Commun. .

Abstract

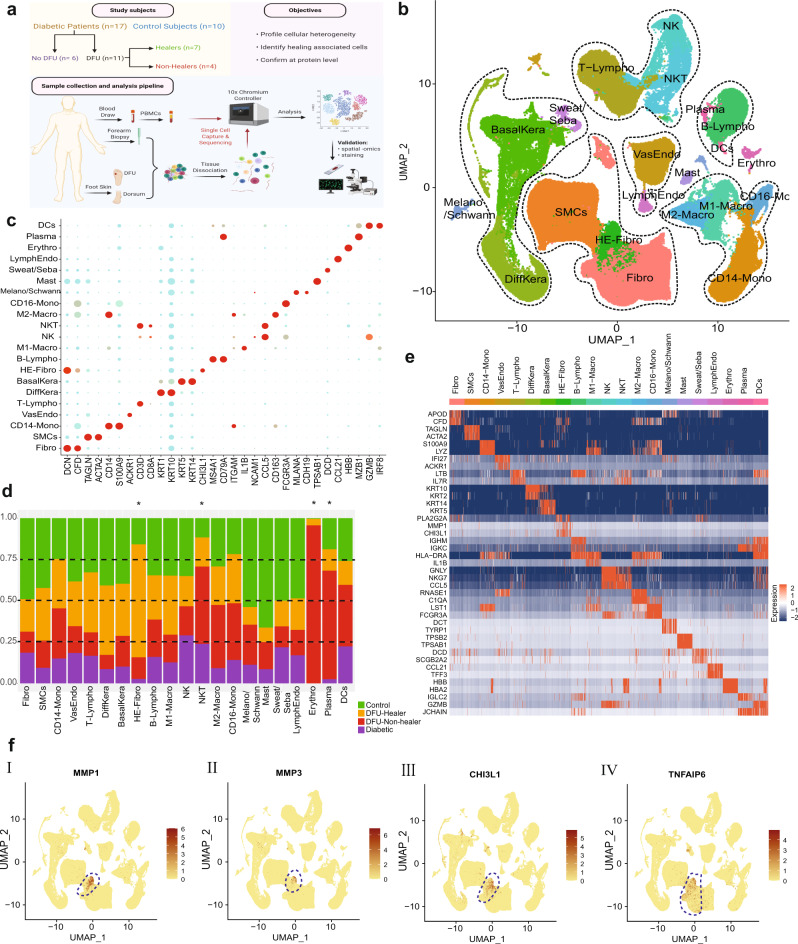
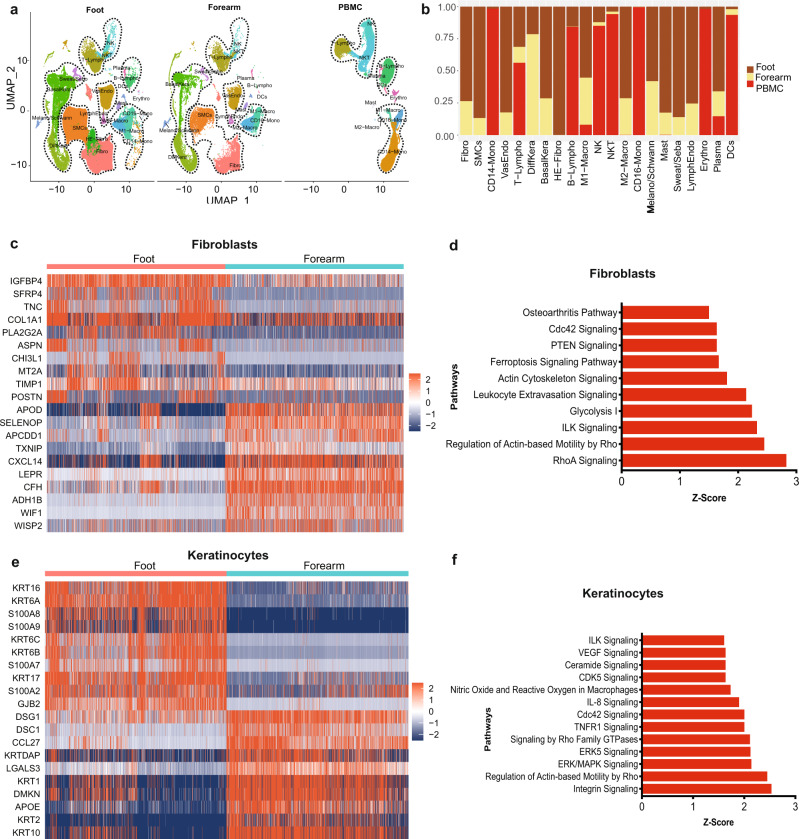
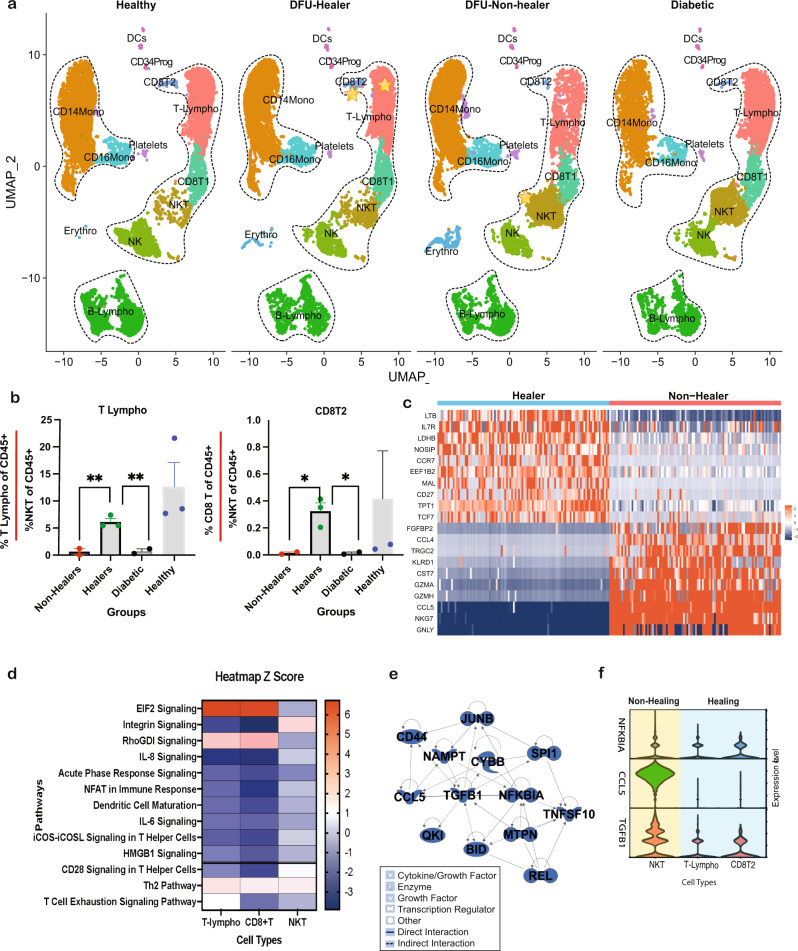
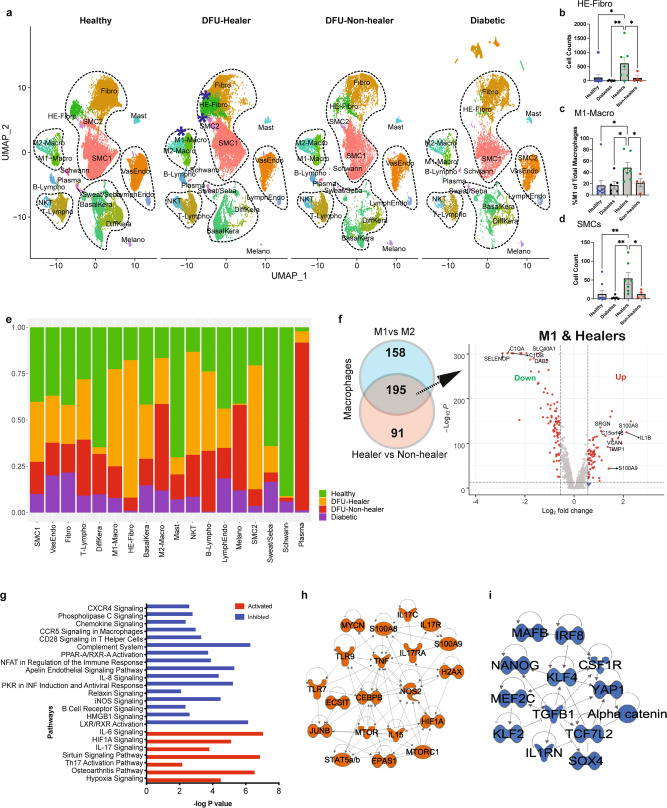
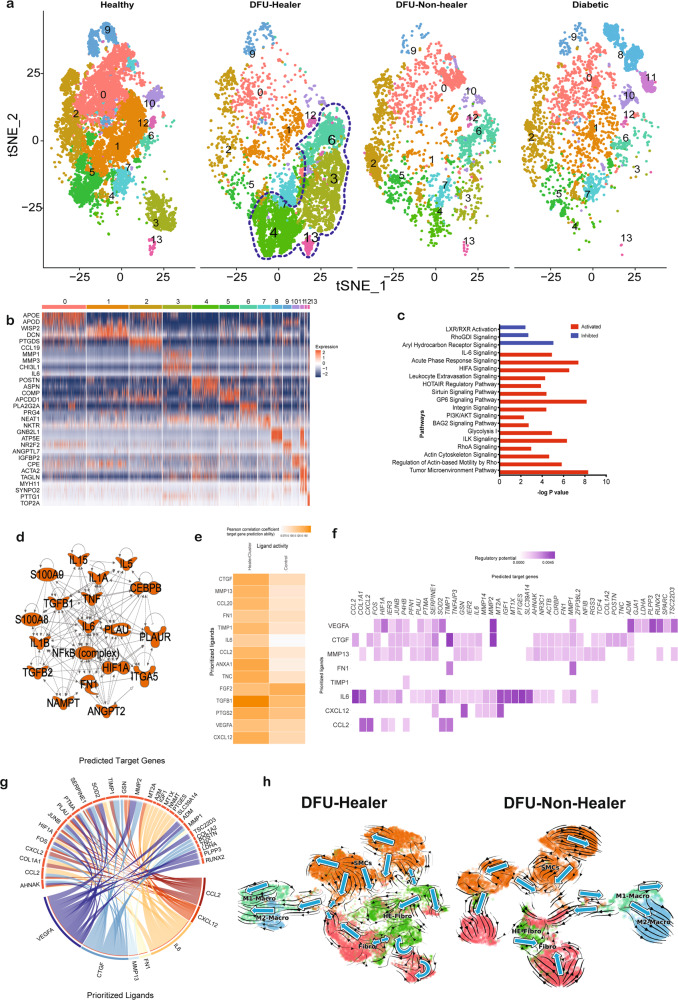
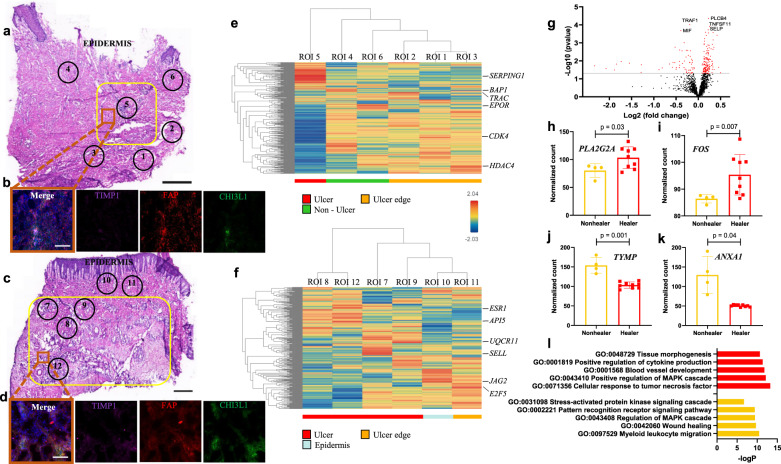
Diabetic foot ulceration (DFU) is a devastating complication of diabetes whose pathogenesis remains incompletely understood. Here, we profile 174,962 single cells from the foot, forearm, and peripheral blood mononuclear cells using single-cell RNA sequencing. Our analysis shows enrichment of a unique population of fibroblasts overexpressing MMP1, MMP3, MMP11, HIF1A, CHI3L1, and TNFAIP6 and increased M1 macrophage polarization in the DFU patients with healing wounds. Further, analysis of spatially separated samples from the same patient and spatial transcriptomics reveal preferential localization of these healing associated fibroblasts toward the wound bed as compared to the wound edge or unwounded skin. Spatial transcriptomics also validates our findings of higher abundance of M1 macrophages in healers and M2 macrophages in non-healers. Our analysis provides deep insights into the wound healing microenvironment, identifying cell types that could be critical in promoting DFU healing, and may inform novel therapeutic approaches for DFU treatment.


Conflict of interest statement

The authors declare no competing interests.

Figures

Fig. 1
Fig. 1. Single-cell RNA sequencing mediated identification and characterization of unique healing enriched fibroblasts in diabetic foot ulcers (DFUs).
a Schematic overview of the study design and number of samples per clinical group. b Uniform Manifold Approximation and Projection (UMAP) embedding of the entire dataset consisting of 174,962 cells. The cells are colored by orthogonally generated clusters, and labeled by manual cell type annotation (HE-Fibro: healing enriched fibroblasts, Fibro: fibroblasts, SMCs: smooth muscle cells, BasalKera: basal keratinocytes, DiffKera: differentiated keratinocytes, Sweat/Seba: sweat and sebaceous gland cells; Melano/Schwann: melanocytes and Schwann cells; Mast: mast cells; VasEndo: vascular endothelial cells; LymphEndo: lymphatic endothelial cells; CD14-Mono: CD14+ monocytes, CD16-Mono: CD16+ monocytes, M1-Macro: M1 macrophages, M2-Macro: M2 macrophages, Erythro: erythrocytes, NK: natural killer cells, T-Lympho: T-lymphocytes, NKT: NK cells and T lymphocytes; B-Lympho: B-lymphocytes, Plasma: plasma cells, DCs: dendritic cells). Dotted lines are drawn around cell groups of similar lineages. c Dot plot showing expression of different cell type-specific marker genes, used to annotate the cell types. Size of dots indicates percentage of cells in each cell cluster expressing the marker gene; color represents averaged scaled expression levels; cyan: low, red: high. d Stacked bar plots showing the proportion of different cell types across the four clinical groups. Green: Healthy subjects, orange: DFU-Healers, red: DFU-Non-healers, purple: Diabetic patients. Cell types with significant differences among the clinical groups are marked with an asterisk. The bar plots for individual cell types are presented in Supplementary Fig. 1. e Heatmap showing the top highly expressed (red) genes in each of the cell clusters. f Feature plots depicting the expression of key genes (I) MMP1, (II) MMP3, (III) CHI3L1, (IV) TNFAIP6, that were significantly overexpressed in the healing enriched fibroblasts associated with healing of DFUs. The schematic on (a) was created with BioRender (BioRender.com).
Fig. 2
Fig. 2. Comparative single-cell transcriptome analysis profiles of foot, forearm, and PBMCs, delineating gene signatures, and biological pathways across anatomical sites.
a Split UMAP of Foot, Forearm, and PBMC samples. The cell clusters were annotated manually according to various canonical and novel cell types based on expression of specific markers (as described in Fig. 1b, c). Dotted lines are drawn around cell groups of similar lineages. b Stacked bar plots showing the proportion (y-axis) of different cell type from foot, forearm, and PBMC. Dark brown: foot, beige: forearm, red: PBMCs. c Heatmap showing significantly differentially expressed genes between foot and forearm fibroblast cell clusters. Relative gene expression is shown in pseudo color, where blue represents downregulation, and red represents upregulation. d Pathway enrichment analysis on genes that are significantly differentially expressed between foot and forearm cell fibroblast clusters. The pathways analysis was performed using Ingenuity Pathways analysis (IPA) tool that calculate significance of impact on pathways using one-tailed Fisher’s exact test and Z-score. The pathways with P value < 0.01 and Z score >2 were considered significantly activated. e Heatmap showing significantly differentially expressed genes in keratinocytes cell clusters between foot and forearm samples. f Pathway enrichment analysis on genes that are significantly differentially expressed between foot and forearm keratinocytes cell clusters.
Fig. 3
Fig. 3. Comparative transcriptome profiles analysis of PBMCs in different clinical groups, uncovering differences in systemic immune landscape associated with wound healing response in DFUs.
a UMAP dimensionality reduction embedding of PBMCs from DFU-Healers, DFU-Non-healers, Healthy subjects, and non-DFU DM patients. The identified cell types were DCs: dendritic cells; VasEndo: vascular endothelial cells; T-lympho: T lymphocytes; CD8T1: CD8+ T lymphocytes cluster 1; CD8T2: CD8+ T lymphocytes cluster 2; NK: natural killer cells; NKT: natural killer and T cells; B-lympho: B lymphocytes; CD14Mono: CD14+ monocytes; CD16Mono: CD16+ monocytes. Dotted lines are drawn around cell groups of similar lineages. b Bar plots showing percentage of T-lymphocytes (T-lympho) and CD8+ T lymphocytes cluster 2 (CD8T2) per percentage of NKT cells in the CD45+ subset of cells across various clinical groups. DFU-healers depict significantly higher ratio of T-lympho and CDT2 cell cluster in comparison to DFU-Non-healers and Diabetic. Data represent the mean and standard error of mean (SEM) values from n = 2 Non-Healers, n = 3 Healers, n = 2 Diabetic and n = 3 Healthy subjects. p = 0.01 for Healers vs Non-Healers and p = 0.006 for Healers vs Diabetic in T-Lympho; p = 0.036 for Healers vs Non-Healers and p = 0.035 for Healers vs Diabetic in CD8T2 using two-sided Welch’s t-test. c Heatmap showing significant DEGs in Healers compared to Non-healers in the T-lympho, CD8T2 and NKT cell clusters. d Biological pathways that are significantly (P value < 0.01) activated (Z score >1.5) /inhibited (Z score < −1.5) in T-lympho, CD8T2 cells of Healers in contrast to NKT cells of Non-healers. Activation and inhibition of key upstream regulators is shown in pseudo color, where blue represents inhibition, and red represents activation. e Upstream regulatory molecules significantly inhibited (blue) in the T-lympho and CD8T2 cells of Healers as compared to Non-healers at the systemic level. Legend shows shapes and lines annotation for the regulatory network. f Violin plots showing expression levels of 3 key upstream regulator molecules NFKBIA, CCL5, and TGFB1, in the NKT, T-Lympho, and CD8T2 clusters.
Fig. 4
Fig. 4. Comparative analysis of transcriptome profiles of foot samples in the different clinical groups, elucidating differences in cell type composition, gene expression, and biological pathways.
a UMAP dimensionality reduction embedding of foot cells from DFU-Healers, DFU-Non-healers, Healthy subjects, and non-DFU DM patients. The cellular clusters depicting significant enrichment in the healers are marked with blue asterisks. Dotted lines mark cell groups of similar lineages. Comparative analysis depicted b HE-Fibro, c M1 macrophages, and d SMC2 cellular enrichment in the foot sample from DFU healers. Data represent the mean and SEM values from n = 9 Healthy, n = 6 Diabetic, n = 7 Healer, and n = 4 Non-healer subjects. Two-sided Welch’s t-test was used; p = 0.013 for Healthy vs Healers, p = 0.007 for Diabetes vs Healers and p = 0.006 for Healers vs Non-healers in (b); p = 0.026 for Healthy vs Healers, p = 0.017 for Diabetes vs Healers and p = 0.042 for Healers vs Non-healers in (c); p = 0.005 for Healthy vs Healers, p = 0.002 for Diabetes vs Healers and p = 0.02 for Healers vs Non-healers in (d). e Stacked bar plots showing the proportions of different cell types across the different clinical groups (green: Healthy subjects, orange: DFU-Healers, red: DFU-Non-healers, purple: non-DFU DM patients). f Venn diagram analysis to compare genes that are differentially expressed between M1 and M2 macrophages and between Healers vs. Non-healers. The comparison identified 195 genes that are differentially expressed in M1 macrophages from DFU-Healers. Volcano plot showing the genes that are significantly differentially expressed (red dots) in M1 macrophages of Healers (Benjamini–Hochberg corrected P-value <0.00001, FC > 1). g Selected biological pathways that are significantly (P value <0.01) affected in the healing associated M1 macrophages. Each bar represents a pathway with significance of enrichment determined using the one-tail Fisher’s exact t-test (−log10 P value is shown on primary X-axis). The directionality of each pathway is depicted using a pseudo color (red for activated, blue for inhibited). Regulators that are significantly activated (h) and inhibited (i) in the M1 macrophages from Healers. The activation and inhibition of pathways was measured based on Z-score calculation using the IPA platform.
Fig. 5
Fig. 5. Identification and characterization of distinct subpopulations of fibroblasts with specific gene signature associated with healing DFUs.
a t-distributed Stochastic Neighbor Embedding (t-SNE) analysis depicting 14 sub-clusters of fibroblasts. The sub-clusters enriched in DFU-Healers are marked with lasso. b Heatmap showing the top highly expressed genes (red) in sub-clusters. c Selected biological pathways that are significantly (P value <0.01) affected in the healing enriched fibroblasts. The directionality of each pathway is depicted using a pseudo color (red for activated, blue for inhibited). d Regulators that are significantly activated in the healing enriched fibroblasts. e Heatmap showing the Pearson correlation between ligands from ‘sender’ sub-cluster 3 and target gene expression in ‘healer fibroblasts, i.e., the other HE-Fibro sub-clusters 4, 6, and 13 (left column), and ‘control’ fibroblasts sub-clusters 0, 2, and 5 (right column). A darker orange color indicates a higher Pearson correlation between the ligand and gene expression within the receiver cell population. f This heatmap of select ligands expressed by HE-Fibro sub-cluster 3 (rows) to regulate the genes which are differentially expressed by the ‘healer’ fibroblasts (columns). Well-established ligand-target gene interactions shown with a darker shade of purple. g Circos plot displaying the association between ligands expressed in the sub-cluster 3 (bottom semi-circle) with their targeted differentially expressed genes in sub-clusters 4, 6, and 13. h RNA Velocity plots for DFU-Healer and DFU-Non-healer subsets; black streamline arrows represent predicted direction of cell state change and trajectories. Larger blue arrows represent overall velocity for each area of the UMAP.
Fig. 6
Fig. 6. Exploring the spatial transcriptome of DFU-Healers and DFU-Non-healers.
a, c Representative H&E-stained sections from a (a) non-healing and (c) healing DFU. Yellow box demarcates the ulcer area and numbered circles the ROIs selected for sequencing. b, d Immunofluorescence staining for HE-Fibro markers TIMP1 (purple), CHI3L1 (green), and pan-fibroblast marker FAP (red) performed on a serial section from the same sample. DAPI was used for nuclear counterstain. The location of the image capture is noted with an orange box on (a) and (c). e, f Hierarchical clustering analysis heatmaps depict the transcriptomic profiles of the selected ROIs. The most highly expressed gene per ROI is highlighted. ROIs were annotated based on their location as Ulcer (red), Non-Ulcer (green), Ulcer edge (orange), and Epidermis (light blue). Expression levels are shown according to the gradient middle right (blue low to red high). g Volcano plot showing DE analysis results from ROIs within the ulcer in Healers (2 patients, 9 ROIs) vs Non-healers (2 patients, 4 ROIs). Each dot represents a gene, with red ones being above the significance threshold. The top five genes are highlighted. hk Selected notable genes upregulated in Healers (h, i) and Non-healers (j, k). Data represent mean ± SD from n = 4 ulcer ROIs of 2 Non-healers and n = 9 ulcer ROIs of 2 Healers. Two-tailed unpaired t-test with Benjamini–Hochberg procedure for adjusted p-values was used to calculate p-values. l GO analysis for biological processes enriched in Healers (top, red) and Non-healers (bottom, yellow). Stainings were performed three times with two biologically independent patient samples per group. Scale bars are 1 mm in (a, c) and 100 μm in (b, d).

References

    1. Jeffcoate WJ, et al. Current challenges and opportunities in the prevention and management of diabetic foot ulcers. Diabetes Care. 2018;41:645–652. - PubMed
    1. Armstrong DG, et al. Five year mortality and direct costs of care for people with diabetic foot complications are comparable to cancer. J. Foot Ankle Res. 2020;13:16. - PMC - PubMed
    1. Sen CK. Human wounds and its burden: an updated compendium of estimates. Adv. Wound Care. 2019;8:39–48. - PMC - PubMed
    1. Armstrong DG, Boulton AJM, Bus SA. Diabetic foot ulcers and their recurrence. N. Engl. J. Med. 2017;376:2367–2375. - PubMed
    1. Baltzis D, Eleftheriadou I, Veves A. Pathogenesis and treatment of impaired wound healing in diabetes mellitus: new insights. Adv. Ther. 2014;31:817–836. - PubMed

Publication types

MeSH terms