. 2022 Jan 10;13(1):134.
doi: 10.1038/s41467-021-27759-7.

Mutations in Hcfc1 and Ronin result in an inborn error of cobalamin metabolism and ribosomopathy

Affiliations

Mutations in Hcfc1 and Ronin result in an inborn error of cobalamin metabolism and ribosomopathy

Tiffany Chern et al. Nat Commun. .

Abstract

Combined methylmalonic acidemia and homocystinuria (cblC) is the most common inborn error of intracellular cobalamin metabolism and due to mutations in Methylmalonic Aciduria type C and Homocystinuria (MMACHC). Recently, mutations in the transcriptional regulators HCFC1 and RONIN (THAP11) were shown to result in cellular phenocopies of cblC. Since HCFC1/RONIN jointly regulate MMACHC, patients with mutations in these factors suffer from reduced MMACHC expression and exhibit a cblC-like disease. However, additional de-regulated genes and the resulting pathophysiology is unknown. Therefore, we have generated mouse models of this disease. In addition to exhibiting loss of Mmachc, metabolic perturbations, and developmental defects previously observed in cblC, we uncovered reduced expression of target genes that encode ribosome protein subunits. We also identified specific phenotypes that we ascribe to deregulation of ribosome biogenesis impacting normal translation during development. These findings identify HCFC1/RONIN as transcriptional regulators of ribosome biogenesis during development and their mutation results in complex syndromes exhibiting aspects of both cblC and ribosomopathies.


Conflict of interest statement

The authors declare no competing interests.

Figures

Fig. 1
Fig. 1. Generation of Hcfc1 and Ronin point mutants.
a Chromatograph traces of wild type and Hcfc1 A115V hemizygous male mice showing the c.344 C>T (p.Ala115Val) mutation and a silent mutation (c.351 T>A) creating a BccI restriction enzyme site. b Amino acid structural change due to A115V. c Image of the predicted A115V substitution within the HCFC1 protein. d Alanine 115 in HCFC1 is evolutionarily conserved through vertebrates. e Mouse HCFC1 structure showing the localization of the A115V mutation. f Ratios of Hcfc1A115V/Y male progeny at E16.5, P0, and weaning. Statistically significant differences in the observed genotypes were determined using the chi-squared test (χ2 = 53.13, ***p = 3.12 × 10−13). g Chromatograph traces of wild type and Ronin F80L homozygous mice showing the c.240 C>G (p.Phe80Leu) mutation. h Amino acid structural change due to F80L. i Image of the predicted F80L substitution within the RONIN protein. j Phenylalanine 80 in RONIN is evolutionarily conserved through vertebrates. k Mouse RONIN structure showing the localization of the F80L mutation. l Ratios of RoninF80L/F80L progeny at E18.5 (C-sectioned) and weaning. Statistically significant differences in the observed genotypes at weaning were determined using the chi-squared test (χ2 = 89.68, ***p = 2.79 × 10−21).
Fig. 2
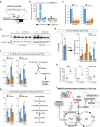
Fig. 2. Cobalamin-related metabolic perturbations in Hcfc1A115V/Y and RoninF80L/F80L mice.
a RONIN binding motif within the Mmachc promoter. b RONIN ChIP-PCR of the Mmachc promoter. c QrtPCR analysis (n = 3 per genotype) of Mmachc in the Hcfc1A115V/Y and RoninF80L/F80L embryonic brains. d Western blot analysis of MMACHC in the Hcfc1A115V/Y and RoninF80L/F80L embryonic brains. e [57Co] cyanocobalamin incorporation assay (n = 8 wild type and n = 5 mutants) to determine cobalamin distribution in MEFs. f 5-[14C] methyltetrahydrofolate (methylTHF) incorporation assay of methionine synthase (MTR) activity in MEFs (n = 3 or 4 wild type and n = 3 mutants). g [14C] propionate incorporation assay of methylmalonyl-CoA mutase activity in MEFs (n = 3 or 7 wild type and n = 3 or 7 mutants). h Plasma levels of methylmalonic acid (MMA), homocysteine (Hcy), and methionine (n = 5 or 7 wild type and n = 5 or 7 mutants). i Summary of MMACHC-dependent metabolic deficiency identified in Ronin and Hcfc1mutant mice. RONIN F80L and HCFC1 A115V mutant protein function is compromised leading to reduced Mmachc transcription and protein activity (1 and 2). This defect results in reduced production of MeCbl and reduced MTR activity (3), and the corresponding buildup of the upstream metabolite homocysteine (4). Reduced MMACHC also leads to lower levels of AdoCbl production and MUT activity (5 and 6), and the buildup of methylmalonyl-coA (7). All data are shown as mean ± SEM and n ≥ 3 biologically independent samples per genotype. Statistically significant differences between genotypes were determined using the t test (two-tailed). *p < 0.05, **p < 0.01, ***p < 0.001, ****p < 0.0001. Source data are provided as a Source data file.
Fig. 3
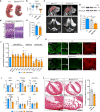
Fig. 3. RoninF80L/F80L mice exhibit cblC-like phenotypes.
a, b Runted E18.5 RoninF80L/F80L mice with lower body weights (data are shown as mean ± SEM, n = 10 +/+, n = 17+/F80L, n = 11 F80L/F80L, statistically significant differences between genotypes were determined using ANOVA and Tukey’s multiple comparisons test). c Micro-CT analysis of the CNS showing expanded ventricles (blue arrow) and thinner cortex (white arrows) in RoninF80L/F80L neonates. d, e Hematoxylin and Eosin (H&E) staining showing cortical thinning in RoninF80L/F80L mice (data are shown as mean ± SEM, n = 5 +/+, n = 10 F80L/F80L, statistically significant differences between genotypes were determined using the t test, *p < 0.05). f E18.5 brain qrtPCR analysis (data are shown as mean ± SEM, n = 3 per genotype, statistically significant differences between genotypes were determined using the t test (two-tailed), *p < 0.05, ***p < 0.001). g E18.5 brain western blot analysis (data are shown as mean ± SEM, n = 4 per genotype, statistically significant differences between genotypes were determined using ANOVA and Tukey’s multiple comparisons test, *p < 0.05). h E18.5 spinal cord immunofluorescence. i Peripheral blood analysis (data are shown as mean ± SEM, n = 12 + /+, n = 22+/F80L, n = 7 F80L/F80L, statistically significant differences between genotypes were determined using ANOVA and Tukey’s multiple comparisons test, **p < 0.01, ***p < 0.001, ****p < 0.0001). j H&E staining showing hypertrabeculation and ventricular wall thinning of the RoninF80L/F80L heart. Data are shown as mean ± SEM, n = 3+/F80L, n = 7 F80L/F80L, statistically significant differences between genotypes were determined using the t test (two-tailed). **p < 0.01. Source data are provided as a Source data file.
Fig. 4
Fig. 4. Craniofacial dysmorphia in adult Hcfc1A115V/Y mice.
a, b Hcfc1A115V/Y mice exhibit a tilted nasal angle (red arrows and dashed lines) and a curved snout (white arrowheads). c A subset of the Hcfc1A115V/Y mice showed a nasal angle over 10°. Data are shown as mean ± SEM, n = 19 wild type, n = 18 mutants, statistically significant differences between genotypes were determined using the t test (two-tailed). **p < 0.006. d Hcfc1A115V/Y mice have a smaller centroid size than wild type. Data are shown as mean ± SEM, n = 17 wild type, n = 13 mutants, statistically significant differences between genotypes were determined using the t test (two-tailed). **p = 0.003. e PCA of the landmark-free morphometrics showing a subset of Hcfc1A115V/Y mice with a significant deviation from wild type (arrows). f Superior and lateral views of the averaged skull shape of the three most severely affected Hcfc1A115V/Y mice overlaid with the average of three wild type. g Stretch heatmap showing the % volume change between the three most severely affected Hcfc1A115V/Y mice compared to controls. Source data are provided as a Source data file.
Fig. 5
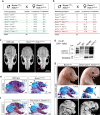
Fig. 5. Ronin and Hcfc1 genetically interact to regulate craniofacial development.
a Crosses revealing the expected Mendelian ratios at E16.5 (green boxes). b Crosses revealing underrepresentation of Ronin/Hcfc1 double heterozygotes and complete lethality of Ronin+/F80L; Hcfc1A115V/Y by weaning (red boxes). c Craniofacial dysmorphia similar to the Hcfc1A115V/Y mice (red arrowhead). d RONIN and HCFC1 co-immunoprecipitation. e Skeletal staining showing RoninF80L/F80L craniofacial hypoplasia of both mesoderm- (black arrowheads) and neural crest-derived (red arrowheads) bones. f Mesoderm-specific Ronin CKO (Prrx1-Cre+/tg; Roninflox/flox) showing loss of mesoderm-derived bones (black arrowheads). g Neural crest-specific Ronin CKO (Wnt1-Cre2+/tg; Roninflox/flox) showing agenesis of the neural crest-derived craniofacial skeleton (arrows). For all data (cg) n = 3 biologically independent samples per genotype. Source data are provided as a Source data file.
Fig. 6
Fig. 6. Mmachc reduction is not responsible for the Hcfc1A115V/Y and RoninF80L/F80L craniofacial phenotypes.
a Schematic of the Mmachc floxed allele. b QrtPCR analysis of E10.5 Wnt1-Cre2+/tg; Mmachcflox/flox neural crest-specific CKOs. Data are shown as mean ± SEM, n = 2 controls, n = 2 mutants, statistically significant differences between genotypes were determined using the t test (two-tailed). ****p = 2.04 × 10−6, ***p = 0.0004. c CKO craniofacial development appeared indistinguishable from wild type. d Schematic of the Mmachc overexpression transgene (Mmachc-OE). e Alizarin red and alcian blue-stained skeletons. f The Mmachc-OE transgene fails to rescue the craniofacial agenesis of Wnt1-Cre2+/tg; Roninflox/flox mice. g Average serum MMA and Hcy levels (data are shown as mean ± SEM, n = 5 biologically independent samples per genotype, statistically significant differences between genotypes were determined using ANOVA and Tukey’s multiple comparisons test, *p < 0.05, **p < 0.01). h Pup survival to weaning. i Quantified surface area, length, and width of the craniofacial bones (data are shown as mean ± SEM, n = 19+/Y, n = 18 A115V/Y, n = 5 A115V/Y; Mmachc-OE biologically independent samples per genotype, statistically significant differences between genotypes were determined using ANOVA and Tukey’s multiple comparisons test, **p < 0.01, ***p < 0.001, ****p < 0.0001). Abbreviations: nasal bone length (NL), nasal bone width (NW), frontal bone length (FL), frontal bone width (FW), parietal bone length (PL), interparietal bone length (IL), interparietal bone width, (IW) and the distance between left and right anterolateral corner of the frontal bone (LR). Source data are provided as a Source data file.
Fig. 7
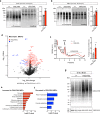
Fig. 7. RoninF80L/F80L mice have defects in ribosome biogenesis leading to deregulated translation.
a, b Western blot analysis of puromycin incorporation assays. Data are shown as mean ± SEM, n = 3 (MEFs) or 6 (brains) wild type, n = 3 (MEFs) or 6 (brains) mutants, statistically significant differences between genotypes were determined using the t test (two-tailed). **p = 0.002, *p = 0.02. c Polysome profiling of wild type and RoninF80L/F80L E18.5 brains. Data are shown as mean ± SEM, n = 5 wild type, n = 5 mutants, statistically significant differences between genotypes were determined using the t test (two-tailed). *p = 0.047. d Volcano plot of the RoninF80L/F80L MEF protein mass spectrometry. e, f GO analysis of the proteins upregulated and downregulated in the RoninF80L/F80L MEF mass spectrometry. g Western blot of increased protein ubiquitination in E16.5 RoninF80L/F80L brains. Source data are provided as a Source data file.
Fig. 8
Fig. 8. Ribosomopathy phenotypes in Hcfc1 and Ronin mutants.
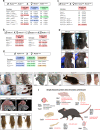
ad Crosses and penetrance of ribosomopathy-associated phenotypes. e White belly spotting phenotype. f Homeotic transformation of C7 to T1 indicated by an ectopic rib on C7 (arrows). g, h Kinked tails in Ronin+/F80L; Hcfc1A115V/Y embryos and a single Ronin+/F80L mouse. i Hypopigmented paws on Hcfc1A115V/Y adults. j Exencephaly in RoninF80L/F80L embryos. k Polydactyly in a Ronin+/F80L; Hcfc1+/A115V mouse. l Summary of phenotypes reported in single ribosome protein mutants. Phenotypes listed in red were observed in Ronin and Hcfc1 mutants, but never in wild type mice. Panel l was created with BioRender.com.
Fig. 9
Fig. 9. The Hcfc1 A115V and Rpl24 Bst alleles genetically interact.
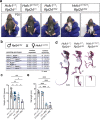
a Expanded belly spot in the Hcfc1A115V/Y; Rpl24+/Bst mice. b Results of genetic crosses between Rpl24+/Bst and Hcfc1+/A115V mice. c Weight measurements showing a trend of increased runtedness in the Hcfc1A115V/Y; Rpl24+/Bst mice as compared to Hcfc1+/A115V and Rpl24+/Bst. d, e Skeleton preparations and tail length measurements showing that 2/3 Hcfc1A115V/Y; Rpl24+/Bst mice exhibit a more severe shortening of the tail as compared to the Rpl24+/Bst mice. All quantified data are shown as mean ± SEM and n ≥ 3 biologically independent samples per genotype. Statistically significant differences between genotypes were determined using ANOVA and Tukey’s multiple comparisons test, *p < 0.05, **p < 0.01, ***p < 0.001, ****p < 0.0001. Source data are provided as a Source data file.

References

    1. Kolhouse JF, Allen RH. Recognition of two intracellular cobalamin binding proteins and their identification as methylmalonyl-CoA mutase and methionine synthetase. Proc. Natl Acad. Sci. USA. 1977;74:921–925. - PMC - PubMed
    1. Mellman IS, Youngdahl-Turner P, Willard HF, Rosenberg LE. Intracellular binding of radioactive hydroxocobalamin to cobalamin-dependent apoenzymes in rat liver. Proc. Natl Acad. Sci. USA. 1977;74:916–920. - PMC - PubMed
    1. Froese DS, Fowler B, Baumgartner MR. Vitamin B12, folate, and the methionine remethylation cycle-biochemistry, pathways, and regulation. J. Inherit. Metab. Dis. 2019;42:673–685. - PubMed
    1. Banerjee R, Gherasim C, Padovani D. The tinker, tailor, soldier in intracellular B12 trafficking. Curr. Opin. Chem. Biol. 2009;13:484–491. - PMC - PubMed
    1. Watkins D, Rosenblatt DS. Lessons in biology from patients with inborn errors of vitamin B12 metabolism. Biochimie. 2013;95:1019–1022. - PubMed

Publication types

MeSH terms

Supplementary concepts