. 2022 Jan 10;13(1):131.
doi: 10.1038/s41467-021-27800-9.

Dynamic transcriptome and chromatin architecture in granulosa cells during chicken folliculogenesis

Affiliations

Dynamic transcriptome and chromatin architecture in granulosa cells during chicken folliculogenesis

Diyan Li et al. Nat Commun. .

Abstract

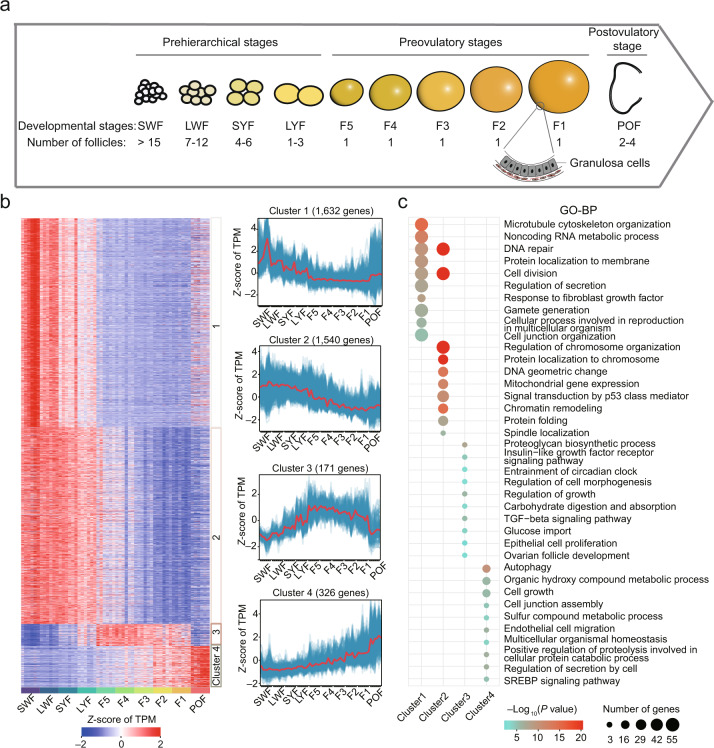
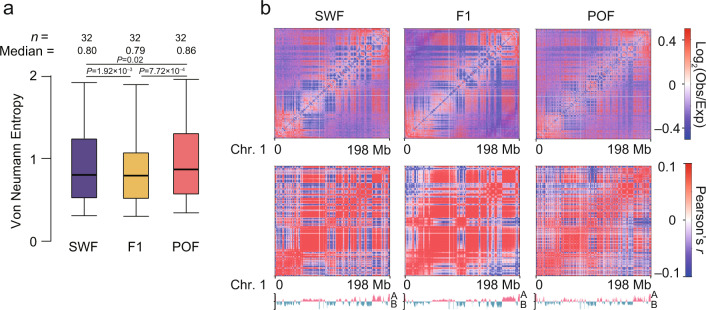
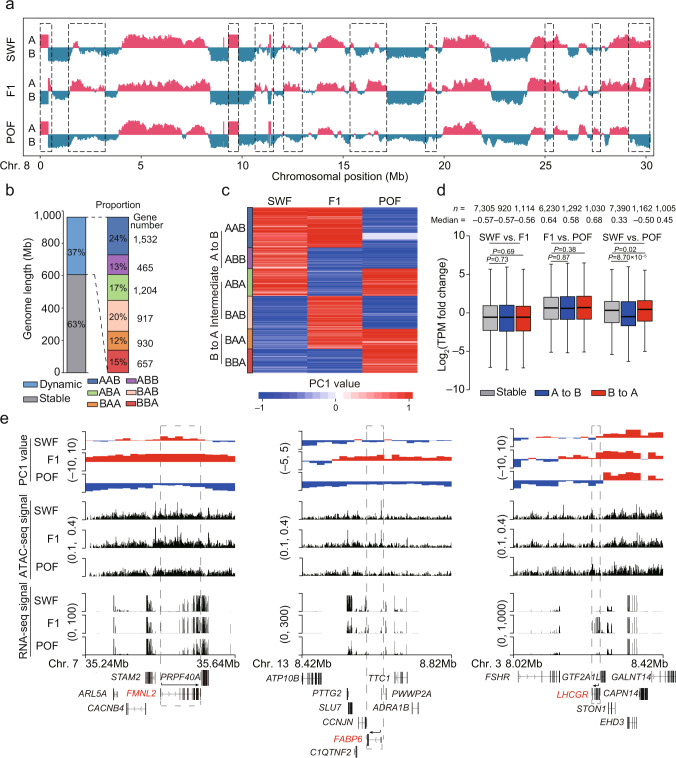
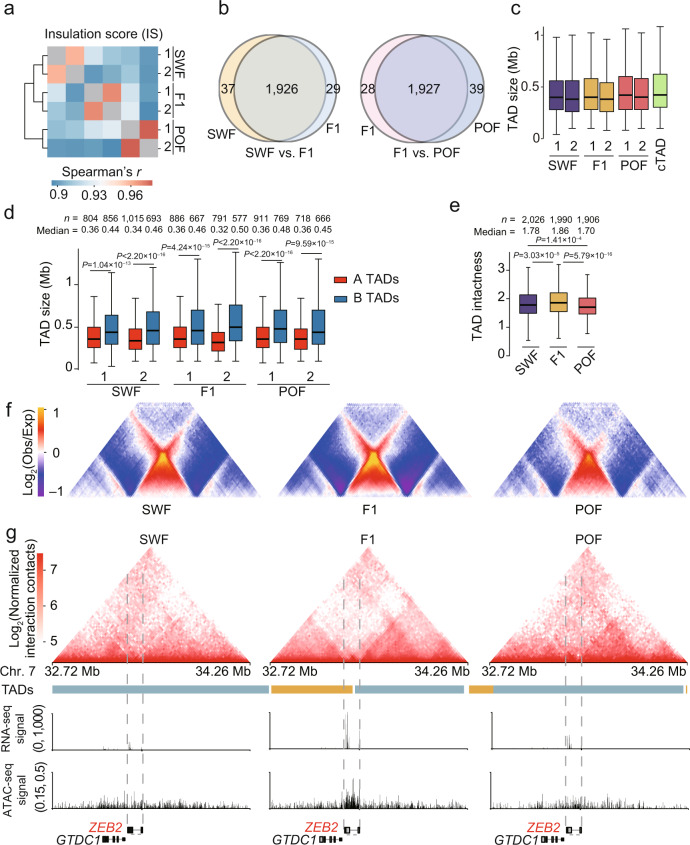
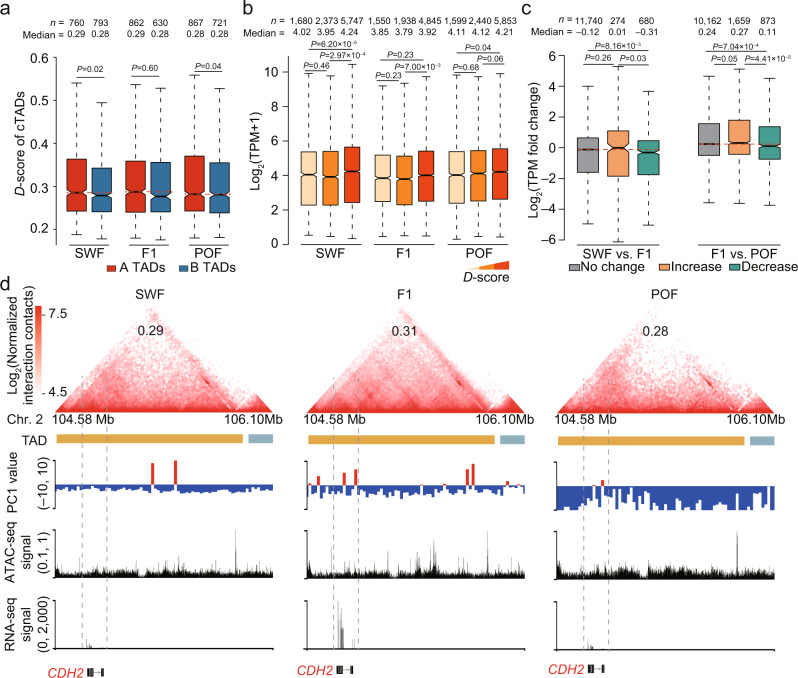
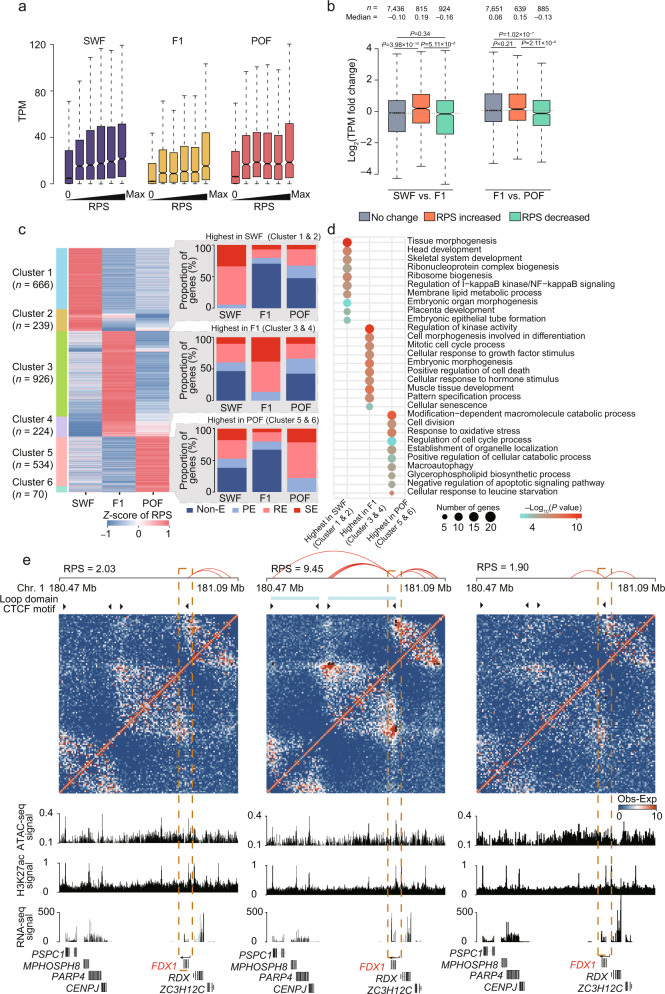
Folliculogenesis is a complex biological process involving a central oocyte and its surrounding somatic cells. Three-dimensional chromatin architecture is an important transcription regulator; however, little is known about its dynamics and role in transcriptional regulation of granulosa cells during chicken folliculogenesis. We investigate the transcriptomic dynamics of chicken granulosa cells over ten follicular stages and assess the chromatin architecture dynamics and how it influences gene expression in granulosa cells at three key stages: the prehierarchical small white follicles, the first largest preovulatory follicles, and the postovulatory follicles. Our results demonstrate the consistency between the global reprogramming of chromatin architecture and the transcriptomic divergence during folliculogenesis, providing ample evidence for compartmentalization rearrangement, variable organization of topologically associating domains, and rewiring of the long-range interaction between promoter and enhancers. These results provide key insights into avian reproductive biology and provide a foundational dataset for the future in-depth functional characterization of granulosa cells.


Conflict of interest statement

The authors declare no competing interests.

Figures

Fig. 1
Fig. 1. The transcriptomic profiles of granulosa cells (GCs) during folliculogenesis.
a Schematics of chicken ovarian follicle development at ten time points during folliculogenesis. The number of follicles for each stage in the chicken ovary is indicated below the stage. GCs in the F1 follicle are indicated on the plot. b Expression profiles of four temporal expression clusters revealed by k-means clustering. Left: Expression heatmap drawn using Z-score of TPM values for each gene in the four clusters. Right: Temporal expression profiles of the four clusters. The red lines represent mean gene expression levels, and the blue lines represent gene expression levels for each gene in the relative cluster during folliculogenesis. c The top ten significantly enriched Gene Ontology-Biological Process (GO-BP) terms for genes in each cluster. Source data are provided as a Source Data file.
Fig. 2
Fig. 2. Dynamic changes of chromatin architecture during granulosa cell development.
a Quantification of the disorder in the chromatin structure of the whole genome using Von Neumann Entropy (VNE). P values were calculated using two-sided Wilcoxon rank-sum test. In the boxplot, the internal line indicates the median, the box limits indicate the upper and lower quartiles and the whiskers extend to 1.5 IQR from the quartiles. b Normalized Observed/Expected contact maps (top panels) and correlation matrixes of PC1 values (bottom panels) at 20 kb resolution for chromosome 1. Source data are provided as a Source Data file.
Fig. 3
Fig. 3. Compartmentalization dynamics in chicken granulosa cells during folliculogenesis.
a Compartment switches (gray dotted boxes) on chromosome 8. A/B compartments are indicated by PC1 values. b Genomic lengths and proportions of stable and dynamic compartments. Dynamic compartments are classified into six types of transitions. c Heatmap of the PC1 values for the compartment switching regions. d Expression levels of DEGs located in compartment switching regions (from A to B: blue; from B to A: red) compared to those in stable compartments (gray). P values were calculated using two-sided Wilcoxon rank-sum test. In the boxplot, the internal line indicates the median, the box limits indicate the upper and lower quartiles and the whiskers extend to 1.5 IQR from the quartiles. e Three representative functional genes (red) subject to compartment switching during folliculogenesis, including FMNL2, FABP6, and LHCGR. The dashed line boxes indicate the chromosomal locations of the interested genes. The tracks show the compartment (top panels), ATAC (middle panels), and gene expression (bottom panels) features within 400 kb. Gene structures are indicated below the tracks. The black arrows indicate the direction of the gene transcription. Source data are provided as a Source Data file.
Fig. 4
Fig. 4. TAD boundaries are largely stable in chicken granulosa cells during folliculogenesis.
a Spearman’s r heatmap of the insulation score (IS) at different developmental stages. b Overlap of TAD boundaries between successive stages of follicle development. c Boxplots showing TAD sizes in GCs during folliculogenesis, where cTADs represent consensus TADs. d Comparison of TAD size for A and B TADs. e TAD intactness at each stage. f Examples of average TAD representation with intra- or inter-TAD contact in SWF, F1 and POF respectively. g Changes in TAD boundaries and expression levels at the locus of ZEB2 gene (red) across different developmental stages. Top: Hi-C contact heatmaps of the genomic region around ZEB2 (Chr.7: 32.72–34.26 Mb). Middle: TAD boundaries and genome browser tracks of gene expression and ATAC-seq signals. Bottom: gene structures in the genomic region. The dashed line boxes indicate the chromosomal locations of the genes. For c, d and e, the internal line indicates the median, the box limits indicate the upper and lower quartiles and the whiskers extend to 1.5 IQR from the quartiles. P values in d and e were calculated using two-sided Wilcoxon rank-sum test. Source data are provided as a Source Data file.
Fig. 5
Fig. 5. Interaction dynamics in consensus TADs during folliculogenesis in chicken GCs.
a D-scores of consensus TADs located in the A and B compartments at each stage. b Expression levels of genes in consensus TADs (n = 1831) with a relatively low, medium, or high D-score. c Expression changes in genes with significantly increased, decreased, or stable D-scores between adjacent stages. d A representative TAD with differential D-scores during folliculogenesis. Top: Hi-C contact heatmaps of the genomic region containing CDH2 (Chr.2: 104.58–106.10 Mb). D-score values of the TADs were marked. Middle: TAD boundaries and genome browser tracks of PC1 values, ATAC-seq signals, and gene expression levels. Bottom: gene structures in the genomic region. The dashed line boxes indicate the chromosomal locations of the genes (red). For a, b, and c, the internal line indicates the median, the box limits indicate the upper and lower quartiles and the whiskers extend to 1.5 IQR from the quartiles. P-values in a were calculated using one-sided Student’s t test. P values in b and c were calculated using two-sided Wilcoxon rank-sum test. Source data are provided as a Source Data file.
Fig. 6
Fig. 6. Promoter-enhancer interactions (PEIs) rewired in chicken granulosa cells during folliculogenesis.
a Genes with higher regulatory potential scores (RPSs) show elevated expression levels. The genes are divided into six groups based on their RPS values (five quintiles of non-zero values and RPS equals zero). b Significant differences observed in expression levels of the genes with increased, decreased, or stable RPS values between adjacent stages. P values were calculated using two-sided Wilcoxon rank-sum test. c K-means clustering of the genes with RPS changes during folliculogenesis (k = 6). The proportions of genes interacting with super-enhancers (SEs), regular enhancers (REs), and poised enhancers (PEs) are displayed on the right. d The most enriched GO-BP terms for genes with high RPS at a specific stage. e PEI rewiring of a functional gene FDX1 (red) during folliculogenesis. Top: schematics of PEIs and Hi-C contact heatmaps of the genomic region containing FDX1 (Chr.1: 180.47–181.09 Mb). The light blue line indicates loop domains, while black arrowheads indicate CTCF motif orientation at loop anchors. Middle: genome browser tracks of ATAC-seq signals, H3K27ac signals, and gene expression levels. Bottom: gene structures in the region. The dashed line boxes indicate the chromosomal locations of the genes. For panels a and b, the internal line indicates the median, the box limits indicate the upper and lower quartiles and the whiskers extend to 1.5 IQR from the quartiles. Source data are provided as a Source Data file.

Similar articles

Cited by

References

    1. Li R, Albertini DF. The road to maturation: somatic cell interaction and self-organization of the mammalian oocyte. Nat. Rev. Mol. Cell Biol. 2013;14:141–152. - PubMed
    1. Albertini DF. Regulation of meiotic maturation in the mammalian oocyte: Inteplay between exogenous cues and the microtubule cytoskeleton. Bioessays. 1992;14:97–103. - PubMed
    1. Gilchrist RB, Ritter LJ, Armstrong DT. Oocyte–somatic cell interactions during follicle development in mammals. Anim. Reprod. Sci. 2004;82:431–446. - PubMed
    1. Zhu G, et al. Differential expression of CTGF in pre- and post-ovulatory granulosa cells in the hen ovary is regulated by TGFβ1 and gonadotrophins. Gen. Comp. Endocrinol. 2012;178:314–322. - PubMed
    1. Chen Q, et al. Transcriptomic and proteomic analyses of ovarian follicles reveal the role of VLDLR in chicken follicle selection. BMC Genomics. 2020;21:486. - PMC - PubMed

Publication types

MeSH terms