. 2022 Jan 10;13(1):161.
doi: 10.1038/s41467-021-27837-w.

Scn1a gene reactivation after symptom onset rescues pathological phenotypes in a mouse model of Dravet syndrome

Affiliations

Scn1a gene reactivation after symptom onset rescues pathological phenotypes in a mouse model of Dravet syndrome

Nicholas Valassina et al. Nat Commun. .

Abstract

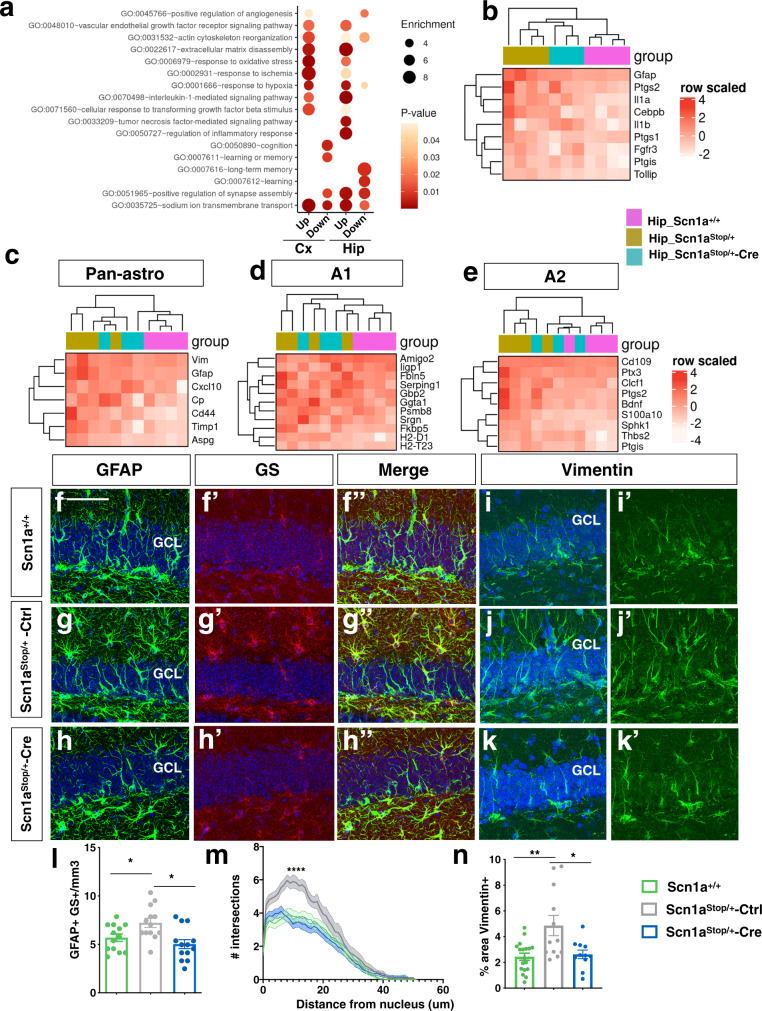
Dravet syndrome is a severe epileptic encephalopathy caused primarily by haploinsufficiency of the SCN1A gene. Repetitive seizures can lead to endurable and untreatable neurological deficits. Whether this severe pathology is reversible after symptom onset remains unknown. To address this question, we generated a Scn1a conditional knock-in mouse model (Scn1a Stop/+) in which Scn1a expression can be re-activated on-demand during the mouse lifetime. Scn1a gene disruption leads to the development of seizures, often associated with sudden unexpected death in epilepsy (SUDEP) and behavioral alterations including hyperactivity, social interaction deficits and cognitive impairment starting from the second/third week of age. However, we showed that Scn1a gene re-activation when symptoms were already manifested (P30) led to a complete rescue of both spontaneous and thermic inducible seizures, marked amelioration of behavioral abnormalities and normalization of hippocampal fast-spiking interneuron firing. We also identified dramatic gene expression alterations, including those associated with astrogliosis in Dravet syndrome mice, that, accordingly, were rescued by Scn1a gene expression normalization at P30. Interestingly, regaining of Nav1.1 physiological level rescued seizures also in adult Dravet syndrome mice (P90) after months of repetitive attacks. Overall, these findings represent a solid proof-of-concept highlighting that disease phenotype reversibility can be achieved when Scn1a gene activity is efficiently reconstituted in brain cells.


Conflict of interest statement

The authors declare no competing interests.

Figures

Fig. 1
Fig. 1. Characterization of a Scn1a knock-in mice carrying a floxed STOP cassette between exon 6 and exon 7.
a Schematic representation of the wild-type Scn1a allele, the knock-in allele containing the STOP cassette and the recombined allele after Cre-mediated removal of the STOP cassette. Grey boxes represent Scn1a exons and violet triangles LoxP sites. Primers for genotyping PCR are shown. b Genomic PCR products for genotyping Scn1a+/+, Scn1aStop/+, Scn1aStop/Stop, and Scn1aRec/+ c Body weight curves (from P7 to P42) of Scn1a+/+, Scn1aStop/+, and Scn1aRec/+ and Scn1aStop/Stop, mice (n = 8 each group, two-way ANOVA with Tukey’s multiple comparison ****p < 0.0001 for genotype effect). d Survival of Scn1aStop/+ (n = 12), Scn1aRec/+ (n = 11) and Scn1aStop/Stop (n = 8) mice monitored out to 90 days for survival, (****p < 0.0001; Log-rank Mantel-Cox test). e qRT-PCR on RNA extracted from cerebral cortex to determine Scn1a transcript level in Scn1a+/+ (n = 18), Scn1aStop/+ (n = 14) and Scn1aRec/+ n = 20) and Scn1aStop/Stop (n = 6) mice with primers tagging exon 1 (**p = 0.0026; ***p = 0.0007; ****p < 0.0001) and exon 7 (**p = 0.0044; ****p < 0.0001, Kruskal-Wallis followed by Dunn’s multiple comparisons test). f Western blot of membrane-enriched protein extracts prepared from cerebral cortex at 6 weeks of age (P14 for Scn1aStop/Stop) to evaluate Nav1.1 protein content. Calnexin was used as normalizer. g Densitometric quantification of Nav1.1 immunoreactive bands normalized to Calnexin in western blots of Scn1a+/+ (n = 15), Scn1aStop/+ (n = 13) and Scn1aRec/+ (n = 11) and Scn1aStop/Stop (n = 2) adult mouse cerebral cortices (****p < 0.0001 one-way ANOVA followed by Tukey’s multiple comparison). Data are shown as mean ± SEM; where present, dots represent individual samples. Source data are provided as a Source Data file.
Fig. 2
Fig. 2. Perinatal normalization of Nav1.1 level prevents SUDEP and seizures in DS model.
a Schematic representation of the experimental timeline, with Scn1aStop//+ mice undergoing PHP.eB-Ctrl or Cre facial vein injection at P1, followed by survival monitoring and seizure thermal induction at P120. Created with BioRender.com b Survival curve of Scn1aStop/+ -Ctrl (n = 13) and Scn1aStop//+ -Cre (n = 9) mice (*p = 0.0108, Log-rank Mantel-Cox test). c Plot showing the percentage of seizure-free Scn1aStop/+ -Cre mice compared to Scn1aStop/+ -Ctrl mice (n = 7 for each group, ****p < 0.0001; Mantel-Cox log-rank test). d Viral copy number analysis in mice injected with PHP.eB-Cre in the cerebral cortex and liver. e, f Western blot analyses of Nav1.1 protein in the cortex, hippocampus, cerebellum and striatum in Scn1a+/+, Scn1aStop/+-Ctrl and Scn1aStop/+-Cre mice and their relative band densitometry quantification normalized on calnexin, (****p < 0.0001,***p = 0.0002, **p = 0.006, one-way ANOVA with Tukey’s multiple comparison). Data are represented as mean ± SEM with dots representing individual samples. Source data are provided as a Source Data file.
Fig. 3
Fig. 3. Re-expression of Scn1a gene after symptoms onset rescues seizures in DS mice.
a Schematics depicting the experimental timeline, with Scn1aStop/+ mice undergoing PHP.eB-Ctrl or PHP.eB-Cre tail vein injection at P30, followed by EEG transmitter implantation at P45, two weeks of EEG recordings and, seizure thermal induction at P60. Created with BioRender.com. b Survival of Scn1aStop/+ (n = 23), Scn1aStop/+ -Cre (n = 11) monitored out to 90 days (**p = 0.0018; Log-rank Mantel-Cox test). c Raster plot showing all generalized tonic-clonic seizures (Racine scale stages 4 and 5) in 8 Scn1aStop/+-Ctrl injected mice and 9 Scn1aStop/+-Cre mice subjected to video-EEG recordings. d Pie chart (right panel) showing the proportion of Ctrl- and PHP.eB-Cre-injected Scn1aStop/+ mice with or without spontaneous seizures (p = 0.0004; Fisher’s exact test). e Cumulative seizure number (left), average daily seizure frequency in two weeks of recordings (middle) and average seizure duration (right), in Scn1aStop/+ -Ctrl (n = 8) and -Cre (n = 9) injected mice. (****p < 0.0001, two-tailed unpaired test). Data are shown as mean ± SEM, with dots representing individual mice. f Left, schematic of electrode placement in left (L) and right (R) cortical hemispheres for EEG recordings (from bregma AP -1; ML ± 1). Right, Representative traces of EEG recordings of Scn1aStop/+ -Ctrl injected during an ictal episode and Scn1aStop/+ -Cre injected. g Percentage of Scn1aStop/+ -Ctrl and Scn1aStop/+ -Cre mice remaining seizure-free after thermal induction (left) (n = 8 Scn1aStop/+-Ctrl and n = 9 for for Scn1aStop/+ -Cre (****p < 0.0001; Mantel-Cox log-rank test). h Pie charts showing the percentage of Scn1aStop/+-Ctrl and for Scn1aStop/+ -Cre mice with or without induced thermal seizures (p = 0.0004; two-sided Fisher’s exact test). Source data are provided as a Source Data file.
Fig. 4
Fig. 4. Re-expression of Scn1a gene after symptom onset rescues altered interactions with environment and social impairment in Dravet mice.
a Scheme of the open field arena (b) distance traveled (**p = 0.0041, *p = 0.0134, one way-ANOVA followed by Tukey’s multiple comparisons). c Velocity (**p = 0.0048, *p = 0.016, one way-ANOVA followed by Tukey’s multiple comparisons). d Percentage of time spent in home (two way-ANOVA). e Scheme of the arena with a novel object in the center. f Percentage of time spent in home, transition and exploration areas after that a novel object has been placed in the center of the arena; (*p < 0.05, **p = 0.006, ****p < 0.0001, two way-ANOVA followed by Tukey’s multiple comparisons). g Time spent sniffing the novel object (**p < 0.005, one way-ANOVA with Tukey’s). n = 19 for Scn1a+/+, n = 20 for Scn1aStop/+-Ctrl and n = 15 for Scn1aStop/+ -Cre for open field test. h Scheme of the three chamber test. i Time spent in zone1 and zone 2 chambers when an unfamiliar mouse is placed in zone 1 chamber (****p < 0.0001, two-way ANOVA followed by Tukey’s multiple comparisons). j Sniffing. k Sociability index. (**p = 0.0010, one-way ANOVA followed by Tukey’s multiple comparisons). Data are shown as mean ± SEM, with dots representing individual mice, n = 18 for Scn1a+/+, n = 18 for Scn1aStop/+-Ctrl and n = 15 for Scn1aStop/+ -Cre for three-chamber test. Source data are provided as a Source Data file. a, e, h, j were Created with BioRender.com.
Fig. 5
Fig. 5. Restoration of Nav1.1 expression after symptom onset rescues cognitive impairment in DS mice.
a Radial maze test. Scheme of the eight-arm radial maze test. b Plot of total number of entries in radial maze arms; 1–2 days: Scn1aStop/+ vs. Scn1a+/+ and vs. Scn1aStop/+;Cre ****p < 0.0001; 3–4 days: Scn1aStop/+ vs. Scn1a+/+ *p = 0.025; 5–6 days: Scn1aStop/+ vs. Scn1a+/+, ***p = 0.0006; 9–10 days: Scn1aStop/+ vs. Scn1a+/+ *p = 0.0334. c Plot of percentage of errors (entries in arms already visited) on total visits; (1–2 days: Scn1aStop/+ vs. Scn1a+/+ **p = 0.024 and vs. Scn1aStop/+-Cre ***p = 0.0005; 3–4 days: Scn1aStop/+ vs. Scn1a+/+ ***p = 0.0004 and vs. Scn1aStop/+-Cre *p = 0.049; 5–6 days: Scn1aStop/+ vs. Scn1a+/+, ****p < 0.0001 and Scn1a+/+ vs. Scn1afloxSTOP/+;**p = 0.0092; 7–8 days: Scn1aStop/+ vs. Scn1a+/+ ****p < 0.0001 and vs. Scn1aStop/+-Cre **p = 0.0083; 9–10 days: Scn1aStop/+ vs. Scn1a+/+ ****p < 0.0001 and vs. Scn1aStop/+-Cre *p = 0.0177. d Plot of the number of consecutive correct arm choices; 5–6 days: Scn1aStop/+vs Scn1a+/+ *** p = 0.0002; 7–8 days: Scn1aStop/+vs. Scn1a+/+ *** p = 0.0003, Scn1aStop/+ vs. Scn1aStop/+-Cre ***p = 0.0008; 9–10 days: Scn1aStop/+ vs. Scn1a+/+ ***p = 0.0001, Scn1aStop/+ vs. Scn1aStop/+-Cre **p = 0.0065. e Two-way ANOVA with Sidak’s multiple comparisons Scn1a+/+ n = 19 Scn1aStop/+ n = 17; Scn1aStop/+-Cre n = 15). f Water maze test. Scheme of the acquisition and reversal phase of the test. Escape latency during acquisition and reversal phases of the test, two way ANOVA p = 0.0017 followed by Bonferroni/ Dunn multiple comparison Scn1aStop/+vs. Scn1a+/+ p = 0.016; Scn1aStop/+-Cre vs. Scn1aStop/+p = 0.0018; Scn1aStop/+-Cre vs. Scn1a+/+ p = 0.8449 g Percentage of mice classified according to their predominant search strategy of the platform during the acquisition, two way ANOVA followed by Turkey’s multiple comparison WH: Scn1aStop/+ vs. Scn1a+/+ ***p = 0.0005; Scn1aStop/+-Cre vs Scn1aStop/+ **p = 0.005; SP: Scn1aStop/+ vs. Scn1a+/+ ****p < 0.0001; Scn1aStop/+-Cre vs. Scn1aStop/+ *p = 0.014. h Reversal phase SP: Scn1aStop/+ vs. Scn1a+/+ ***p = 0.003; Scn1aStop/+-Cre vs. Scn1aStop/+ **p = 0.0018, Scn1a+/+ n = 8, Scn1aStop/+ n = 8, Scn1aStop/+-Cre n = 7. CR Circling, FL Floating, WH Wall hugging, RN Random swimming, SC Scanning, CH Chaining, FC Focal searching, SP Direct swims. Source data are provided as a Source Data file. ae were Created with BioRender.com.
Fig. 6
Fig. 6. FS and non-FS interneuron activity after Nav1.1 re-expression.
a Timeline for patch-clamp recording experiments. Scn1aStop/+ mice were injected with either PHP.eB-Ctrl or PHP.eB-Cre at P30 and patched between P45 and P55. b Scheme of CA1 where GAD67-GFP + neurons were patched. c Representative traces of fast-spiking interneurons in CA1 of Scn1a+/+, Scn1aStop/+ -Ctrl and Scn1aStop/+-Cre mice in response to 800pA 500 ms current step. d Average firing rates in response to different current steps for FS GAD67-GFP + neurons in CA1 of the three experimental groups. (n = 7 for Scn1a+/+ 4 animals, n = 10 for Scn1aStop/+ -Ctrl 6 animals and n = 12 for Scn1aStop/+-Cre 5 animals, **p = 0. 0060, Two-way ANOVA;). e Maximal firing rate extrapolated from I/O curve, (*p = 0.0474, **p = 0.0021, one-way ANOVA, with Tukey’s post hoc comparison). f Current threshold, (*p = 0.0246, One-way ANOVA, with Tukey’s post hoc comparison). g Representative traces from non -FS Gad67-GFP+ interneurons in CA1 of Scn1a+/+, Scn1aStop/+ -Ctrl and Scn1aStop/+-Cre in response to 200 pA current step. h Average firing rates in response to different current steps for non-FS GAD67-GFP + interneurons in CA1 of the three experimental groups (n = 18 for Scn1a+/+ 4 animals, n = 30 6 animals for Scn1aStop/+ -Ctrl and n = 32 for Scn1aStop/+-Cre 5 animals, (***p = 0.0008, two-way ANOVA repeated measures with Tukey’s post hoc comparison). i Maximal AP frequency of non -FS GAD67-GFP + interneurons (one-way ANOVA with Tukey’s post hoc comparison). j Current threshold of non-FS GAD67-GFP + interneurons. *p = 0.0336, **p = 0.0066, one-way ANOVA, with Bonferroni post hoc comparison). kk’ Representatives IPSCs recorded from CA1 pyramidal neurons and relative magnifications. l IPSC frequency (n = 28 for Scn1a+/+ 6 mice, n = 21 for Scn1aStop/+ -Ctrl 4 mice and n = 26 for Scn1aStop/+-Cre 4 mice) (*p = 0.0115, One-way ANOVA, with Tukey’s post hoc comparison). m IPSC amplitude (n = 28 for Scn1a+/+ 6 mice, n = 21 for Scn1aStop/+ -Ctrl 4 mice and n = 26 for Scn1aStop/+-Cre 4 mice) (*p = 0.0483, One-way ANOVA, with Tukey’s post hoc comparison). Data shown are means ± SEM for d and h; for box plot in e, f, i, j, l and m each dot represent mean values from each cell, central lines median value and box limits represent 25% and 75% percentiles, while whiskers minimal and max values. Source data are provided as a Source Data file.
Fig. 7
Fig. 7. DS mouse brain astrocytosis is recovered upon Nav1.1 restoration.
a Main canonical pathways identified by IPA that are differentially expressed between Scn1a+/+ and Scn1aStop/+ mice. b Heatmaps showing the different level of expression of selected genes related to neuroinflammation in Scn1a+/+, Scn1aStop/+ -Ctrl and Scn1aStop/+-Cre mouse hippocampi. c Heatmaps showing the different level of expression of makers of pan-astrocytosis. d A1 type reactive astrocytes, e A2 type reactive astrocytes in the 3 experimental groups. fh Representative images of immunofluorescence for GFAP and GS in DG Scn1a+/+, Scn1aStop/+ and Scn1aStop/+ -Cre mouse hippocampi. i–k Representative images of immunofluorescence for Vimentin (Vim) in DG of Scn1a+/+, Scn1aStop/+ -Ctrl and Scn1aStop/+ -Cre mouse hippocampi. l Quantification of GFAP + /GS + cells (*p < 0.05, One-way ANOVA followed by Bonferroni’s post-test, 13 brain sections for each group, 2 mice for genotype). m Sholl analysis of GFAP + /GS + cells (****p < 0.0001, two-way ANOVA, n of cells = 15 for each group, 2 mice for genotype). n Percentage of CA1 area positive for Vimentin staining, (**p = 0.0019, *p = 0.01, one-way ANOVA followed by Tukey’s post-test, brain sections n = 18 for Scn1a+/+, n = 12 for Scn1aStop/+ and n = 11 for Scn1aStop/+ -Cre, 2 mice for each genotype). Scale bars, 50 μm. Data are means ± SEM. Source data are provided as a Source Data file.
Fig. 8
Fig. 8. Re-expression of Scn1a gene in adult mice (P90) rescues seizures in DS mice.
a Schematics depicting the experimental timeline: Scn1aStop/+ mice were implanted with EEG transmitters at P70 and, few days after were video-EEG recorded for 2 weeks (baseline). Mice that experienced at least one seizure over the 2 weeks of recordings were randomized and were administrated with either PHP.eB-Cre or PHP.eB-Ctrl through tail vein injections at P90. Thereafter, video-EEG continued for further 25 days, until mice reached postnatal day 115. Created with BioRender.com. b Raster plot showing all generalized tonic-clonic seizures (Racine scale stages 4 and 5) in 6 Scn1aStop/+-Ctrl injected mice and 6 Scn1aStop/+-Cre mice c Pie chart showing the proportion of Ctrl- and -Cre-injected Scn1aStop/+ mice with an increased or decreased number of seizures compared to baseline after viral delivery (p = 0.0152; two-sided Fisher’s exact test). d Seizure frequency during the baseline period and after viral injection in both Ctrl- and Cre-injected Scn1aStop/+ mice. Seizure frequency in the baseline between the two groups (*p = 0.235, t-test). Seizure frequency before and after viral administration in Scn1aStop/+-Ctrl (p = 0.53, two-way ANOVA with Sidak’s multiple comparison, n = 6) and Scn1aStop/+-Cre; *p = 0.028, two-way ANOVA with Sidak’s multiple comparison, n = 6), e Percentage of Scn1aStop/+-Ctrl and Scn1aStop/+-Cre mice remaining seizure-free after thermal induction (n = 6 for each group, ***p = 0.0002; Mantel-Cox log-rank test). f Pie charts showing the percentage of Scn1aStop/+-Ctrl and for Scn1aStop/+ -Cre mice with or without induced thermal seizures (p = 0.0152; two-sided Fisher’s exact test). Source data are provided as a Source Data file.

Comment in

  • Open the Window for the Cure of Dravet.
    Gu B. Gu B. Epilepsy Curr. 2022 Apr 21;22(4):241-243. doi: 10.1177/15357597221097876. eCollection 2022 Jul-Aug. Epilepsy Curr. 2022. PMID: 36187141 Free PMC article. No abstract available.

References

    1. Brunklaus A, Ellis R, Reavey E, Semsarian C, Zuberi SM. Genotype phenotype associations across the voltage-gated sodium channel family. J. Med. Genet. 2014;51:650–658. - PubMed
    1. Catterall WA. Dravet syndrome: A sodium channel interneuronopathy. Curr. Opin. Physiol. 2018;2:42–50. - PMC - PubMed
    1. Hudry E, Vandenberghe LH. Therapeutic AAV gene transfer to the nervous system: A clinical reality. Neuron. 2019;101:839–862. - PMC - PubMed
    1. Deverman BE, Ravina BM, Bankiewicz KS, Paul SM, Sah DWY. Gene therapy for neurological disorders: Progress and prospects. Nat. Rev. Drug Discov. 2018;17:641–659. - PubMed
    1. Hsiao J, et al. Upregulation of haploinsufficient gene expression in the brain by targeting a long non-coding RNA improves seizure phenotype in a model of dravet syndrome. EBioMedicine. 2016;9:257–277. - PMC - PubMed

Publication types

MeSH terms

Substances