

Scalable mapping of myelin and neuron density in the human brain with micrometer resolution
- PMID: 35013441
- PMCID: PMC8748995
- DOI: 10.1038/s41598-021-04093-y
Scalable mapping of myelin and neuron density in the human brain with micrometer resolution
Abstract
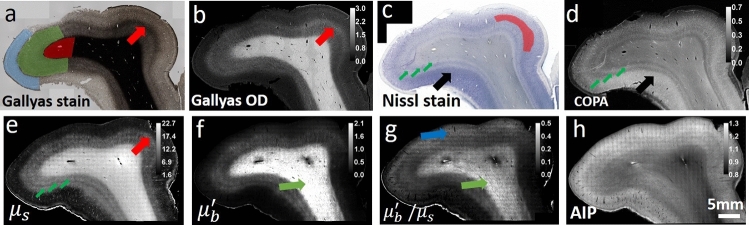
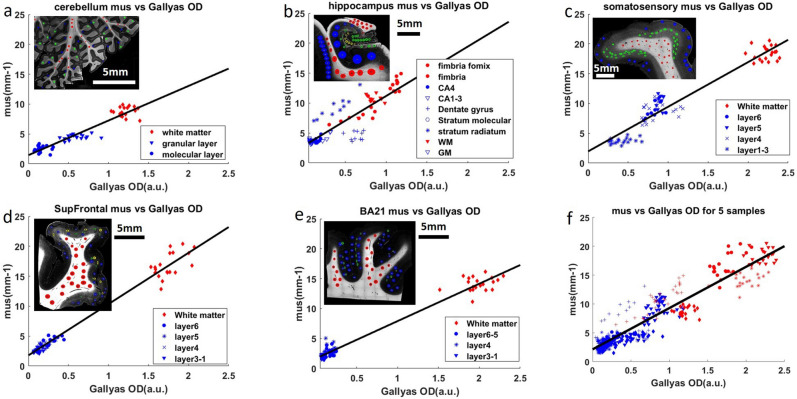
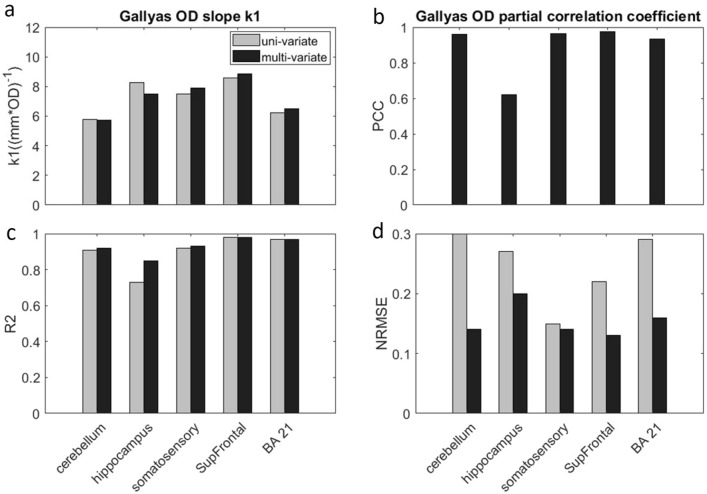
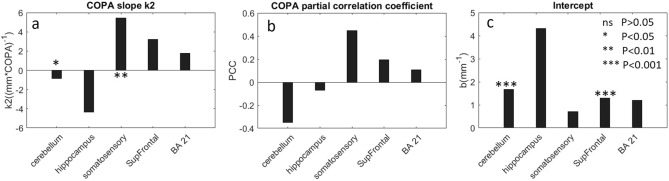
Optical coherence tomography (OCT) is an emerging 3D imaging technique that allows quantification of intrinsic optical properties such as scattering coefficient and back-scattering coefficient, and has proved useful in distinguishing delicate microstructures in the human brain. The origins of scattering in brain tissues are contributed by the myelin content, neuron size and density primarily; however, no quantitative relationships between them have been reported, which hampers the use of OCT in fundamental studies of architectonic areas in the human brain and the pathological evaluations of diseases. Here, we built a generalized linear model based on Mie scattering theory that quantitatively links tissue scattering to myelin content and neuron density in the human brain. We report a strong linear relationship between scattering coefficient and the myelin content that is retained across different regions of the brain. Neuronal cell body turns out to be a secondary contribution to the overall scattering. The optical property of OCT provides a label-free solution for quantifying volumetric myelin content and neuron cells in the human brain.
© 2022. The Author(s).
Conflict of interest statement
Bruce Fischl has a financial interest in CorticoMetrics, a company whose medical pursuits focus on brain imaging and measurement technologies. BF's interests were reviewed and are managed by Massachusetts General Hospital and Partners HealthCare in accordance with their conflict of interest policies.
Figures
References
-
- Tootell RBH, Hadjikhani N. Where is ‘Dorsal V4’ in human visual cortex? Retinotopic, topographic and functional evidence. Cereb. Cortex. 2001;11:298–311. - PubMed
-
- Stüber C, et al. Myelin and iron concentration in the human brain: A quantitative study of MRI contrast. Neuroimage. 2014;93:95–106. - PubMed
-
- Laule C, et al. Myelin water imaging of multiple sclerosis at 7 T: Correlations with histopathology. Neuroimage. 2008;40:1575–1580. - PubMed
Publication types
MeSH terms
Grants and funding
- U01MH117023/NH/NIH HHS/United States
- U01 MH093765/MH/NIMH NIH HHS/United States
- R01 AG016495/AG/NIA NIH HHS/United States
- R01AG016495/AG/NIA NIH HHS/United States
- RF1 MH121885/MH/NIMH NIH HHS/United States
- R00 EB023993/EB/NIBIB NIH HHS/United States
- S10 RR023401/RR/NCRR NIH HHS/United States
- R01 MH123195/MH/NIMH NIH HHS/United States
- S10 RR019307/RR/NCRR NIH HHS/United States
- R01 NS105820/NS/NINDS NIH HHS/United States
- 5R01AG008122/AG/NIA NIH HHS/United States
- R01 AG057672/AG/NIA NIH HHS/United States
- 1R56AG064027/AG/NIA NIH HHS/United States
- P41 EB030006/EB/NIBIB NIH HHS/United States
- U01 MH117023/MH/NIMH NIH HHS/United States
- 1R01AG064027/AG/NIA NIH HHS/United States
- S10 RR023043/RR/NCRR NIH HHS/United States
- R01 MH121885/MH/NIMH NIH HHS/United States
LinkOut - more resources
Full Text Sources
