. 2022 Jan 10;5(1):11.
doi: 10.1038/s42003-021-02957-7.

Disrupted stepwise functional brain organization in overweight individuals

Affiliations

Disrupted stepwise functional brain organization in overweight individuals

Hyebin Lee et al. Commun Biol. .

Abstract

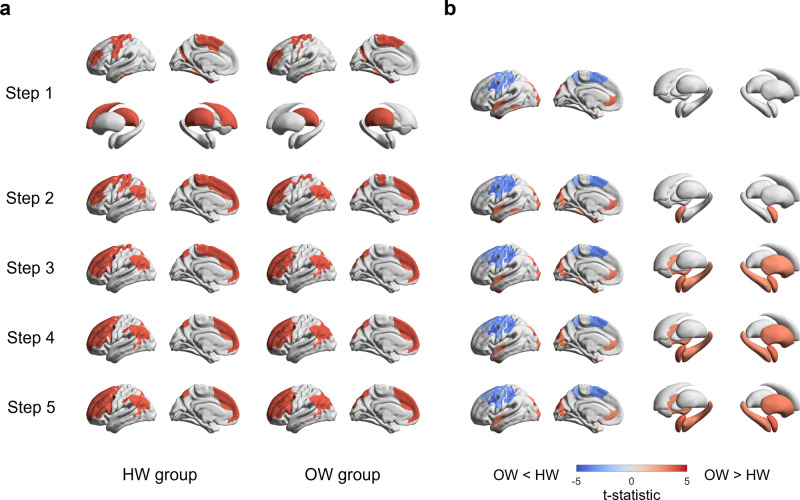
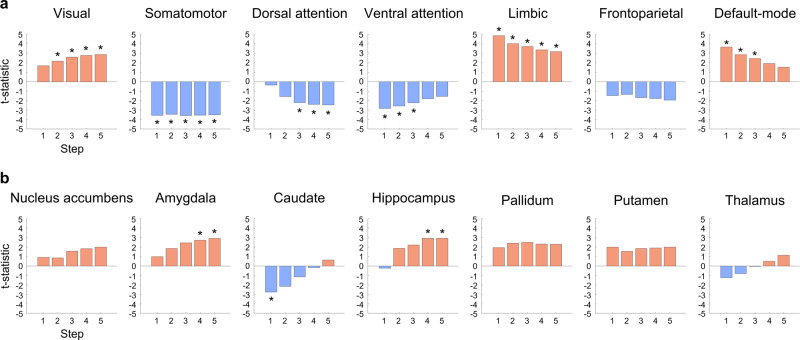
Functional hierarchy establishes core axes of the brain, and overweight individuals show alterations in the networks anchored on these axes, particularly in those involved in sensory and cognitive control systems. However, quantitative assessments of hierarchical brain organization in overweight individuals are lacking. Capitalizing stepwise functional connectivity analysis, we assess altered functional connectivity in overweight individuals relative to healthy weight controls along the brain hierarchy. Seeding from the brain regions associated with obesity phenotypes, we conduct stepwise connectivity analysis at different step distances and compare functional degrees between the groups. We find strong functional connectivity in the somatomotor and prefrontal cortices in both groups, and both converge to transmodal systems, including frontoparietal and default-mode networks, as the number of steps increased. Conversely, compared with the healthy weight group, overweight individuals show a marked decrease in functional degree in somatosensory and attention networks across the steps, whereas visual and limbic networks show an increasing trend. Associating functional degree with eating behaviors, we observe negative associations between functional degrees in sensory networks and hunger and disinhibition-related behaviors. Our findings suggest that overweight individuals show disrupted functional network organization along the hierarchical axis of the brain and these results provide insights for behavioral associations.


Conflict of interest statement

The authors declare no competing interests.

Figures

Fig. 1
Fig. 1. Flowchart of the study.
a The T1-weighted MRI and rs-fMRI data were preprocessed. b (top) We calculated partial correlations of mean time series between different brain regions defined using Brainnetome atlas, (bottom) and calculated degree centrality to assess association to waist-to-hip ratio (WHR). The regions that showed significant associations were selected as seed regions for stepwise functional connectivity (SFC) analysis. c (top) The SFC analysis was performed using binarized connectivity matrix from steps one to five, and (bottom) degree centrality was calculated for each step. Abbreviations: rs-fMRI resting-state functional magnetic resonance imaging, BOLD blood-oxygen-level-dependent.
Fig. 2
Fig. 2. Brain regions associated with obesity phenotype.
a Correlation coefficient of the identified regions that showed significant association with waist-to-hip ratio (WHR) are reported on brain surfaces and subcortical structures using 301 participants. Red/blue indicate positive/negative correlations. The correlation coefficients are stratified based on b functional communities as well as c subcortical regions.
Fig. 3
Fig. 3. Stepwise functional connectivity in healthy weight (HW) and overweight (OW) groups.
a Hub regions from step distance one to five for each group (n = 104 for HW; n = 75 for OW) are reported on brain surfaces. Hub regions in subcortical areas were detected only in the first step. b We reported the t-statistics of brain regions that showed significant between-group differences in degree centrality between individuals with HW and OW. Regions with red show a higher degree in OW group compared to individuals with HW, and blue regions, vice versa.
Fig. 4
Fig. 4. Between-group differences in degree centrality values.
We stratified effects of between-group differences in degree centrality values according to a functional communities and b subcortical regions. Positive (red) values indicate higher degrees in OW group, whereas negative (blue) values indicate lower degrees. The t-statistics with significant between-group differences are marked with asterisks.

Similar articles

Cited by

References

    1. James WPT. The epidemiology of obesity: The size of the problem. J. Intern. Med. 2008;263:336–352. - PubMed
    1. Raji CA, et al. Brain structure and obesity. Hum. Brain Mapp. 2010;31:353–364. - PMC - PubMed
    1. Malik VS, Willett WC, Hu FB. Global obesity: Trends, risk factors and policy implications. Nat. Rev. Endocrinol. 2013;9:13–27. - PubMed
    1. Blüher M. Obesity: global epidemiology and pathogenesis. Nat. Rev. Endocrinol. 2019;15:288–298. - PubMed
    1. Vainik U, Dagher A, Dubé L, Fellows LK. Neurobehavioural correlates of body mass index and eating behaviours in adults: A systematic review. Neurosci. Biobehav. Rev. 2013;37:279–299. - PMC - PubMed

Publication types