. 2022 Jan;24(1):62-73.
doi: 10.1038/s41556-021-00807-6. Epub 2022 Jan 10.

The ubiquitin-dependent ATPase p97 removes cytotoxic trapped PARP1 from chromatin

Affiliations

The ubiquitin-dependent ATPase p97 removes cytotoxic trapped PARP1 from chromatin

Dragomir B Krastev et al. Nat Cell Biol. 2022 Jan.

Abstract

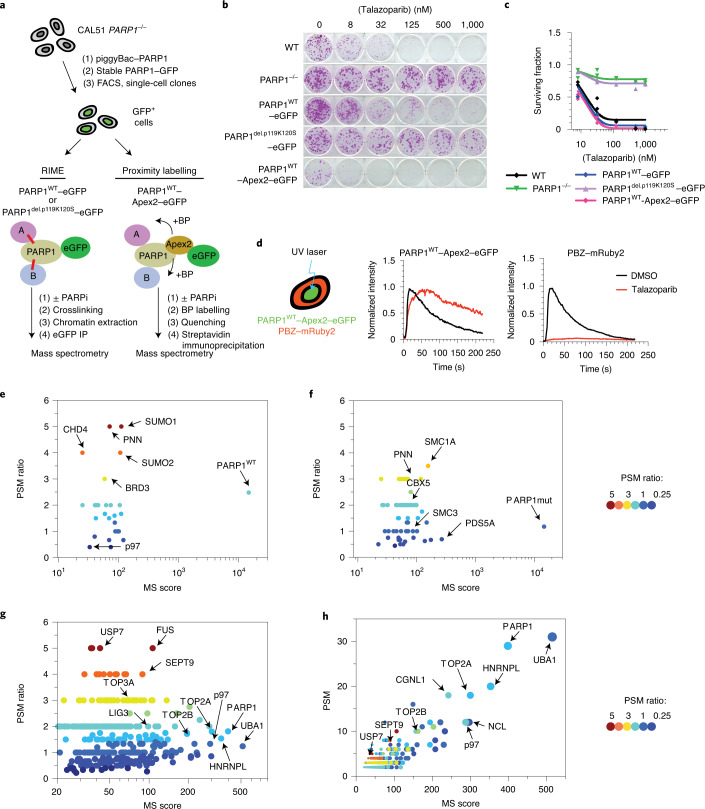
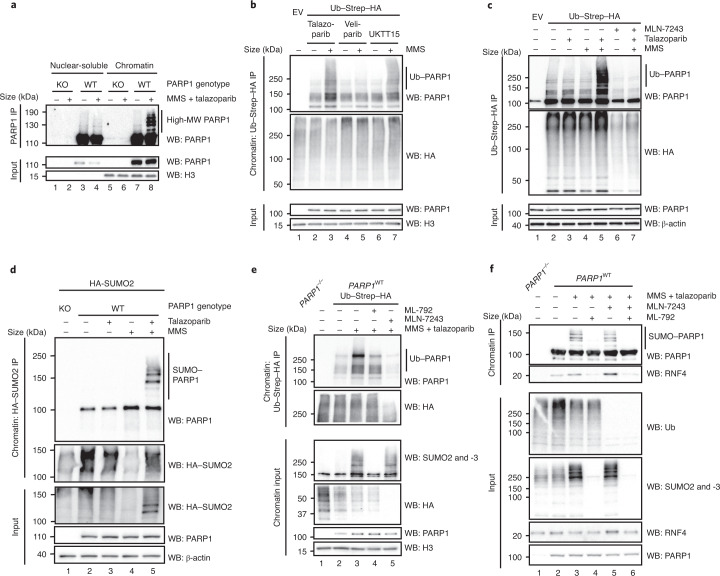
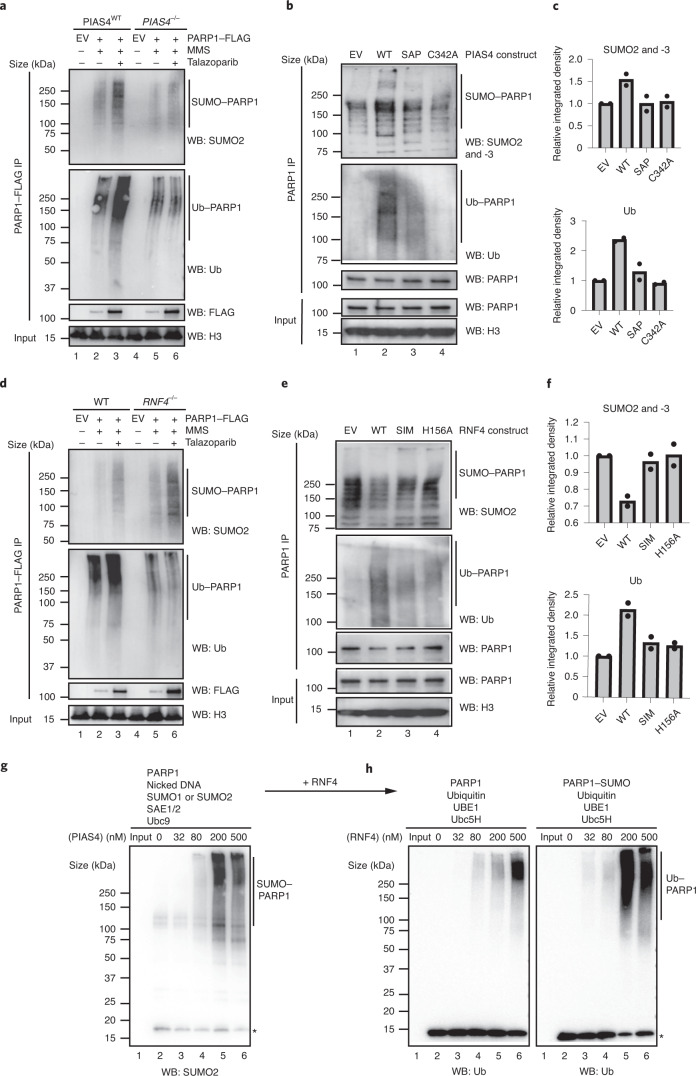
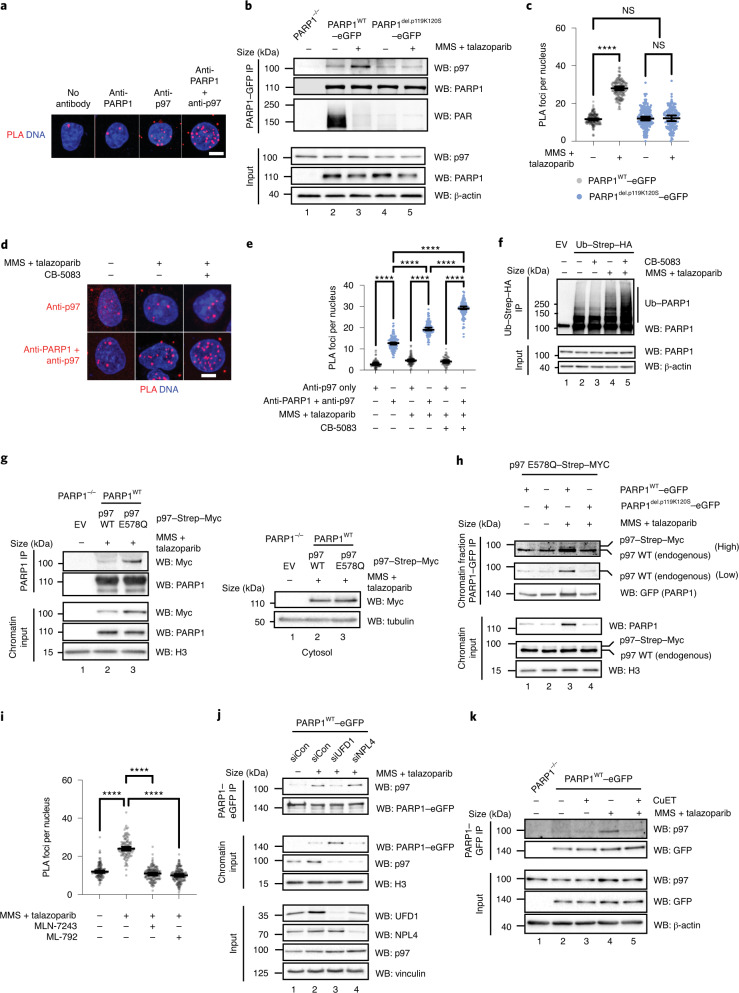
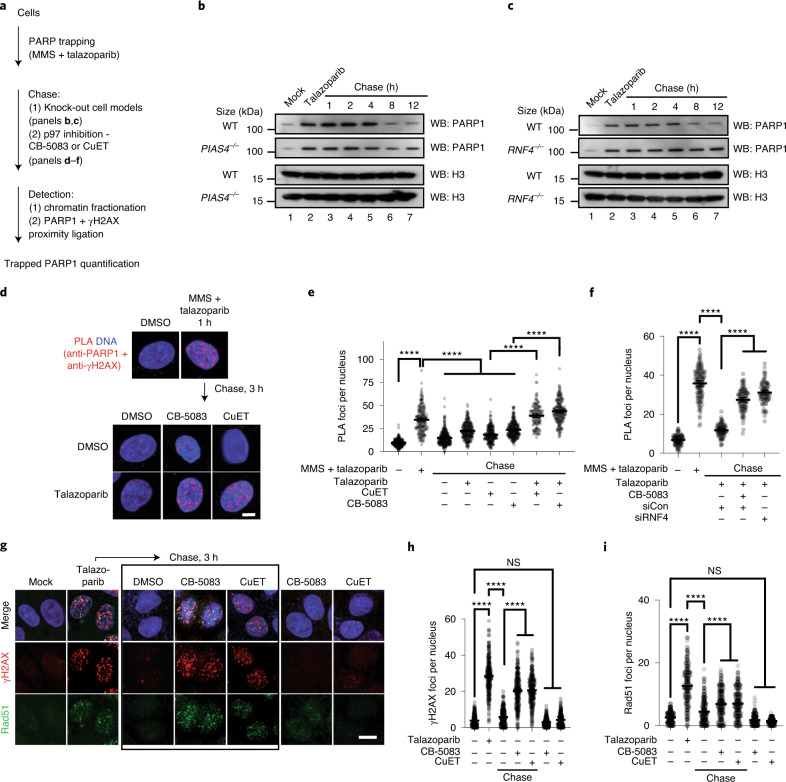
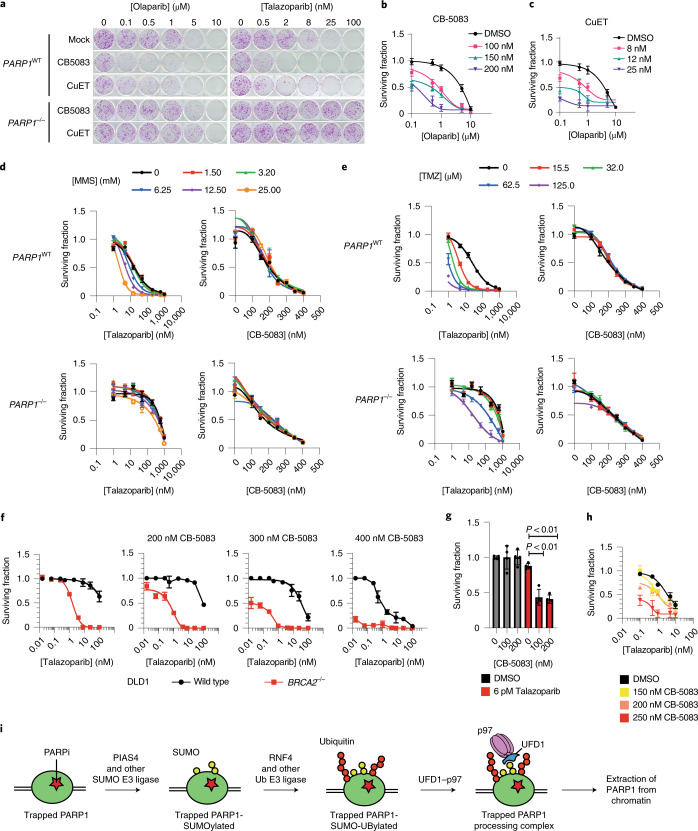
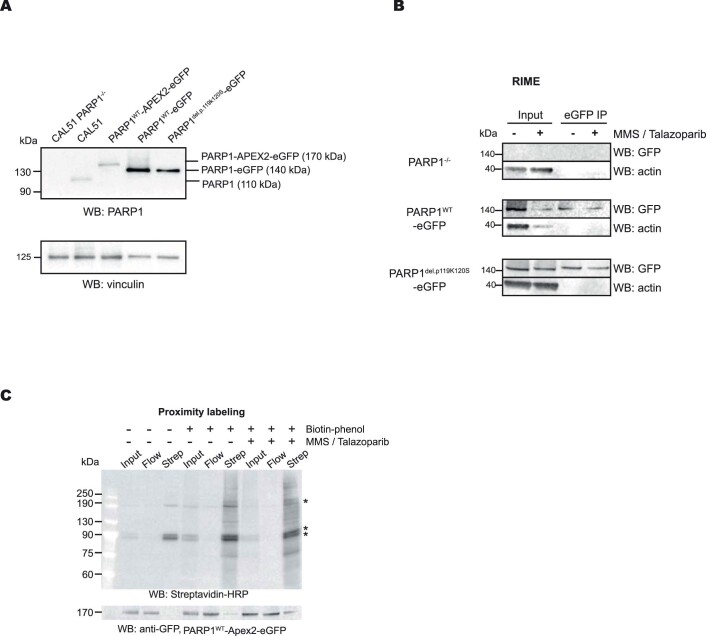
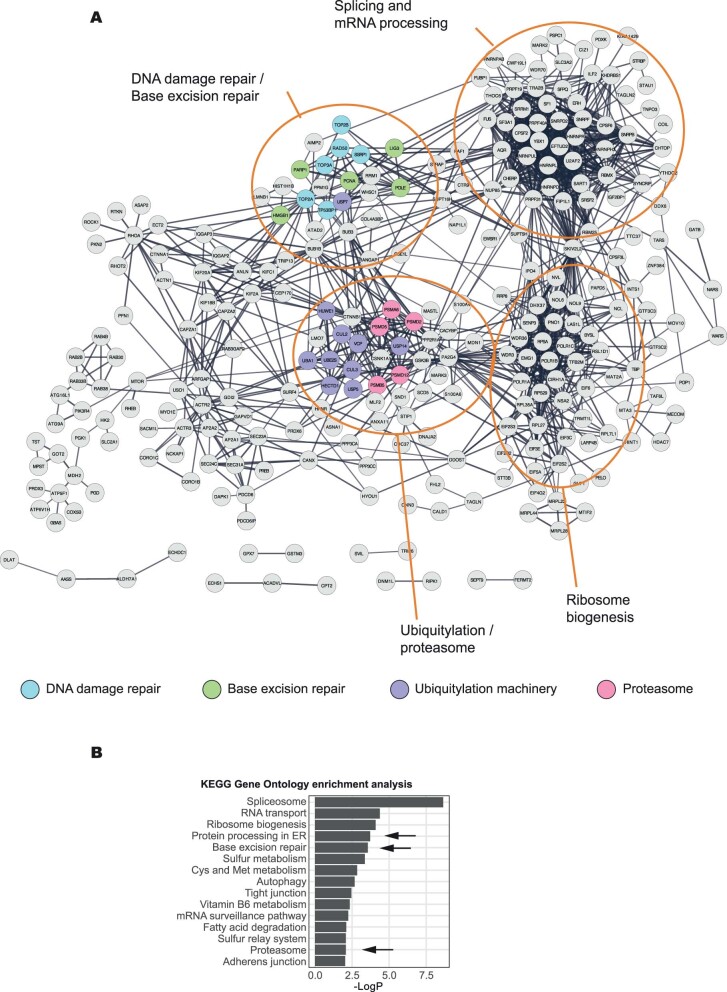
Poly (ADP-ribose) polymerase (PARP) inhibitors elicit antitumour activity in homologous recombination-defective cancers by trapping PARP1 in a chromatin-bound state. How cells process trapped PARP1 remains unclear. Using wild-type and a trapping-deficient PARP1 mutant combined with rapid immunoprecipitation mass spectrometry of endogenous proteins and Apex2 proximity labelling, we delineated mass spectrometry-based interactomes of trapped and non-trapped PARP1. These analyses identified an interaction between trapped PARP1 and the ubiquitin-regulated p97 ATPase/segregase. We found that following trapping, PARP1 is SUMOylated by PIAS4 and subsequently ubiquitylated by the SUMO-targeted E3 ubiquitin ligase RNF4, events that promote recruitment of p97 and removal of trapped PARP1 from chromatin. Small-molecule p97-complex inhibitors, including a metabolite of the clinically used drug disulfiram (CuET), prolonged PARP1 trapping and enhanced PARP inhibitor-induced cytotoxicity in homologous recombination-defective tumour cells and patient-derived tumour organoids. Together, these results suggest that p97 ATPase plays a key role in the processing of trapped PARP1 and the response of tumour cells to PARP inhibitors.


Conflict of interest statement

T.T.T. is a co-founder of Hysplex, LLC, with interests in PARPi development. C.J.L. makes the following disclosures: is/has been a consultant for AstraZeneca, Merck KGaA, Artios, Syncona, Sun Pharma, Gerson Lehrman Group, Vertex, Tango, 3rd Rock, Ono Pharma, Dark Blue Therapeutics, Horizon Discovery and Abingworth; has received grant/research support from AstraZeneca, Artios and Merck KGaA; is a stockholder in Tango and Ovibio; and stands to gain from the use of PARP and other DNA-repair inhibitors as part of the Institute of Cancer Research ‘rewards to inventors’ scheme. A.N.J.T. is/has been a consultant for AstraZeneca, Merck KGaA, Artios, Pfizer, Vertex, GE Healthcare, Inbiomotion and MD Anderson Cancer Centre; has received grant/research support from AstraZeneca, Myriad, Medivation and Merck KGaA; is a stockholder in Inbiomotion; and stands to gain from the use of PARPi as part of the Institute of Cancer Research ‘rewards to inventors’ scheme. The remaining authors declare no competing interests.

Figures

Fig. 1
Fig. 1. Identification of trapped PARP1-interacting proteins.
a, Schematic describing the identification of trapped PARP1 protein–protein interactomes via RIME or proximity labelling linked to mass spectrometry. The cells were exposed to either PARPi + MMS (to enable trapping) or MMS (no trapping) for 1 h, after which PARP1-interacting/proximal proteins were identified by mass spectrometry analysis. BP, biotin-phenol. b, Clonogenic assay illustrating the restoration of PARPi sensitivity in the complemented PARP1–/– CAL51 cells as described in a. PARP1 protein expression in the different clones is shown in Extended Data Fig. 1a. c, Quantification of the colony formation assay shown in b; data are the mean of two biological replicates. d, PARP1WT–Apex2–eGFP protein localizes to sites of DNA damage, generates PAR and can be trapped by PARPi. Cells expressing PARP1WT–Apex2–eGFP were transfected with a PAR sensor, a PBZ PAR-binding domain fused to mRuby2 (left). PARP1WT–Apex2–eGFP and PBZ–mRuby2 accumulate at the sites of UV micro-irradiation. Exposure to 100 nM talazoparib causes sustained accumulation of PARP1WT–Apex2–eGFP (middle) but abolishes PAR production (right). Data represent two independent experiments with similar results. DMSO, dimethylsulfoxide. e,f, PARP1 interactions that are enriched under PARP1-trapping conditions (as defined by the PSM ratio ((talazoparib + MMS) ÷ MMS) and MS scores). Scatter plots are shown for PARP1WT–eGFP (e) and PARP1del.p.119K120S–eGFP (f) RIME. g, PARP1 interactions that are enriched under PARP1-trapping conditions for PARP1WT–Apex2–eGFP proximity labelling. RIME and proximity labelling were performed in three independent experiments. h, A graph plotting the PSM against MS score for PARP1WT–Apex2–eGFP proximity labelling interactions shows that p97 is among the most abundant proteins identified in the PARP1WT–Apex2–eGFP proximity labelling. Source data
Fig. 2
Fig. 2. Trapped PARP1 is SUMOylated and ubiquitylated.
a, PARP1-trapping conditions elicit high-molecular-weight forms of PARP1 in the chromatin fraction. PARP1−/− (KO) and PARP1WT HEK293 cells were exposed to PARP1 trapping (MMS + talazoparib) and fractionated into nuclear-soluble and chromatin-bound fractions. High-molecular-weight (MW) forms of PARP1 are more prevalent in the chromatin fraction after trapping (lane 8). b, PARP1 trapping leads to PARP1 ubiquitylation. HEK293 cells were transfected with an Ub–Strep–HA-expressing construct and exposed to 0.01% MMS, 100 nM talazoparib, 10 μM veliparib or 10 μM UKTT15. Chromatin fractions were prepared in denaturing conditions, ubiquitylated proteins were immunoprecipitated and the presence of PARP1 was detected. c, As in b, HEK293 cells were transfected with an Ub–Strep–HA-expressing construct and exposed to combinations of MMS, talazoparib or 5 μM MLN-7243. The presence of high-molecular-weight ubiquitin forms of PARP1 were reduced by MLN-7243 exposure (lane 7 versus lane 5). The input controls for these experiments are shown in Extended Data Fig. 3a. b,c, EV, empty vector. d, Trapped PARP1 is SUMOylated. HEK293 PARP1WT and PARP1−/− cells were transfected with a HA–SUMO2-expressing construct and subsequently treated with 0.01% MMS or 100 nM talazoparib. The HA–SUMO2-modified proteins were purified from the chromatin fraction and PARP1 was detected via immunoblotting. High-exposure blots of PARP1 SUMOylation are shown in Extended Data Fig. 3b. e, SUMOylation and ubiquitylation inhibitors prevent trapped PARP1 modification. Similarly to c, the ubiquitylated pool of proteins was immunoprecipitated from the chromatin fraction of cells exposed to MLN-7243 (5 μM) or ML-792 (1 μM) and the presence of high-molecular-weight PARP1 isoforms was identified by immunoblotting. f, PARP1 is modified and interacts with RNF4 in a SUMO-dependent manner. PARP1WT and PARP1–/– HEK293 cells were exposed to trapping conditions in the presence of either 5 μM MLN-7243 or 1 μM ML-792 and PARP1 was immunoprecipitated under native conditions using PARP1-Trap beads. Western blotting for PARP1 revealed that modified PARP1 isoforms were abrogated by exposure to ML-792 but not MLN-7243. Abrogation of SUMOylation prevented the association between PARP1 and RNF4, whereas inhibition of ubiquitylation stabilized the interaction. Data represent two biological replicates. IP, immunoprecipitation; and WB, western blot. Source data
Fig. 3
Fig. 3. Trapped PARP1 is modified in a PIAS4- and RNF4-dependent manner.
a, PARP1 is SUMOylated in a PIAS4-dependent manner in vivo. Wild-type and PIAS4–/– HCT116 cells were transfected with FLAG–PARP1-expressing plasmid, exposed to trapping and the chromatin-bound PARP1 was investigated for SUMOylation and ubiquitylation. The levels of SUMO1 (Extended Data Fig. 4a), SUMO2 and ubiquitin were reduced in the PIAS4–/– cells (see Extended Data Fig. 4b,c for the total ubiquitin input and quantification of the blots, respectively). b, PIAS4–/– HCT116 cells were transfected with different PIAS4-expressing constructs for 48 h, followed by 30 min talazoparib (10 µM) treatment in the presence of 0.01% MMS and PARP1 immunoprecipitation. c, Abundance of SUMO2 and -3 (top)- and ubiquitin (bottom)-modified PARP1 in b. b,c, Data represent two biological replicates. SAP, PIAS4 with deleted SAP domain; and C342A, catalytic dead PIAS4. d, Similarly to a, trapped PARP1 was purified from the chromatin fraction of wild-type and RNF4–/– MCF7 cells. The PARP1 ubiquitylation levels were reduced in the RNF4–/– cells, whereas SUMO1- (Extended Data Fig. 4e) and SUMO2-ylation were increased (see Extended Data Fig. 4f,g for the total ubiquitin input and quantification of the blots). e, RNF4–/– MCF7 cells were transfected with different RNF4-expressing plasmids for 48 h and processed as in b. f, Abundance of SUMO2 and -3 (top)- and ubiquitin (bottom)-modified PARP1 in e. e,f, Data represent two biological replicates. SIM, RNF4 with deleted SUMO-interacting motif; and H156A, catalytic dead RNF4. g, PIAS4 mediates PARP1 SUMOylation in vitro. Recombinant PARP1 was incubated with nicked DNA, SUMO1 or SUMO2, SAE1 and -2, Ubc9 and an increasing concentration of PIAS4. PIAS4 led to a concentration-dependent increase of SUMOylation (Extended Data Fig. 5c). *Free SUMO2. h, RNF4 mediates PARP1 ubiquitylation in a SUMO-dependent manner in vitro. PARP1 SUMOylation reactions were supplemented with ubiquitin, UBE1, Ubc5H and an increasing concentration of RNF4. SUMOylated PARP1 was a better substrate for ubiquitylation. *Free ubiquitin. a,d,g,h, Data shown represent two independent experiments with similar results. EV, empty vector; IP, immunoprecipitation; WB, western blot; and WT, wild type. Source data
Fig. 4
Fig. 4. PARP1 interacts with p97 in a trapping-dependent manner.
a, Images of a PLA for endogenous PARP1 and p97 in CAL51 cells. b, The PARP1–p97 interaction is increased following DNA damage. CAL51 cells expressing PARP1WT–eGFP or PARP1del.pK119S120–eGFP were exposed to trapping conditions and PARP1–GFP was immunoprecipitated under native conditions. Data represent two biological replicates. c, PARP1–p97 PLA (anti-PARP1 and anti-p97) in CAL51 cells expressing either PARP1WT–eGFP or PARP1del.pK119S120–eGFP. The geometric mean and 95% confidence interval (CI) are shown; n = 2,016 cells from three independent experiments. d, PARP1–p97 PLA in CAL51 cells under trapping. PLA with p97 antibody alone (top) or p97 + PARP1 antibody (bottom). a,d, Scale bars, 5 μm. Data represent three biological replicates. e, Number of PLA foci in d. The geometric mean and 95% CI are shown; n = 2,035 cells from three independent experiments. f, Inhibition of p97 increases the presence of ubiquitylated PARP1. HEK293 cells expressing Ub–Strep–HA were cultured in PARP1-trapping conditions in the presence or absence of 10 μM CB-5083 and the ubiquitylated proteins were immunoprecipitated under denaturing conditions (see Extended Data Fig. 6c for the input controls). Data represent three biological replicates. g, HEK293 cells expressing either wild-type p97–Myc or p97 p.E578Q–Myc were transfected with a FLAG–PARP1 construct, exposed to trapping conditions and PARP1 immunoprecipitated from the chromatin fraction. Data represent two biological replicates. h, CAL51 cells expressing PARP1WT–eGFP or PARP1del.p.119K120S–eGFP were transfected with p97 E578Q–Strep–Myc for 18 h, exposed to trapping conditions and then fractionated. The chromatin PARP1–eGFP immunoprecipitate was probed by antibody that detected both endogenous and ectopically expressed p97. Data represent two biological replicates. i, PARP1–p97 co-localization is reduced by ubiquitylation (5 μM MLN-7243) or SUMOylation (1 μM ML-792) inhibitors. Number of PARP1–p97 PLA (anti-PARP1 and anti-p97) foci. The geometric mean and 95% CI are shown; n = 1,316 cells from three independent experiments. c,e,i, ****P < 0.0001; NS, not significant; ordinary one-way analysis of variance (ANOVA). j, The p97 adaptor UFD1 mediates the interaction between p97 and trapped PARP1. Chromatin-bound co-immunoprecipitation. Data represent three biological replicates; siCon, control short interfering RNA (siRNA); siUFD1, siRNA to UFD1; and siNPL4, siRNA to NPL4. k, As per j, the PARP1–p97 interaction is disrupted by the p97 sequestration agent, CuET. Data represent two biological replicates. EV, empty vector; IP, immunoprecipitation; WB, western blot; and WT, wild type. Source data
Fig. 5
Fig. 5. PARP trapping is modulated by the PIAS4–RNF4–P97 axis.
a, Schematic of the trap–chase experiment. b, Trapped PARP1 is processed in a PIAS4-dependent manner. Trap–chase experiment in wild-type and PIAS4–/– HCT116 cells. After PARP1 trapping, cells were chased in talazoparib-containing media. Samples were collected at the indicated time points for chromatin fractionation and western blotting. c, Trapped PARP1 is processed in a RNF4-dependent manner. Trap–chase experiment in wild-type and RNF4–/– MCF7 cells as in b. b,c, Data represent two biological replicates. WB, western blot; and WT, wild type. d, Representative confocal microscopy images from a PARP1–γH2AX PLA trap–chase experiment. e, PARP1–γH2AX PLA foci persist in cells chased in PARPi plus p97 inhibitors. Number of PARP1–γH2AX PLA (anti-PARP1 + anti-γH2AX) foci in the trap–chase experiment in d; n = 5,736 cells from three independent experiments. f, PARP1–γH2AX PLA foci persist in cells with RNF4 silencing. Number of PLA foci in n = 1,235 cells from three independent experiments; siCon, control siRNA; and siRNF4, siRNA to RNF4. g, PARPi-induced RAD51 and γH2AX foci persist in the presence of p97 inhibitors. Representative confocal microscopy images from a trap–chase experiment (trap, talazoparib overnight; chase, p97 inhibitor-containing media) are shown for each condition. The cells were stained for the presence of γH2AX and RAD51 foci. Black box represents cells that were chased after talazoparib treatment, in contrast to the last two columns, which were not pre-treated with talazoparib. d,g, Scale bars, 5 μm. DMSO, dimethylsulfoxide. h,i, Number of γH2AX (h) and RAD51 foci (i) from the experiment in g; n = 1,750 cells from three independent experiments. e,f,h,i, The geometric mean and 95% CI are shown. ****P < 0.0001; NS, not significant; ordinary one-way ANOVA. Source data
Fig. 6
Fig. 6. Inhibition of p97 potentiates the effect of PARPi.
a, Inhibition of p97 potentiates the cytotoxicity of PARPi. CAL51 cells were exposed to PARPi (talazoparib (left) or olaparib (right)) in the presence of a p97 inhibitor (CB-5083 or CuET) for a period of 14 d. Images are shown for samples exposed to 100 nM CB-5083 and 8 nM CuET. b,c, Drug-response curves for CB-5083 (b) and CuET (c). See also Extended Data Fig. 9a,b. d,e, DNA alkylating agents that are used to induce PARP1 trapping do not enhance the cell-inhibitory effects of CB-5083. PARP1WT and PARP1–/– CAL51 cells were exposed to the alkylating agents MMS (d) or temozolomide (TMZ; e) in combination with either talazoparib (positive control) or CB-5083 for 7 d, after which the cell viability was measured. f, CB-5083 modulates the synthetic lethal effect of PARPi in BRCA2–/– cells. Survival curves from clonogenic survival assays in BRCA2WT and BRCA2–/– DLD1 cells treated with different doses of CB-5083 and talazoparib. Colony formation images and quantification are shown in Extended Data Fig. 9e. g, Inhibition of p97 sensitizes mouse cancer organoid cells to PARPi. WB1P breast cancer organoids with Brca1 and p53 loss-of-function mutations were cultured in the presence of the indicated drugs for 7 d. Bright-field images of organoids are shown in Extended Data Fig. 9f. h, Inhibition of p97 sensitizes a human BRCA1-mutant patient-derived breast cancer organoid to PARPi. KCL014BCPO organoids were cultured in the indicated drugs for 7 d. Bright-field images of the organoids are shown in Extended Data Fig. 9g. bh, Data are the mean ± s.d. of three biological replicates. i, Model of the processing of trapped PARP1. PARP1 trapped by the presence of PARPi on DNA is processed in a stepwise manner. It is initially SUMOylated in a PIAS4-dependant manner and subsequently ubiquitylated in an RNF4-dependent manner. p97 is recruited to the ubiquitin chains and binds via UFD1 and the ATPase activity of p97 extracts the modified PARP1 from the chromatin. DMSO, dimethylsulfoxide. Source data
Extended Data Fig. 1
Extended Data Fig. 1. Proteomic profiling of PARP1 transgene-expressing CAL51 cells.
a. Western blot showing the expression of PARP1 transgenes, detected by an PARP1 antibody. Data shown represent 2 biological replicas. b. A Western blot analysis of the purified PARP1-associated proteins as described in the RIME experiment in Fig. 1a. Data shown represent 3 biological replicas. c. Western blot analysis of the purified biotinylated proteins isolated in the PARP1WT-Apex2-eGFP proximity labelling experiment. Immunoblotting using Streptavadin-HRP is shown in the top panel, whilst anti-GFP immunoblotting is shown in the bottom panel. Endogenously biotinylated proteins are indicated as*. Data shown represent 3 biological replicas. Source data
Extended Data Fig. 2
Extended Data Fig. 2. Bioinformatic analysis of trapped PARP1 proteomic data.
a. STRING network diagram of proteins identified by PARP1 proximity labelling under PARPi trapping conditions (as described in Methods). The graph shows connected nodes identified with a high stringency threshold of 0.7 (non-connected proteins are excluded from this visualisation). The colour coding corresponds to the following functional annotation: DNA damage repair-associated proteins (blue), base excision repair (green), ubiquitylation machinery (purple) and proteasome (magenta). Clusters, enriched for certain biological processes are indicated (for example ‘Ubiquitylation/proteosome’). b. Summary of gene set ontology analysis of the networks presented in (F). KEGG terms enriched at p-value <0.01 are shown. Source data
Extended Data Fig. 3
Extended Data Fig. 3. Trapped PARP1 is SUMOylated and ubiquitinated.
a. Input controls for Fig. 2c, showing the efficacy of MLN-7243 to inhibit ubiquitylation. Data shown represent 3 biological replicas. b. Reciprocal denaturing IP over PARP1-FLAG showed accumulation of trapped PARP1 ubiquitination in HEK293s. HEK293 cells were transfected with PARP1-FLAG-expressing construct for 24 hours then treated with 100 nM talazoparib/0.01% MMS and/or 10 µM CB-5083. Cells were lysed, chromatin was digested and then incubated with anti-FLAG beads. 4% of sample was harvested for input pre-incubation. Data shown represent 2 biological replicas. c. As in (C), but the immunoprecipitated proteins were analysed with an anti-K48 Ub chains recognising antibody. This experiment has been performed once. d. High exposure blot of PARP1 SUMOylation from Fig. 2d, red arrows show SUMOylated PARP1 in MMS treated samples. Data shown represent 2 biological replicas. Source data
Extended Data Fig. 4
Extended Data Fig. 4. Trapped PARP1 is modified in a PIAS4-dependent manner.
a. PARP1 SUMOylation by SUMO1 was detected as described in Fig. 3a. Data shown represent 2 biological replicas. b. Western blotting for total ubiquitin input for Fig. 3a. Data shown represent 2 biological replicas. c. A quantification of the SUMO2/3ylated and ubiquitylated PARP1 isoforms in the gels in Fig. 3a. d. PARP1 SUMOylation by SUMO1 detected as described in Fig. 3b. Data shown represent 2 biological replicas. e. PARP1 SUMOylation by SUMO1 was detected as described in Fig. 3d. n = 1 biological replicas. f. Western blotting for total ubiquitin input for Fig. 3d. Data shown represent 2 biological replicas. g. A quantification of the SUMO2/3ylated and ubiquitylated PARP1 isoforms in the gels in Fig. 3d. h. PARP1 SUMOylation by SUMO1 detected as described in Fig. 3e. Data shown represent 2 biological replicas. Source data
Extended Data Fig. 5
Extended Data Fig. 5. Trapped PARP1 is modified in a RNF4-dependent manner.
a. Overexpression of RNF4-WT increased PARP1 ubiquitination under trapping conditions. HEK293 cells were transfected with Ubiquitin-Strep-HA in combination with either FLAG-RNF4-WT or M136S/R177A mutant (E2 binding mutant, dominant negative) expressing constructs. After treatment with MMS + Talazoparib, the cells were fractionated and ubiquitylated proteins were purified from the chromatin-bound fraction via Streptactin beads. Data shown represent 2 biological replicas. b. RNF4 depletion prevents PARP1 ubiquitination under PARP trapping conditions. Denaturing IP of UB-HA-STREP-expressing HEK293 cells, similar to Fig. 2b. Cells were depleted of RNF4 with either a 5’UTR sequence or Dharmarcon SMARTpool and were treated with 100 nM Talazoparib and 0.01% MMS. Pulldown was conducted with Streptactin beads. Data shown represent 2 biological replicas. c. In vitro SUMOylation assay as described in Fig. 3g. The reactions were incubated in the presence of SUMO1, which was subsequently detected by anti-SUMO1 antibody. The asterisk indicates the free SUMO1. Data shown represent 2 biological replicas. Source data
Extended Data Fig. 6
Extended Data Fig. 6. Trapped PARP1 interacts with p97.
a. Western blot analysis of Co-IP confirms PARP1–p97 interaction. CAL51 cells were transiently transfected with p97-WT-GFP-expressing construct. Subsequently, GFP was immunoprecipitated in native conditions and the presence of PARP1 investigated by Western blotting. Data shown represent 2 biological replicas. b. PARP1 interacts with p97 in a trapping-dependant manner. Cells were treated with 0.01% MMS in the presence of 100 nM talazoparib, 10 µM veliparib or 10 µM UKTT15. PARP1 associated proteins were immunoprecipitated and the presence of p97 was investigated by immunoblotting. Data shown represent 2 biological replicas. c. Western blots for denaturing IP experiment shown in Fig. 4f. Data shown represent 3 biological replicas. d. p97 E578Q mutant colocalises with PARP1 under trapping conditions. CAL51 PARP1WT-eGFP and PARP1del.p.119K120S-eGFP cells were transfected with p97-WT-Strep-MYC or p97 E578Q-Strep-MYC constructs and then subsequently exposed to MMS + talazoparib to induce PARP1 trapping. Cell were then pre-extracted and fixed, and stained for trapped PARP1 and MYC (as described in). The p97 E578Q-mutant colocalised with the trapped PARP1 signal in CAL51 PARP1WT-eGFP cells (yellow arrows) whereas PARP1del.p.119K120S-eGFP were unable to form trapped PARP1 foci. Scale bar = 5 µm. Data shown represent 2 biological replicas. e. Ubiquitin is required for the PARP1/p97 interaction in trapping conditions. Western blots of PARP1 co-immunoprecipitates from CAL51 PARP1WT-eGFP-expressing cells. Trapping increases the PARP1/p97 interaction (lane 4), an effect reversed by MLN-7243 (5 μM). Data shown represent 3 biological replicas. Source data
Extended Data Fig. 7
Extended Data Fig. 7. PARP1 trapping is modulated by PIAS4, RNF4 and p97.
a. Quantification of the chromatin bound PARP1 in Fig. 5b; 2 biological replicas are displayed with individual points. b. Quantification of the chromatin bound PARP1 in Fig. 5c; 2 biological replicas are displayed with individual points. c. As described in Fig. 5a, trapping was induced in cells and subsequently chased as stated. Cells were then fractionated and the amount of chromatin-bound PARP1 was investigated by Western blotting. Data shown represent 3 biological replicas. d. CAL51 PARP1WT-eGFP cells were transfected with FLAG-RNF4-WT or FLAG-RNF-M136S/R177A (E2 binding mutant, dominant negative) constructs. Treatment occurred 24 h after expression. Data shown represent 2 biological replicas. e. HeLa cells were transfected with either p97-Strep-MYC cDNA or a p97 E578Q mutant-Strep-MYC. Sixteen hours later, cells were exposed to MMS + talazoparib. Data shown represent 2 biological replicas. f. CAL51 cells expressing PARP1WT-eGFP or PARP1del.p119K120S-eGFP were transfected with p97WT-Strep-MYC or p97E578Q-Strep-MYC-expressing construct. After trapping and pre-extraction, cells were fixed and imaged. Scale bar = 5 µm. g. Graph of quantification of PARP1–eGFP foci of the experiment presented in (F). n = 80-200 cells examined over 3 biologically independent experiments, mean ± SEM, p-values derived with a Kruskal-Wallis test. h. Western blots of trapped PARP1 from CAL51 PARP1–eGFP expressing cells transfected with a control siRNA (siLuc) or UFD1-targeting siRNA (siUFD1). 72 hours post transfection, cells were treated with MMS + talazoparib. Data shown represent 3 biological replicas.
Extended Data Fig. 8
Extended Data Fig. 8. Cell cycle and ‘PARP1 exchange’ under p97 inhibition.
a. Cell cycle profiling for the experiment shown in Fig. 5i. CAL51 cells were exposed to drugs as shown. One hour prior to fixation, 10 μM EdU was added to the media. EdU was stained by a click reaction with Alexa488-azide and DNA was stained by propidium iodide. b. A quantification of the G1, S and G2 populations from (A). c, d. CAL51 PARP1WT-eGFP cells were subjected to UV-micro-irradiation, accumulation of PARP1WT-eGFP at UV-laser induced DNA damage sites was monitored in the presence of DMSO (vehicle), talazoparib, CB-5083 or in combination. At the maximum time of PARP1WT-eGFP recruitment (typically 1 min after micro-irradiation) the focus was bleached with a 488 nm laser and recovery of PARP1WT-eGFP was monitored over time as described in. e. Image montages of the micro-irradiation site for (L). Scale bar = 2 µm. l. A quantification of the FRAP described in (K). The fluorescent signal was scaled according to the maximum PARP1WT-eGFP immediately prior the photobleach to (equalling 1) and the signal immediately after photobleach (0), as in. The FRAP data was fitted with one site-specific binding model of non-linear regression and the extra sum of squares F test was used to calculate the t1/2. The significance was determined with a two-sided t-test from two independent experiments, where 10 to 12 cells were quantified for each condition. * - p-value < 0.05.
Extended Data Fig. 9
Extended Data Fig. 9. PARP inhibitors synergise with p97 inhibition.
a. and b. Bliss synergy calculation, performed with the Combenefit software (CRUK Cambridge Institute), of the drug-response curves shown in Fig. 6b, c. c. and d. Drug-response curves for the colony formation assays presented in Fig. 6a. CAL51 WT or PARP1/ cells were treated with increasing concentrations of the PARP inhibitor Olaparib in the presence of either 100 nM CB-5083 (A) or 8 nM CuET (B). Surviving fractions were calculated based on the number of colonies after 14 days of exposure to the drugs. Shown are the mean ± SD of n = 3 biological replicas. e. A quantification of the CB-5083 single agent effect on the surviving fraction of DLD1 and DLD1 BRCA2−/− cells, respectively. Shown are the mean ± SD of n = 3 biological replicas. f. Colony formation assays showing the synergistic effect between talazoparib and CB-5083 in DLD1 and DLD1 BRCA2−/− cellular models. g. Area under the curve (AUC) analysis of the surviving fractions of DLD1 and DLD1 BRCA2−/− cells in the presence of increasing concentrations CB-5083 combination as presented in Fig. 6f. Shown are the mean ± SD of n = 3 biological replicates; ordinary one-way ANOVA **** - p < 0.0001. h. Bright-field images, showing the effect of talazoparib-CB-5083 combination on the GEMM WB1P organoid as described in Fig. 6g. Scale bar = 200 µm. Data shown represent 2 biological replicas. i. Bright-field images showing the effect of talazoparib-CB-5083 combination on the KCL014BCPO organoid as described in Fig. 6h. Scale bar = 200 µm. Data shown represent 3 biological replicas.

Comment in

Similar articles

Cited by

References

    1. Lord CJ, Ashworth A. PARP inhibitors: synthetic lethality in the clinic. Science. 2017;355:1152–1158. - PMC - PubMed
    1. Murai J, et al. Trapping of PARP1 and PARP2 by clinical PARP inhibitors. Cancer Res. 2012;72:5588–5599. - PMC - PubMed
    1. Pettitt SJ, et al. Genome-wide and high-density CRISPR–Cas9 screens identify point mutations in PARP1 causing PARP inhibitor resistance. Nat. Commun. 2018;9:1849. - PMC - PubMed
    1. Zandarashvili L, et al. Structural basis for allosteric PARP-1 retention on DNA breaks. Science. 2020;368:eaax6367. - PMC - PubMed
    1. Gogola E, et al. Selective loss of PARG restores PARylation and counteracts PARP inhibitor-mediated synthetic lethality. Cancer Cell. 2018;33:1078–1093. - PubMed

Publication types

MeSH terms