. 2022 Feb;7(2):300-311.
doi: 10.1038/s41564-021-01028-1. Epub 2022 Jan 10.

Dynamic diel proteome and daytime nitrogenase activity supports buoyancy in the cyanobacterium Trichodesmium

Affiliations

Dynamic diel proteome and daytime nitrogenase activity supports buoyancy in the cyanobacterium Trichodesmium

Noelle A Held et al. Nat Microbiol. 2022 Feb.

Abstract

Cyanobacteria of the genus Trichodesmium provide about 80 Tg of fixed nitrogen to the surface ocean per year and contribute to marine biogeochemistry, including the sequestration of carbon dioxide. Trichodesmium fixes nitrogen in the daylight, despite the incompatibility of the nitrogenase enzyme with oxygen produced during photosynthesis. While the mechanisms protecting nitrogenase remain unclear, all proposed strategies require considerable resource investment. Here we identify a crucial benefit of daytime nitrogen fixation in Trichodesmium spp. that may counteract these costs. We analysed diel proteomes of cultured and field populations of Trichodesmium in comparison with the marine diazotroph Crocosphaera watsonii WH8501, which fixes nitrogen at night. Trichodesmium's proteome is extraordinarily dynamic and demonstrates simultaneous photosynthesis and nitrogen fixation, resulting in balanced particulate organic carbon and particulate organic nitrogen production. Unlike Crocosphaera, which produces large quantities of glycogen as an energy store for nitrogenase, proteomic evidence is consistent with the idea that Trichodesmium reduces the need to produce glycogen by supplying energy directly to nitrogenase via soluble ferredoxin charged by the photosynthesis protein PsaC. This minimizes ballast associated with glycogen, reducing cell density and decreasing sinking velocity, thus supporting Trichodesmium's niche as a buoyant, high-light-adapted colony forming cyanobacterium. To occupy its niche of simultaneous nitrogen fixation and photosynthesis, Trichodesmium appears to be a conspicuous consumer of iron, and has therefore developed unique iron-acquisition strategies, including the use of iron-rich dust. Particle capture by buoyant Trichodesmium colonies may increase the residence time and degradation of mineral iron in the euphotic zone. These findings describe how cellular biochemistry defines and reinforces the ecological and biogeochemical function of these keystone marine diazotrophs.


Conflict of interest statement

Competing interests

The authors declare no competing interests.

Figures
Extended Data Fig. 1.
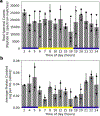
A) Average total spectral counts (peptide to spectrum matches) with error bar representing +/− one standard deviation, at each tie point for triplicate biological replicates. Each data point is also shown individually as black scatter points. Yellow and indigo bars indicate the light and dark periods, respectively. Total spectral counts were relatively uniform and do not vary systematically throughout the diel cycle, implying consistency in the proteome analyses. B) Total protein content in the culture shown with error bar representing +/− one standard deviation, for biological duplicates after protein precipitation and purification, measured by a colorimetric BSA assay. Higher protein abundances at night may suggest nighttime cell growth. Again, each data point is also shown individually as black scatter points. Yellow and indigo bars indicate the light and dark periods, respectively.
Extended Data Fig. 2.
Dynamics of the entire proteome of Trichodesmium erythraeum sp. IMS101 over the diel cycle. The dynamic range of the normalized spectral count data can be observed, as well as fluctuations in protein abundance occurring throughout the experiment.
Extended Data Fig. 3.
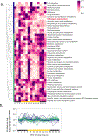
A) Clustered heatmap of a singlicate replicate diel experiment conducted one year prior to the main experiment, with the same set up and experimental conditions. Protein abundances were summed for each KO module and normalized across each row. B) Dynamics of the proteome clusters over the diel cycle, with each KO module represented as a line and colored based on the clustering in panel (A). Rapid oscillations of the proteome and clustering of the nitrogenase/nitrogen metabolism proteins with the photosystems are similar in the main experiment.
Extended Data Fig. 4.
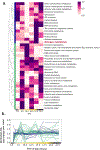
A) Clustered heatmap of the proteome of a field Trichodesmium population sampled over the diel cycle. Protein abundances were summed for each KO module and normalized across each row. B) Dynamics of the proteome clusters over the diel cycle, with each KO module represented as a line and colored based on the clustering in panel (A). Though the sampling was lower resolution than in the laboratory experiments, the rapid oscillations of the proteome are reproduced.
Extended Data Fig. 5
In vivo specific activity of the nitrogenase NifH protein (nmol ethyelene produced per min per mg NifH) over the diel cycle for Crocosphaera watsonii. Unlike in Trichodesmium which exhibits significant variability in nitrogenase activity throughout the diel cycle, in Crocosphaera nitrogenase is either not present or highly present and very active.
Extended Data Fig. 6.
POC content versus total protein spectral counts in the main laboratory experiment. These are weakly correlated suggesting that POC content is driven mainly by carbohydrate content, not protein abundance.
Extended Data Fig. 7.
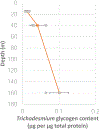
Glycogen content of Trichodesmium populations sampled in situ by depth. The populations were sampled on August 7, 2017 at 31°W 22°N in the early morning. Error bars are standard deviations of the mean value of the biological triplicates, and corresponding data points are plotted in grey circles. For each depth, n = 3 samples collected from replicate phytoplankton net sampling events, n = 2 samples for depth = 160 m.
Extended Data Fig. 8.
Glycogen content of Trichodesmium colonies sampled in situ and separated by morphology. The populations were sampled from the surface on March 10, 2018 at 65 22.420 °W 17 0.284 °N and separated by morphology at the time of picking.
Extended Data Fig. 9
Synchrotron-based element maps used to determine mass of particulate iron associated with a puff-type colony, data originally collected as in Held et al., 2020. The left image is the X-ray fluorescence-based concentration, the middle image represents pixels with sufficiently high Fe to be considered a particle, and the right image is the product of the left and middle images. The total particulate Fe was determined as the area integrated Fe of the right image. The scale bar represents 180 microns. As detailed in Held et al., 2020, five Trichodesmium colonies of differing morphologies and degrees of particle association were examined in this way. These images are representative of a Trichodesmium colony with average-to-high particle loading.
Extended Data Fig. 10.
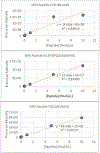
Calibration curves for 15N labeled standard peptides used for absolute quantitation of the nitrogenase proteins. Precursor ion intensities were linearly correlated with analyzed peptide concentrations between 0–10 fmol μL−1.
Figure 1.
Figure 1.
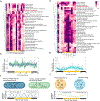
Dynamics of the Trichodesmium proteome in comparison to Crocosphaera. a. Heatmap of the T. erythraeum sp. IMS101 proteome during the diel cycle. Proteins were gathered into KO Modules, summed for each time point, averaged across the three biological replicates, then unit normalized across the row and clustered by an unweighted pair group method with arithmetic mean (UPGMA). Two clusters emerged, indicated by green and dark blue bars on the left hand side. Yellow and black bars at the bottom of the heatmap indicate the light and dark periods, and numbering is hours after midnight. See supplemental figure S1 for a version of this heatmap where the clustering algorithm was also applied to the x axis (time of day). b. The same data with the abundance of each KO module presented as line and colored based on the clustering in panel (a). c. Summary of major physiological modes emergent from the diel proteome of Trichodesmium, with colors consistent with panels (a) and (b) and including active photosynthesis/nitrogen fixation (dark blue) and inactive photosynthesis/nitrogen fixation (green). Modeled protein abundances over the diel cycle were generated by fitting sinusoidal functions to the summed protein abundances in each cluster. Blue model coefficient of determination R2 = −5.7, green model R2 = −2.9. d-f. the same but for Crocosphaera watsonii sp. WH8501, data from ref [35]. Here, the major emergent physiological modes were photosynthesizing (orange), nitrogen fixing (turquoise). Turquoise model R2 = 0.62, orange model R2 = 0.63.
Figure 2.
Figure 2.
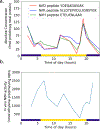
Nitrogenase concentration and activity over the diel cycle. a. Absolute abundance of each of the main nitrogenase enzyme subunit proteins, calibrated using 15N labeled standards b. in vivo specific activity rate for NifH over the diel cycle, calculated by dividing acetylene reduction/ethylene production rates (see Fig 3c) by the measured concentration of the nitrogenase enzyme. Variation in the specific activity implies post-translational control of enzymatic activity, .
Figure 3.
Figure 3.
Temporal dynamics of a. POC, b. PON, c. acetylene reduction rates, and d. the POC:PON ratio in cultured T. erythraeum over the diel cycle. e. Temporal changes in the POC:PON ratio relative to previous time point, with bars color coded based on associated changes in either POC or PON content, with the possible processes being excess C production, excess N production, excess C respiration, or excess N loss (see text). On the right, associated temporal changes in the abundance of the three nitrogenase subunits (f-h), photosystem I protein PsbC (i) and photosystem II proteins PsaB and PsaD (j-k). Each scatter point represents the average value across the biological triplicates, and shaded areas represent 90% confidence intervals for the replicates calculated by bootstrapping (n=1000). Protein abundances are normalized to their average value across the entire diel cycle.
Figure 4.
Figure 4.
a. Network of negatively correlated photosynthesis and nitrogen fixation related proteins. Edges are drawn for protein pairs with Spearman rank-order correlation coefficients < −0.8 and p values of the correlation < 0.05 . Node size and color designate relative degree of closeness centrality in the network. c-e. Examples of negative protein abundance correlations used to build the network, shown here as a function of the central protein in the network, glycogen synthesis protein GlcG. Each point represents one independent biological observation, i.e. one of the replicates at one of the diel sampling time points. Curves were fit to the general exponential function ae(−bx) + c (red lines) via least-squares regression, and constants for the best fit are provided in the legend.
Figure 5.
Figure 5.
a. The terminal velocity of phytoplankton particles of various characteristic diameters and specific gravities relative to seawater of density 1025 kg m−3 (see Table S9). Black contours indicate the value of the particle’s terminal velocity in m day−1, with negative values indicating upwards, floating velocity i.e. when the specific gravity is less than 1, and positive values indicating downwards, sinking velocity i.e. when the specific gravity is greater than 1. For a given species, cell density can differ depending on growth conditions (e.g. Prochlorococcus and SAR11, each displayed in exponential (sinking) and stationary (floating) growth). The density of the Trichodesmium particles was modelled using literature values and allowing 25% of the cell volume to be occupied by a gas vesicle, resulting in positive buoyancy. The hypothetical dark nitrogen fixation case increases the density of the Trichodesmium biomass by 60%, resulting in sinking. Arrows are used to indicate the change in terminal velocity for normal light nitrogen fixing and hypothetical dark nitrogen fixing Trichodesmium particles. For large colonies carrying dust particles, the additional mass of iron (1.03 μg Fe per 1 mm diameter colony) further exacerbates the sinking velocity. b. Glycogen content per μg total protein for Trichodesmium and Crocosphera cells over the diel cycle. Crocosphaera glycogen data from Saito et al., 2011 [35].
Figure 6.
Figure 6.
Summary of physiological properties and behaviors that are reinforced by daytime nitrogen fixation (not to scale). Trichodesmium cells, filaments, and colonies have a tendency to sink due to their large size and tendency to aggregate. Daytime nitrogen fixation minimizes glycogen ballast. Trichodesmium can also to regulate buoyancy through production of gas vesicles which confers neutral and/or positive buoyancy. Thus Trichodesmium is more likely to remain in the upper water column, where they benefit from their high-light adapted pigments, the ability to access iron from dust particles, and interactions with the epibiont community. Additionally, buoyant Trichodesmium colonies may increase the residence time of dust particles in the euphotic zone, providing more time for particle solubilization.

Comment in

  • Iron keeps Trichodesmium afloat.
    Hofer U. Hofer U. Nat Rev Microbiol. 2022 Mar;20(3):126. doi: 10.1038/s41579-022-00690-4. Nat Rev Microbiol. 2022. PMID: 35027702 No abstract available.

References

    1. Zehr JP Capone DG Changing perspectives in marine nitrogen fixation. Science 9514, 729 (2020). - PubMed
    1. Karl D et al. Dinitrogen fixation in the world’s oceans. Biogeochemistry 57–58, 47–98 (2002).
    1. Dugdale R & Wilkerson F Nutrient Limitation of New Production in the Sea. in Primary Productivity and Biogeochemical Cycles in the Sea (eds. Falkowski PG, Woodhead AD & Vivirito K) 107–122 (Springer; US, 1992). doi:10.1007/978-1-4899-0762-2_7. - DOI
    1. Carpenter EJ & Capone DG Nitrogen Fixation in the Marine Environment. in Nitrogen in the Marine Environment (Elsevier, 2008). doi:10.1016/B978-0-12-372522-6.00004-9. - DOI
    1. Gruber N, Sarmiento JL Global patterns of marine nitrogen fixation and denitrification. Global Biogeochem. Cycles 11, 23–266 (1997).

Publication types