. 2022 May;40(5):741-750.
doi: 10.1038/s41587-021-01136-7. Epub 2022 Jan 10.

Partitioning RNAs by length improves transcriptome reconstruction from short-read RNA-seq data

Affiliations

Partitioning RNAs by length improves transcriptome reconstruction from short-read RNA-seq data

Francisca Rojas Ringeling et al. Nat Biotechnol. 2022 May.

Abstract

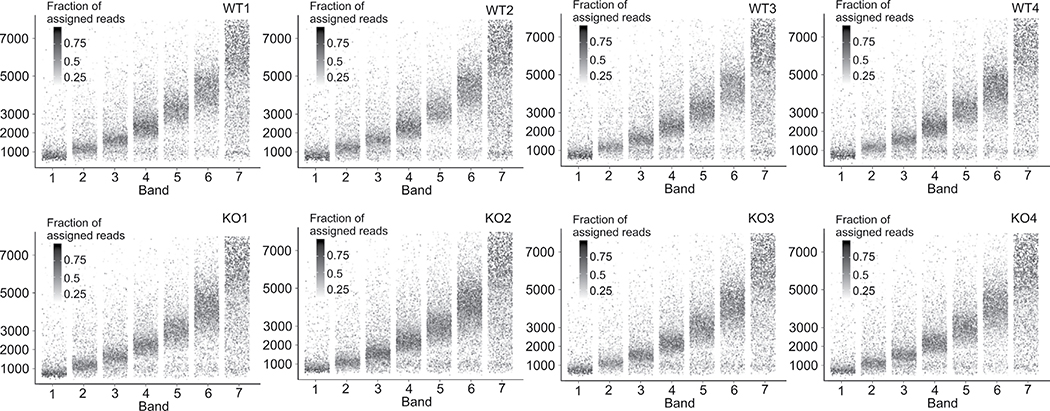
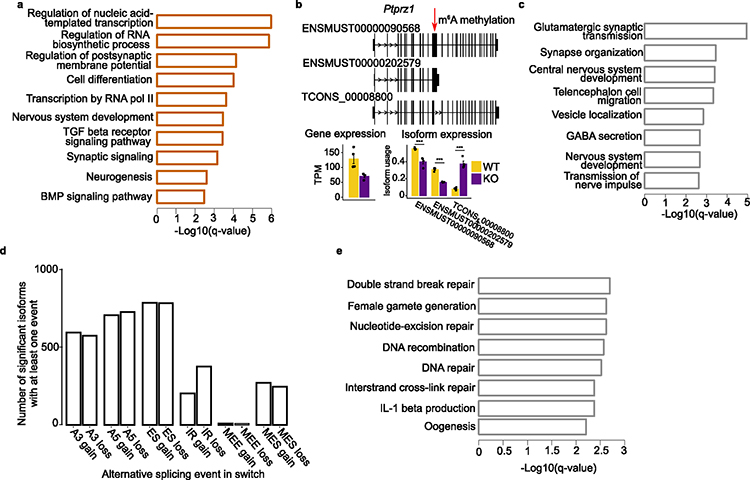
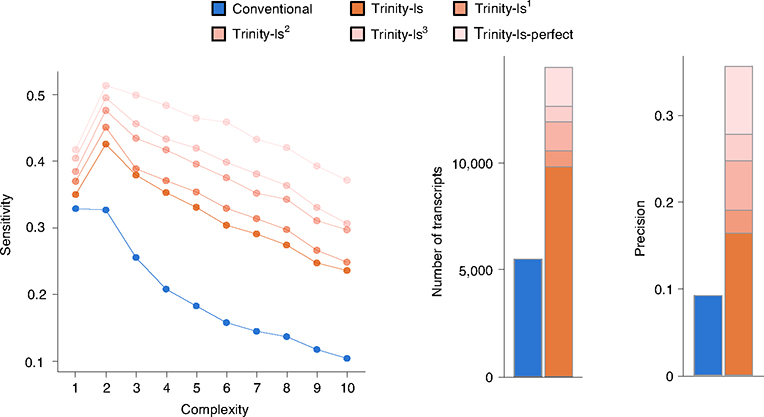
The accuracy of methods for assembling transcripts from short-read RNA sequencing data is limited by the lack of long-range information. Here we introduce Ladder-seq, an approach that separates transcripts according to their lengths before sequencing and uses the additional information to improve the quantification and assembly of transcripts. Using simulated data, we show that a kallisto algorithm extended to process Ladder-seq data quantifies transcripts of complex genes with substantially higher accuracy than conventional kallisto. For reference-based assembly, a tailored scheme based on the StringTie2 algorithm reconstructs a single transcript with 30.8% higher precision than its conventional counterpart and is more than 30% more sensitive for complex genes. For de novo assembly, a similar scheme based on the Trinity algorithm correctly assembles 78% more transcripts than conventional Trinity while improving precision by 78%. In experimental data, Ladder-seq reveals 40% more genes harboring isoform switches compared to conventional RNA sequencing and unveils widespread changes in isoform usage upon m6A depletion by Mettl14 knockout.


Conflict of interest statement

Competing interests

The authors declare no competing interests.

Figures

Extended Data Fig. 1 |
Extended Data Fig. 1 |. Reduced (effective) gene complexity in Ladder-seq.
We estimate transcript expression in Mettl14 KO sample 1 using kallisto on Ladder-seq reads pooled across bands and show the histogram of gene complexity measured as the number of expressed transcripts. In Ladder-seq, we partition the set of expressed transcripts into 7 bands and count the number of transcripts contained in each band according to their annotated length (plus 200 nt average poly(A) tail size), assuming cuts at 1000 bp, 1500 bp, 2000 bp, 3000 bp, 4000 bp and 6000 bp. The resulting histogram of effective gene complexity shows an increased fraction of gene bands with low complexity.
Extended Data Fig. 2 |
Extended Data Fig. 2 |. In silico gel for WT and Ko NPC samples.
For every annotated transcript the intensity of a point with y- coordinate equal to its annotated length (plus 200 nt average poly(A) tail size) shows the fraction of reads obtained from each band (x-axis) that can be assigned unambiguously to it. As expected, each band contains predominantly reads from transcripts of a distinct length range.
Extended Data Fig. 3 |
Extended Data Fig. 3 |. Overview of the benchmark strategy.
1. The ground truth transcriptome including abundances and error profile is calculated by RSEM from GEUVADIS sample NA12716_7. 2. Reads are simulated from the ground truth transcriptome by RSEM to obtain RNA-seq samples of different sequencing depths. 3. A matching Ladder-seq sample is obtained by separating reads in silico according to probability mass functions estimated from our NPC Ladder-seq sample (and variants thereof). 4. Transcripts are quantified and assembled by our Ladder-seq tailored transcript analysis methods kallisto-ls, StringTie-ls, and Trinity-ls from the Ladder-seq sample, while their conventional counterparts are run on the corresponding RNA-seq sample. 5. The results are compared to the ground truth to evaluate and compare their accuracy.
Extended Data Fig. 4 |
Extended Data Fig. 4 |. Quantification accuracy of kallisto-ls on 75 million simulated reads.
Mean values across 20 simulations are reported. Pearson correlation of estimated and ground truth abundance in log2 transformed transcripts per million (TPM) and mean absolute relative difference (MARD) are shown as a function of gene complexity, that is the number of transcripts expressed by a gene. For ease of visualization, we omit genes expressing a single transcript, many of which are estimated to be lowly expressed in GEUVADIS sample NA12716_7 by RSEM.
Extended Data Fig. 5 |
Extended Data Fig. 5 |. Accuracy of transcript assembly from 75 million simulated reads.
RNA-seq and Ladder-seq reads were aligned identically to the reference genome (GRCh38) using STAR. Sensitivity and precision of StringTie-ls and its conventional counterpart StringTie2 are shown as a function of gene complexity measured as the number of expressed transcripts. Sensitivity and precision are calculated with respect to the same set of ground truth transcripts as in the smaller 30 million read pairs data set.
Extended Data Fig. 6 |
Extended Data Fig. 6 |. Accuracy of de novo transcript assembly from 30 million (top row) and 75 million (bottom row) simulated reads.
(a) Sensitivity of Trinity-ls and its conventional counterpart Trinity at 90% transcript length cut-off is shown as a function of gene complexity measured as the number of expressed transcripts. (b) Total number of correctly assembled transcripts at different transcript length cut-offs. (c) Precision at different transcript length cut-offs.
Extended Data Fig. 7 |
Extended Data Fig. 7 |. Ladder-seq improves differential analysis of reconstructed transcriptomes.
(a) Computational pipeline for differential isoform usage analysis with conventional RNA-seq and Ladder-seq. Reads were aligned using STAR aligner prior to transcript assembly for both pipelines. (b) Venn diagram showing overlap between switching genes identified by Ladder-seq and conventional RNA-seq. (c and e) Isoform switches identified only by Ladder- seq in genes Exo1 and Tram1l1 (between n=4 WT and n=4 KO samples). Red arrows show location of m6A methylation. TCONS_00000541 and TCONS_00000542 are novel isoforms of Exo1 detected only by Ladder-seq. TCONS_00006855 is a novel isoform of Tram1l1 that was assembled by both methods, but conventional RNA-seq failed to identify the isoform switch. Without length information, conventional RNA-seq reads in KO bands 2 and 3 were predominantly assigned to the annotated transcript in band 4. Barplots represent mean ± SEM; ***FDR corrected p<0.001. (d and f) Coverage plots for switching genes Exo1 and Tram1l1 showing separation of reads from transcripts of different lengths. (g) Jensen Shannon divergence for Ladder-seq and conventional RNA-seq for all identified transcripts grouped by relative difference in abundance estimation by both methods (n=18761 for <0.5, n=12722 for 0.5–1, n=7918 for 1–1.5, n=6292 for 1.5–2 relative difference). Relative difference is defined as the absolute difference in estimated transcript abundance (in TPM) divided by the average of the two. Boxplot definition: Bottom and top of the box correspond to lower and upper quartiles of the data, bar is the median and whiskers are median ± 1.5x interquartile range.
Extended Data Fig. 8 |
Extended Data Fig. 8 |. Mettl14 Ko leads to isoform switches in m6A methylated genes.
(a) Gene Ontology for m6A methylated genes containing isoform switches. (b) Isoform switch in Ptprz1 (between n=4 WT and n=4 KO samples). Red arrow shows location of m6A methylation. Barplots represent mean ± SEM; ***FDR corrected p<0.001. (c) Gene Ontology analysis for genes with loss of protein domains in KO NPCs. (d) Splicing analysis: Number of gains and losses of each splicing event in KO NPCs. A3: Alternative 3’ acceptor site; A5: Alternative 5’ acceptor site; ES: Exon skipping; IR: Intron retention; MEE: Mutually exclusive exon; MES: Multiple exon skipping. (e) Gene Ontology enrichment analysis of genes with intron retention loss in KO NPCs.
Extended Data Fig. 9 |
Extended Data Fig. 9 |. Comparison of Ladder-seq and oNT-cDNA sequencing on mouse NPCs.
(a) Orange bars show validation by StringTie2 (left panel) or by an independent ONT dataset (Dong et al.) (right panel) of transcripts found by both Ladder-seq and ONT-cDNA while light blue bars show validation values for transcripts reported only by ONT-cDNA. In comparison, 32.5% of transcripts uniquely identified by Ladder-seq (average TPM ≥ 1) were also identified in the dataset by Dong et al. (b) Boxplots showing expression levels (TPM) for transcripts identified both by long- reads and Ladder-seq (green boxes) and for transcripts identified only by Ladder-seq (grey boxes). Left panel shows values for all Ladder-seq transcripts with TPM higher than 1 (n=6169 identified only by Ladder-seq, n=15099 by both). Right panel shows values for Ladder-seq switching transcripts with TPM higher than 1 (n=905 identified only by Ladder-seq, n=2012 by both). Boxplot definition: Bottom and top of the box correspond to lower and upper quartiles of the data, bar is the median and whiskers are median ± 1.5x interquartile range.
Extended Data Fig. 10 |
Extended Data Fig. 10 |. Cumulative percentage of Ladder-seq transcripts identified by long-read sequencing.
Bars show percentage of Ladder-seq transcripts identified by FLAIR (green), plus those additionally identified by StringTie2 (blue), plus transcripts additionally found in a recently published long-read mouse NPC transcriptome (light blue).
Fig. 1 |
Fig. 1 |. Ladder-seq uses mRNA length information to aid transcriptome reconstruction.
a, Ladder-seq uses a denaturing agarose gel to separate mRNA by length into discrete bands before library preparation and sequencing. Each band contains transcripts of a certain length range that depends on the location of cuts through the gel. The originating band of the resulting reads is tracked using barcodes. In our dataset of mouse NPCs, Ladder-seq reveals transcript Paip2b-204 that contains intronic sequence of transcript Paip2b-201. b, Assessment of length separation by denaturing gel electrophoresis. Length-separated mRNA was run on a new denaturing agarose gel with each band loaded into a separate lane. This assay was conducted once. c, In silico gel. For every annotated transcript, the intensity of a point with y coordinate equal to its annotated length (plus 200-nt average poly(A) tail size) shows the fraction of reads obtained from each band (x axis) that can be assigned unambiguously to it.
Fig. 2 |
Fig. 2 |. Reduced read assignment ambiguity in Ladder-seq improves transcript quantification.
a, This illustrative example shows reads that were sampled in bands 2, 3, 6 and 7 in our genome-wide simulation study from three transcripts (t1 = ENST00000519483, t2 = ENST00000524124 and t3 = ENST00000357668; not all transcripts shown). The color of each read indicates the transcript to which the read is dominantly assigned after the first E-step of the EM algorithm in the original kallisto implementation based on conventional RNA-seq data (bottom) and in our extension of the algorithm to Ladder-seq (top). More precisely, we color every read according to the additional fraction that is assigned to the transcript of maximal assignment. The original algorithm fractionally assigns each read equally to every transcript that it overlaps (normalized by length), leading to indistinguishable black reads. Our adaptation of the algorithm uses the partitioning of reads into bands to hint at the read’s originating transcript, shown by matching read and transcript colors. Based on the migration patterns estimated from the length of the three transcripts, our EM algorithm assigns larger read fractions to transcripts that are expected to occur more abundantly in the read’s band (Methods). This length-based deconvolution allows the EM algorithm to ultimately quantify transcript abundances more accurately. In this example, our Ladder-seq-specific EM algorithm estimates 17, 257 and 67 counts (rounded) for transcripts t1, t2 and t3 respectively, which closely match their true expression of 15, 250 and 83 counts, respectively. In contrast, original kallisto fails to detect expression of t3 (zero counts) and overestimates expression of t2 (334 counts) from highly ambiguous RNA-seq reads. It estimates four counts for t1. b, Quantification accuracy of kallisto-ls compared to conventional kallisto on 30 million simulated reads. Mean values over 20 repeated simulations are reported. Pearson correlation of estimated and ground truth abundance in log 2 transformed TPM and mean absolute relative difference are shown as a function of gene complexity—that is, the number of transcripts expressed by a gene. Genes expressing a single transcript (omitted) or two transcripts were estimated to be lowly expressed by RSEM (Supplementary Table 4), making their quantification less accurate (Supplementary Tables 5 and 6).
Fig. 3 |
Fig. 3 |. Ladder-seq-based transcript assembly.
a, Overview of the proposed computational framework. For each band, a graph is constructed that captures connectivity information contained in read alignments. Reference-based assembly methods, such as StringTie2, use variants of splicing graphs to capture connectivity of exonic segments in expressed transcripts evidenced by spliced alignments of reads. Transcript sequences are then assembled by traversing paths through these graphs according to some optimization criteria, such as maximum flow for StringTie2. In contrast to conventional RNA-seq, where truly expressed transcripts need to be identified among a large number of possible paths through a single graph per locus, Ladder-seq limits the search for expressed transcripts to paths in smaller graphs that are constructed for each band separately. In addition, reads in different bands are obtained from transcripts of a certain length range, imposing length constraints that can further direct the search for the correct paths. After having inferred the best possible set of transcripts satisfying given length constraints in each band independently, we integrate them to a refined set of transcripts by assigning reads to them according to our statistical model of Ladder-seq, which relies on previously estimated migration patterns through the gel. b, Accuracy of transcript assembly from 30 million simulated RNA-seq and matching Ladder-seq reads. Reads were aligned to the reference genome using STAR. Sensitivity (left) and precision (right) of StringTie-ls and its conventional counterpart StringTie2 are shown as a function of gene complexity defined as the number of expressed transcripts. The lower ground truth expression of some genes with complexity 1 (Supplementary Table 4) makes them detectable with lower sensitivity than transcripts of genes with complexity 2. StringTie-lsi denotes the result of StringTie-ls on the simulated Ladder-seq dataset to which i-fold error reduction was applied (Methods), starting from the migration error estimated from the NPC sample (StringTie-ls). StringTie-ls-perfect represents the results of StringTie-ls on the most optimistic Ladder-seq experiment in which transcripts perfectly separate by length, without any migration error. All results are listed in Supplementary Tables 7–10.
Fig. 4 |
Fig. 4 |. Accuracy of de novo transcript assembly from 75 million simulated RNA-seq and matching Ladder-seq reads.
Trinity-lsi denotes the results of Trinity-ls on the simulated Ladder-seq dataset to which i-fold error reduction was applied (Methods), starting from the migration error estimated from the NPC sample (Trinity-ls). Trinity-ls-perfect represents the results of Trinity-ls on the most optimistic Ladder-seq experiment in which transcripts perfectly separate by length, without any migration error. A transcript is correctly assembled if its BLAT alignment to a true transcript covers at least 90% of the full transcript length. Left, Sensitivity of Trinity-ls and its conventional counterpart Trinity is shown as a function of gene complexity defined as the number of expressed transcripts. The low expression of some genes expressing a single transcript (Supplementary Table 4) makes them more difficult to assemble than transcripts of genes with a higher complexity. Middle, Total number of correctly assembled transcripts. Right, Overall precision. Assembled transcript fragments cannot be assigned unambiguously to individual genes. All results are listed in Supplementary Tables 15–18.
Fig. 5 |
Fig. 5 |. Ladder-seq improves differential analysis of reconstructed transcriptomes.
a, Gene complexity and effective gene complexity for switching genes identified by only one of the two or both methods (n = 755 by conventional only, n = 1,512 by Ladder-seq only and n = 1,123 by both). The effective complexity is defined as the number of expressed transcripts contained in a single band. b, Isoform switch identified only by Ladder-seq. Pi4k2a expresses mostly the annotated ENSMUST00000066778 transcript in WT (n = 4), whereas KO (n = 4) also expresses a shorter unannotated transcript (TCONS_00005143) in which a normally m6A-tagged exonic region is spliced out. The red arrow shows the location of m6A methylation. Overall gene expression level is unchanged between WT and KO. Bar plots represent mean ± s.e.m.; ***FDR-corrected P < 0.001. c, Coverage plot for bands 4 and 5 of Pi4k2a showing how reads from the shorter unannotated transcript TCONS_00005143 are separated from reads belonging to the longer ENSMUST00000066778. d, Relative quantification of isoform expression with RT–qPCR. Three biological replicates were tested per genotype. Each sample was tested in triplicate and normalized to β-actin. Expression levels of each differentially expressed isoform were normalized to the expression of a common isoform identified in both WT and Mettl14 KO, which consistently showed no significant difference between WT and KO NPCs. Bars represent mean values; error bars represent the s.e.m. e, JSD between estimated and assigned read band distributions for differentially used isoforms identified by only one of the two or both methods (n = 729 by conventional only, n = 1337 by Ladder-seq only and n = 1,745 by both). f, JSD between estimated and assigned read band distributions for all identified transcripts by Ladder-seq and conventional RNA-seq grouped by number of available uniquely mapping reads (Ladder-seq: n = 14,024 for 0, n = 1,266 for 0–100, n = 1,392 for 100–200 and n = 6,206 for >200 uniquely mapping reads; Conventional: n = 17,568 for 0, n = 1,446 for 0–100, n = 1,483 for 100–200 and n = 6,248 for >200 uniquely mapping reads). Box plot definition: bottom and top of the box correspond to lower and upper quartiles of the data; bar is the median; and whiskers are median ±1.5× interquartile range. a.u., arbitrary units.
Fig. 6 |
Fig. 6 |. Mettl14 Ko leads to isoform switches in m6A methylated genes and leads to loss of protein domains and loss of intron retentions.
a, Venn diagram showing overlap between switching genes and m6A methylated genes. P value from two-sided Fisher’s exact test. b, Enrichment of m6A methylation within exonic segments bounding differentially spliced regions. In this example, both the differentially spliced exonic region and the two segments flanking it (in orange) are considered. Pie charts show percentage of exonic segments overlapping m6A peaks. P value and odds ratio from two-sided Fisher’s exact test. c, d, Isoform switch in genes Fbxl5 (c) and Kif1b (d) (between n = 4 WT and n = 4 KO samples). Red arrows show location of m6A methylation. Bar plots represent mean ± s.e.m; ***FDR-corrected P < 0.001. Isoform switch in Kif1b leads to upregulation of shorter Kif1b-alpha isoform, which lacks multiple domains and is expressed in non-neuronal tissues. The longer Kif1b-beta is the neuronal isoform and is responsible for the transport of synaptic vesicle precursors. Overall gene expression level is unchanged between WT and KO. e, Splicing enrichment analysis. Proportion of isoform switches (n = 2,634) resulting in gain of each splicing event in KO NPCs (n = 482 intron retentions, n = 573 alt 5′ splice sites, n = 12 mutually exclusive exons, n = 926 exon skippings, n = 483 alt 3′ splice sites and n = 396 multiple exon skippings). Test of equal proportions was used to identify proportions significantly different from 0.5. Points indicate fraction of switches resulting in gain of splicing event, and bars represent 95% confidence intervals. f, Number of intron retention losses resulting in NMD sensitive or insensitive isoforms (left) and shorter or longer 3′ UTR length (right).

Similar articles

Cited by

References

    1. Zhang C, Zhang B, Lin L-L & Zhao S Evaluation and comparison of computational tools for RNA-seq isoform quantification. BMC Genomics 18, 583 (2017). - PMC - PubMed
    1. Teng M et al. A benchmark for RNA-seq quantification pipelines. Genome Biol. 17, 74 (2016). - PMC - PubMed
    1. Aguiar D et al. Bayesian nonparametric discovery of isoforms and individual specific quantification. Nat. Commun. 9, 1681 (2018). - PMC - PubMed
    1. Song L, Sabunciyan S, Yang G & Florea L A multi-sample approach increases the accuracy of transcript assembly. Nat. Commun. 10, 5000 (2019). - PMC - PubMed
    1. Li WV et al. AIDE: annotation-assisted isoform discovery with high precision. Genome Res. 29, 2056–2072 (2019). - PMC - PubMed

Publication types

LinkOut - more resources