Rhinovirus Incidence Rates Indicate We Are Tired of Non-pharmacological Interventions Against Coronavirus Disease 2019
- PMID: 35014227
- PMCID: PMC8748668
- DOI: 10.3346/jkms.2022.37.e15
Rhinovirus Incidence Rates Indicate We Are Tired of Non-pharmacological Interventions Against Coronavirus Disease 2019
Abstract
Background: During the coronavirus disease 2019 (COVID-19) pandemic, the incidence of rhinovirus (RV) is inversely related to the intensity of non-pharmacological interventions (NPIs), such as universal mask wearing and physical distancing.
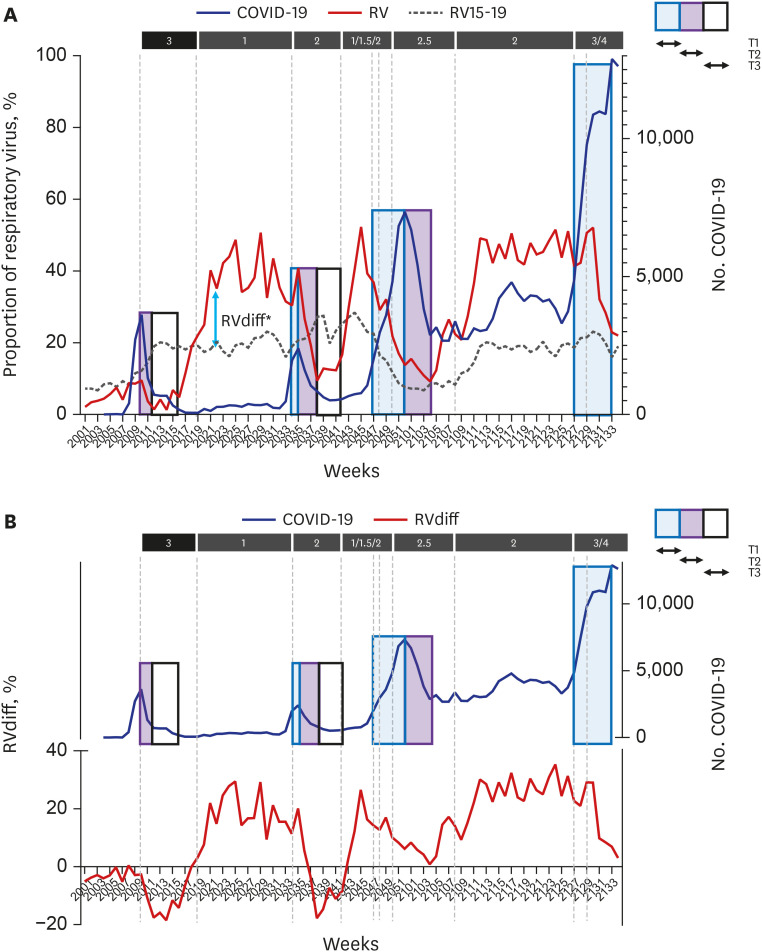
Methods: Using RV surveillance data, changes in the effect of NPIs were investigated in South Korea during the pandemic. The time to the first visible effect of NPIs after the onset of NPIs (T1), time to the maximum effect (T2), and duration of the maximum effect (T3) were measured for each surge. For each week, the RVdiff [(RV incidence during the pandemic) - (RV incidence within 5 years before the pandemic)] was calculated, and number of weeks for RVdiff to be below zero after NPIs (time to RVdiff ≤ 0) and number of weeks RVdiff remains below zero after NPIs (duration of RVdiff ≤ 0) were measured for each surge.
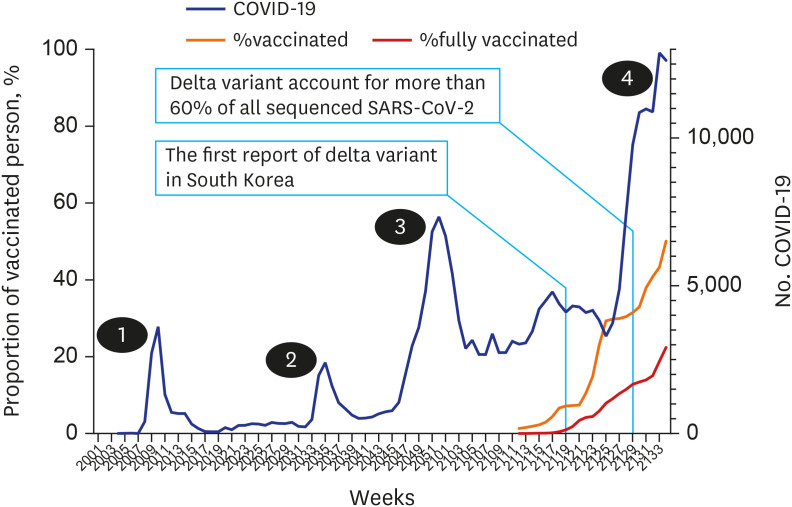
Results: During the study period, four surges of COVID-19 were reported. As the pandemic progressed, T1 and T2 increased, but T3 decreased. Additionally, the "time to RVdiff of ≤ 0" increased and "duration of RVdiff of ≤ 0" decreased. These changes became more pronounced during the third surge (mid-November 2020), before the introduction of the COVID-19 vaccine, and from the emergence of the delta variant.
Conclusion: The effect of NPIs appears slower, the duration of the effect becomes shorter, and the intensity also decreases less than a year after the onset of the pandemic owing to people's exhaustion in implementing NPIs. These findings suggest that the COVID-19 response strategy must be completely overhauled.
Keywords: COVID-19; Non-pharmacological Intervention; Rhinovirus; Time of Effects.
© 2021 The Korean Academy of Medical Sciences.
Conflict of interest statement
The authors have no potential conflicts of interest to disclose.
Figures
Similar articles
-
Analysis of the effectiveness of non-pharmaceutical interventions on influenza during the Coronavirus disease 2019 pandemic by time-series forecasting.BMC Infect Dis. 2023 Oct 24;23(1):717. doi: 10.1186/s12879-023-08640-y. BMC Infect Dis. 2023. PMID: 37875817 Free PMC article.
-
Lifting non-pharmaceutical interventions following the COVID-19 pandemic - the quiet before the storm?Expert Rev Vaccines. 2022 Nov;21(11):1541-1553. doi: 10.1080/14760584.2022.2117693. Epub 2022 Sep 5. Expert Rev Vaccines. 2022. PMID: 36039786 Review.
-
How COVID-19 is changing the cold and flu season.Nature. 2020 Dec;588(7838):388-390. doi: 10.1038/d41586-020-03519-3. Nature. 2020. PMID: 33324005 No abstract available.
-
Low circulation of Influenza A and coinfection with SARS-CoV-2 among other respiratory viruses during the COVID-19 pandemic in a region of southern Brazil.J Med Virol. 2021 Jul;93(7):4392-4398. doi: 10.1002/jmv.26975. Epub 2021 Apr 8. J Med Virol. 2021. PMID: 33829531 Free PMC article.
-
Non-pharmaceutical interventions in containing COVID-19 pandemic after the roll-out of coronavirus vaccines: a systematic review.BMC Public Health. 2024 Jun 6;24(1):1524. doi: 10.1186/s12889-024-18980-2. BMC Public Health. 2024. PMID: 38844867 Free PMC article.
Cited by
-
A Novel Approach on Deep Learning-Based Decision Support System Applying Multiple Output LSTM-Autoencoder: Focusing on Identifying Variations by PHSMs' Effect over COVID-19 Pandemic.Int J Environ Res Public Health. 2022 Jun 1;19(11):6763. doi: 10.3390/ijerph19116763. Int J Environ Res Public Health. 2022. PMID: 35682349 Free PMC article.
-
Changes in the mean incidence and variance of orthopedic diseases before and during the COVID-19 pandemic in Korea: a retrospective study.BMC Musculoskelet Disord. 2023 Jul 1;24(1):540. doi: 10.1186/s12891-023-06634-0. BMC Musculoskelet Disord. 2023. PMID: 37393227 Free PMC article.
-
Trends and Dynamics of Respiratory Viruses in Hospitalized Children of Fuzhou: Insights Into the Impact of COVID-19 Pandemic Control Measures.Int J Gen Med. 2025 Feb 12;18:759-770. doi: 10.2147/IJGM.S511995. eCollection 2025. Int J Gen Med. 2025. PMID: 39963516 Free PMC article.
-
Identifying susceptibility of children and adolescents to the Omicron variant (B.1.1.529).BMC Med. 2022 Nov 23;20(1):451. doi: 10.1186/s12916-022-02655-z. BMC Med. 2022. PMID: 36419108 Free PMC article.
-
Changes in the Mean and Variance of the Numbers of Medical Visits for Allergic Diseases before and during the COVID-19 Pandemic in Korea.J Clin Med. 2022 Jul 22;11(15):4266. doi: 10.3390/jcm11154266. J Clin Med. 2022. PMID: 35893358 Free PMC article.
References
-
- Korea Disease Control and Prevention Agency. Coronavirus disease 2019 (COVID-19) [Updated 2021]. [Accessed September 2, 2021]. http://ncov.mohw.go.kr .
MeSH terms
Substances
Supplementary concepts
Grants and funding
LinkOut - more resources
Full Text Sources
Medical
Research Materials