. 2022 Jan 11:11:e73456.
doi: 10.7554/eLife.73456.

Aging is associated with increased brain iron through cortex-derived hepcidin expression

Affiliations

Aging is associated with increased brain iron through cortex-derived hepcidin expression

Tatsuya Sato et al. Elife. .

Abstract

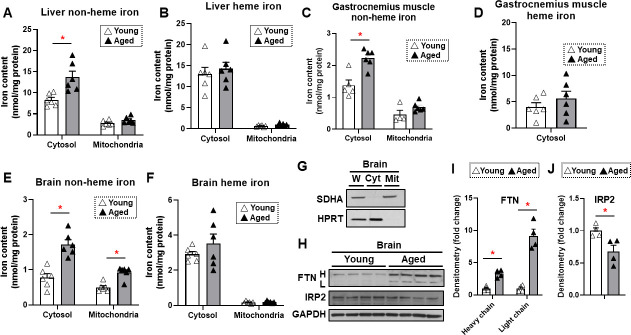
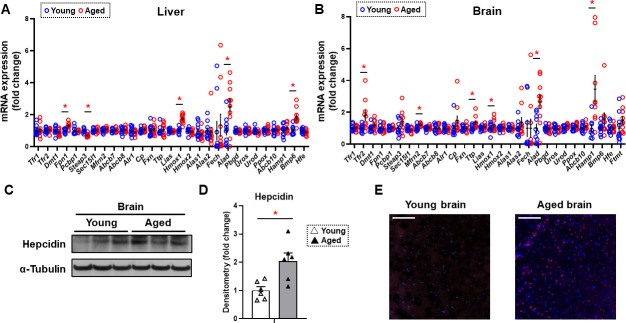
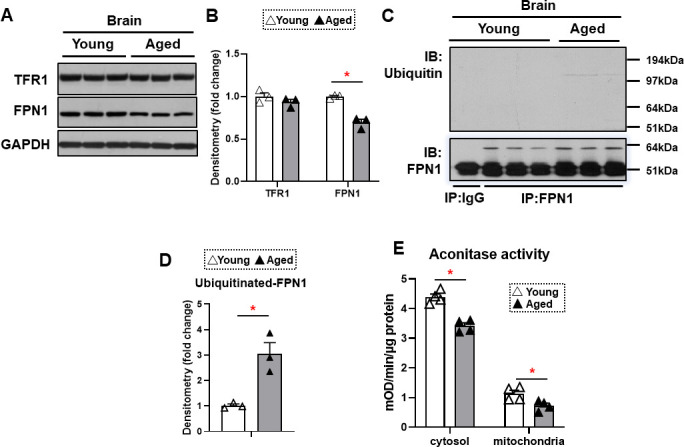
Iron is an essential molecule for biological processes, but its accumulation can lead to oxidative stress and cellular death. Due to its oxidative effects, iron accumulation is implicated in the process of aging and neurodegenerative diseases. However, the mechanism for this increase in iron with aging, and whether this increase is localized to specific cellular compartment(s), are not known. Here, we measured the levels of iron in different tissues of aged mice, and demonstrated that while cytosolic non-heme iron is increased in the liver and muscle tissue, only the aged brain cortex exhibits an increase in both the cytosolic and mitochondrial non-heme iron. This increase in brain iron is associated with elevated levels of local hepcidin mRNA and protein in the brain. We also demonstrate that the increase in hepcidin is associated with increased ubiquitination and reduced levels of the only iron exporter, ferroportin-1 (FPN1). Overall, our studies provide a potential mechanism for iron accumulation in the brain through increased local expression of hepcidin, and subsequent iron accumulation due to decreased iron export. Additionally, our data support that aging is associated with mitochondrial and cytosolic iron accumulation only in the brain and not in other tissues.

Keywords: Aging; Iron; medicine; mouse; oxidative stress.


Conflict of interest statement

TS, JS, HC, RM No competing interests declared, HA Reviewing editor, eLife

Figures

Figure 1.
Figure 1.. Non-heme iron is increased in the cytosol and mitochondria of the brain cortex with aging.
Liver non-heme (A) and heme (B) iron in young (4 months old) and old (22 months old) mice from the cytosol and mitochondria (n=6). Gastrocnemius non-heme (C) and heme (D) iron in young and old mice from the cytosol and mitochondria (n=6). Outliers in non-heme iron in the cytosol (n=1) and in the mitochondria (n=2) were excluded. Mitochondrial heme iron in gastrocnemius muscle was not detectable in our studies. Brain non-heme (E) and heme (F) iron in young and old mice from the cytosol and mitochondria (n=6). (G) Immunoblots of mitochondrial and cytosolic markers, confirming the purity of mitochondrial isolation in the brain cortex tissue. W = whole cell lysate, Cyt = cytosolic fraction, Mit = mitochondrial fraction, SDHA = Succinate Dehydrogenase Complex Flavoprotein Subunit A, HPRT = hypoxanthine phosphoribosyltransferase. (H) Immunoblots of FTN and IRP2 in the brain of young and aged mice (n=4). FTN = ferritin, IRP2 = iron regulatory protein 2, H = heavy chain, L = light chain. Densitometric quantification of light and heavy chain FTN (I) and IRP2 (J) in the brain of young and aged mice. * p<0.05.
Figure 2.
Figure 2.. Hepcidin protein expression is significantly increased in the aged brain cortex.
mRNA levels of proteins involved in iron regulation in the liver (A) and brain (B) in young (4 months old) and old (22 months old) mice (n=10/group). Means and SEM are indicated as horizontal and vertical bars, respectively. An undetected measurement (n=1) in the brain Fech and undetected measurements (n=2) and an outlier (n=1) in the brain Hamp1 were excluded. Tfr1 = transferrin receptor 1, Tfr2 = transferrin receptor 2, Dmt1 = divalent metal transporter 1, Fpn1 = ferroportin 1, Pcbp1 = Poly(RC) Binding Protein 1, Steap3 = Metalloreductase Six-Transmembrane Epithelial Antigen Of Prostate 3, Sec15l1 = exocyst complex component 6, Mfrn2 = mitoferrin 2, Abcb7 = ATP-binding cassette sub-family B member 7, Abcb8 = ATP-binding cassette sub-family B member 8, Alr1 = augmenter of liver regeneration, Cp = ceruloplasmin, Fxn = frataxin, Ttp = tristetraprolin, Lias = tristetraprolin, Hmox1 = heme oxygenase 1, Hmox2 = heme oxygenase 2, Alas1 = 5′-aminolevulinate synthase 1, Alas2 = 5′-aminolevulinate synthase 2, Fech = ferrochelatase, Alad = aminolevulinate dehydratase, Pbgd = porphobilinogen deaminase, Uros = uroporphyrinogen III synthase, Urod = uroporphyrinogen decarboxylase, Ppox = protoporphyrinogen oxidase, Abcb10 = ATP-binding cassette, sub-family B member 10, Hamp1 = hepcidin1, Bmp6 = bone morphogenetic protein 6, Hfe = homeostatic iron regulator, Ftmt = mitochondrial ferritin. (C) Representative immunoblot for hepcidin1 in the brain (n=6). (D) Summary of densitometry analysis of panel (C). (E) Representative immunohistochemistry of hepcidin1 (Red = anti-hepcidin1, blue = DAPI) in the brain frontal cortex of young and aged mice. Scale bar=200 µm. * p<0.05.
Figure 3.
Figure 3.. FPN1 protein level is decreased while its poly-ubiquitination is increased in the brain cortex of aged mice.
(A) Immunoblots of iron transporting proteins TfR1 and FPN1 in the brain cortex of young and aged mice (n=3). (B) Summary of densitometric analysis of panel (A). (C) Poly-ubiquitination levels of FPN1, as assessed by immunoprecipitation, in the brain cortex of young and aged mice (n=3). (D) Summary of the densitometric analysis of panel (C). (E) Fe-S cluster containing aconitase enzyme activity, a marker of cellular oxidative stress, in the brain cortex of young and aged mice (n=4). c-aconitase = cytosolic aconitase (ACO1), m-aconitase = mitochondrial aconitase (ACO2). * p<0.05.

References

    1. Bartzokis G, Mintz J, Sultzer D, Marx P, Herzberg JS, Phelan CK, Marder SR. In vivo MR evaluation of age-related increases in brain iron. AJNR. American Journal of Neuroradiology. 1994a;15:1129–1138. - PMC - PubMed
    1. Bartzokis G., Sultzer D, Mintz J, Holt LE, Marx P, Phelan CK, Marder SR. In vivo evaluation of brain iron in Alzheimer’s disease and normal subjects using MRI. Biological Psychiatry. 1994b;35:480–487. doi: 10.1016/0006-3223(94)90047-7. - DOI - PubMed
    1. Bartzokis G, Lu PH, Tishler TA, Peters DG, Kosenko A, Barrall KA, Finn JP, Villablanca P, Laub G, Altshuler LL, Geschwind DH, Mintz J, Neely E, Connor JR. Prevalent iron metabolism gene variants associated with increased brain ferritin iron in healthy older men. Journal of Alzheimer’s Disease. 2010;20:333–341. doi: 10.3233/JAD-2010-1368. - DOI - PMC - PubMed
    1. Bayeva M, Khechaduri A, Puig S, Chang HC, Patial S, Blackshear PJ, Ardehali H. mTOR regulates cellular iron homeostasis through tristetraprolin. Cell Metabolism. 2012;16:645–657. doi: 10.1016/j.cmet.2012.10.001. - DOI - PMC - PubMed
    1. Benkovic SA, Connor JR. Ferritin, transferrin, and iron in selected regions of the adult and aged rat brain. The Journal of Comparative Neurology. 1993;338:97–113. doi: 10.1002/cne.903380108. - DOI - PubMed

Publication types