. 2022 Jan 11;7(1):e152551.
doi: 10.1172/jci.insight.152551.

A congenital CMV infection model for follow-up studies of neurodevelopmental disorders, neuroimaging abnormalities, and treatment

Affiliations

A congenital CMV infection model for follow-up studies of neurodevelopmental disorders, neuroimaging abnormalities, and treatment

Yue-Peng Zhou et al. JCI Insight. .

Abstract

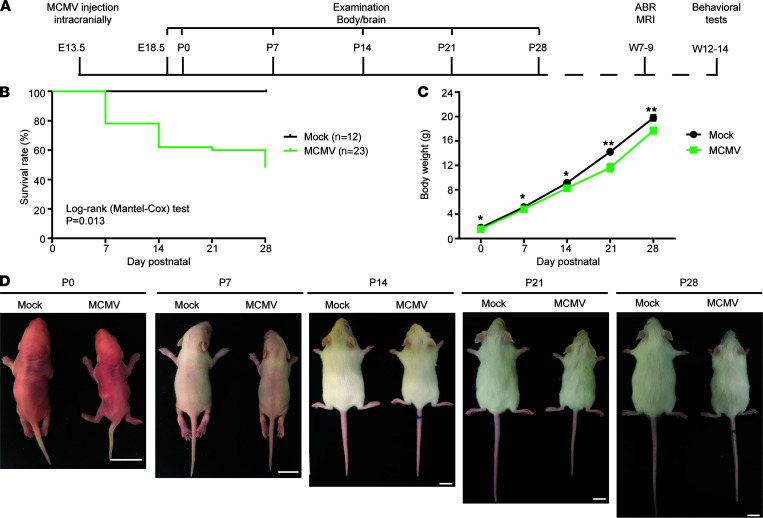
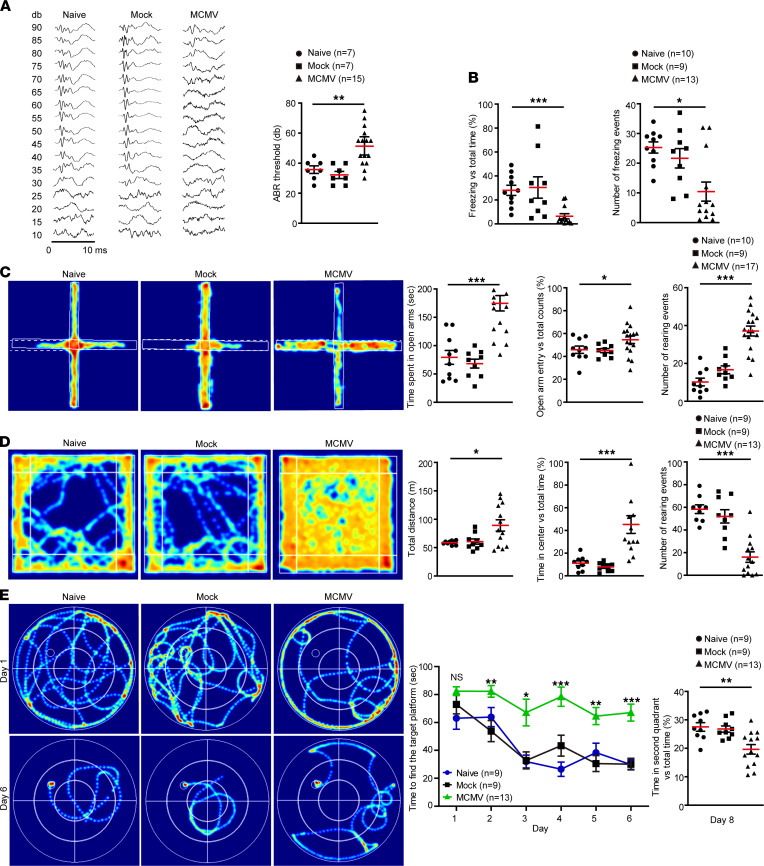
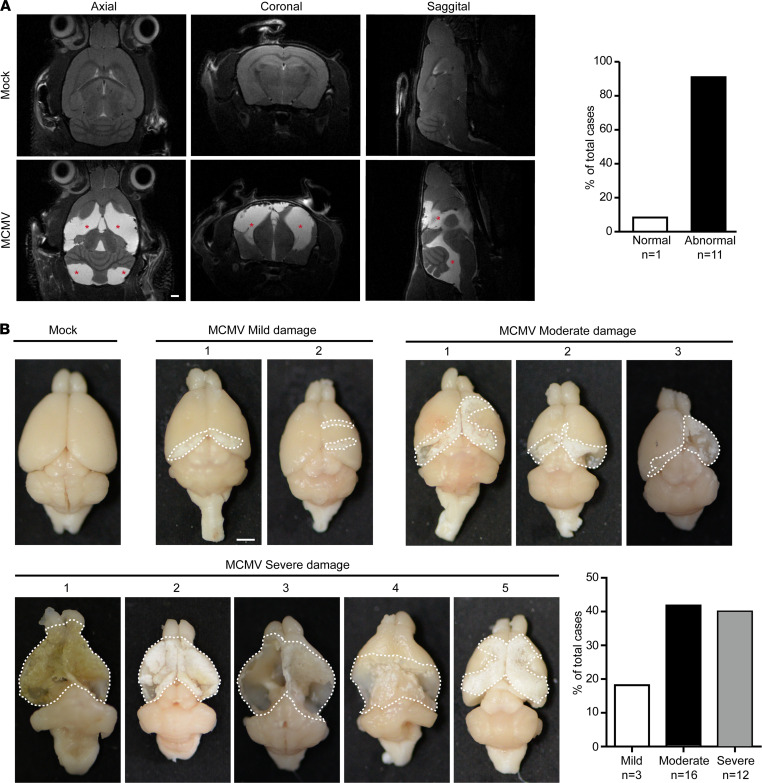
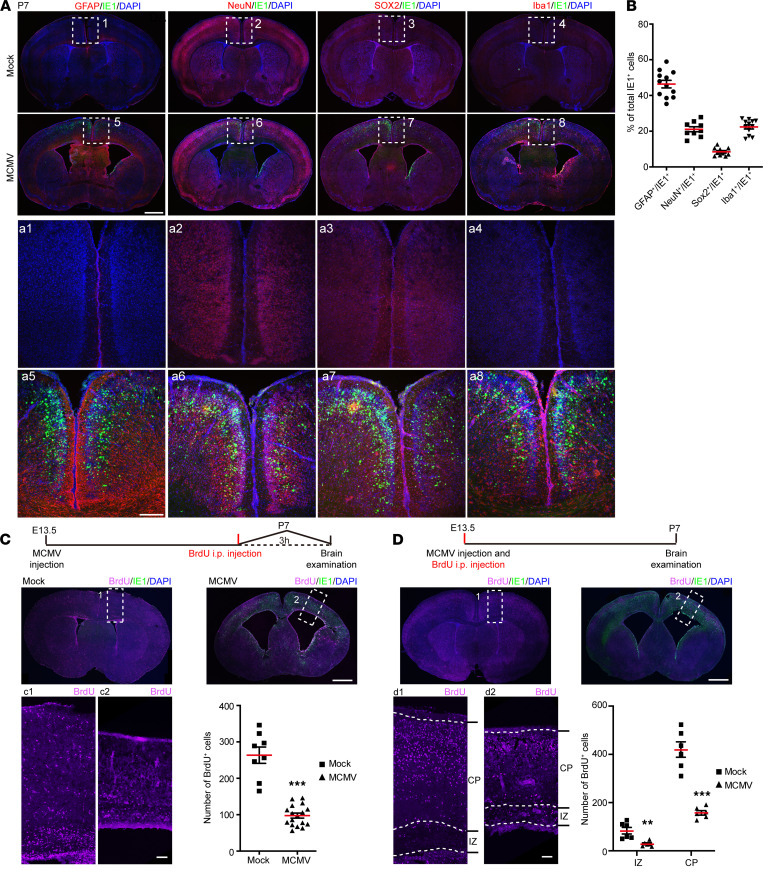
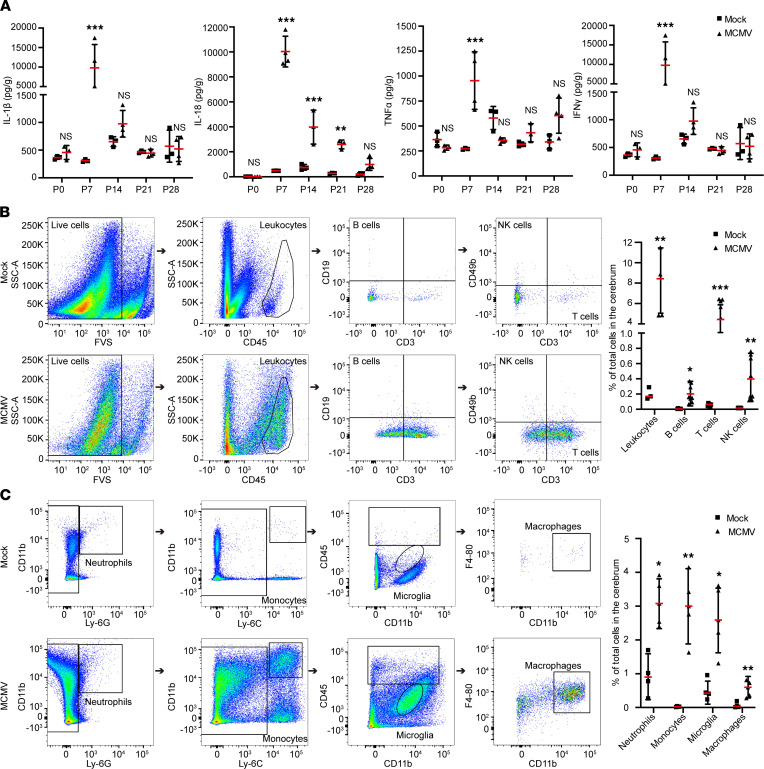
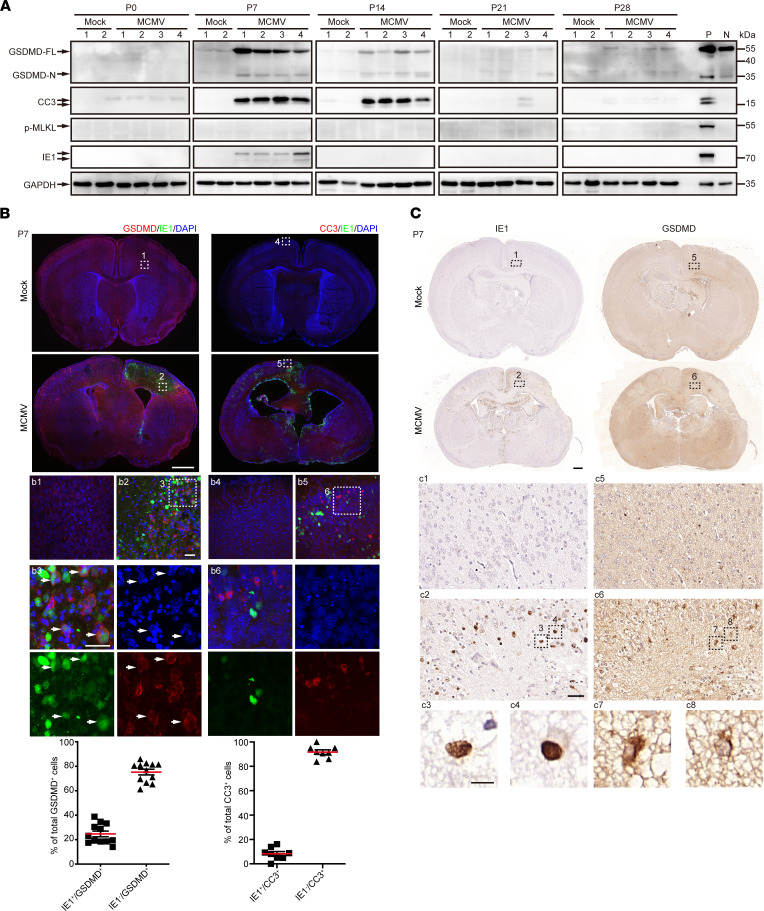
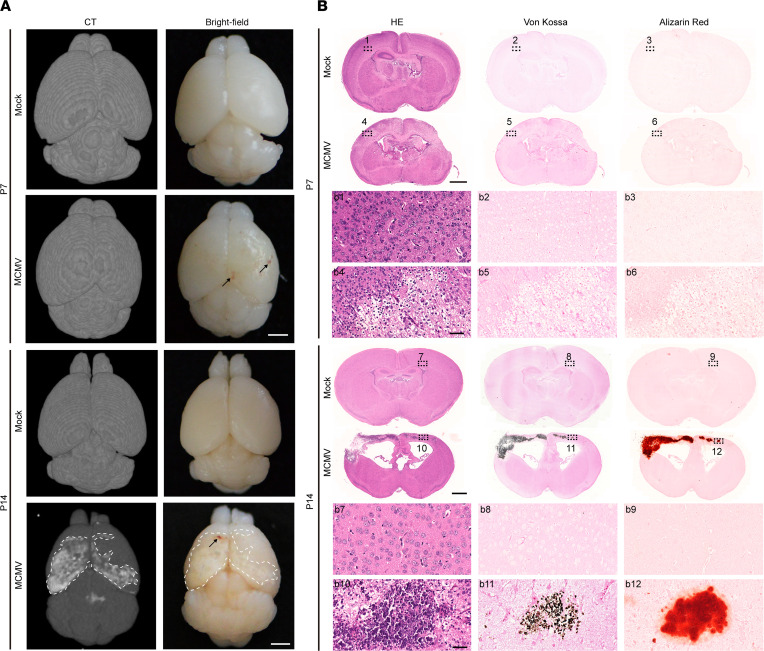
Congenital cytomegalovirus (cCMV) infection is the leading infectious cause of neurodevelopmental disorders. However, the neuropathogenesis remains largely elusive due to a lack of informative animal models. In this study, we developed a congenital murine CMV (cMCMV) infection mouse model with high survival rate and long survival period that allowed long-term follow-up study of neurodevelopmental disorders. This model involves in utero intracranial injection and mimics many reported clinical manifestations of cCMV infection in infants, including growth restriction, hearing loss, and impaired cognitive and learning-memory abilities. We observed that abnormalities in MRI/CT neuroimaging were consistent with brain hemorrhage and loss of brain parenchyma, which was confirmed by pathological analysis. Neuropathological findings included ventriculomegaly and cortical atrophy associated with impaired proliferation and migration of neural progenitor cells in the developing brain at both embryonic and postnatal stages. Robust inflammatory responses during infection were shown by elevated inflammatory cytokine levels, leukocyte infiltration, and activation of microglia and astrocytes in the brain. Pathological analyses and CT neuroimaging revealed brain calcifications induced by cMCMV infection and cell death via pyroptosis. Furthermore, antiviral treatment with ganciclovir significantly improved neurological functions and mitigated brain damage as shown by CT neuroimaging. These results demonstrate that this model is suitable for investigation of mechanisms of infection-induced brain damage and long-term studies of neurodevelopmental disorders, including the development of interventions to limit CNS damage associated with cCMV infection.

Keywords: Infectious disease; Mouse models; Neurodevelopment; Neuroimaging; Virology.


Conflict of interest statement

Conflict of interest: The authors have declared that no conflict of interest exists.

Figures

Figure 1
Figure 1. A cMCMV infection mouse model for follow-up studies of neurodevelopmental disorders.
(A) Timeline. A dose of 20 PFU MCMV or equivalent conditioned media (Mock) was injected intracranially at E13.5. The bodies and brains of the mice were examined weekly from P0 to P28, or longer depending on experiments. Neuroimaging by MRI and auditory brainstem evoked response (ABR) tests were performed at 7–9 weeks postnatally (W7-9), and neurological tests were performed at W12–14. (B) Survival rates. Survival curves of mock- and MCMV-infected newborns from P0 to P28 are shown; the Mantel-Cox test was used for survival analysis. (C) Body weights. Body weights were measured weekly from P0 to P28. Data were analyzed by 2-tailed Student’s t test and results are presented as mean ± SEM. *, P < 0.05; **, P < 0.01. (D) General growth. Representative whole mouse images at the indicated time points are shown. Scale bar: 10 mm.
Figure 2
Figure 2. cMCMV infection induces auditory and behavioral abnormalities.
(A) Auditory function. ABR was determined in naive and mock- or MCMV-infected mice at W7–8. Representative audiograms in 10 ms from naive and mock- or MCMV-infected pups tested over a range of frequencies (clicks). ABR thresholds are shown on the right. (B) Short-term learning-memory ability. Short-term learning-memory ability was assessed by fear conditioning test at W12–13, and proportions of freezing time and number of freezing events were recorded. (C) Anxiety-like behavior in EPMT. General anxiety to open spaces was evaluated at W12–13. Representative heatmaps of mouse movement tracks and durations are shown. Time spent in the open arms (indicated by white dashed line), percentage of entries to the open arms versus total counts, and number of rearing events were recorded. (D) Anxiety-like behavior in OFT. OFT was performed to assess anxiety-like behavior to open areas. Representative heatmaps of movement tracks and durations are shown. Total traveled distance, percentage of time traveled in the center, and number of rearing events were measured. (E) Spatial learning-memory. Spatial learning-memory abilities were determined by MWM test during W13–14. All mice were trained in the maze for 6 days and tested on the eighth day. Representative heatmaps of movement tracks and durations are shown. Total time of finding the target platform (indicated as a circle in the heatmap) from day 1 to day 6 and proportions of time in the second quadrant on day 8 were recorded. All data were analyzed by 1-way ANOVA test and results are presented as means ± SEM. *, P < 0.05; **, P < 0.01; ***, P < 0.001. Sample size n for each group is indicated.
Figure 3
Figure 3. Altered neuroimaging findings and loss of brain parenchyma in infected mice.
(A) Neuroimaging (anatomical imaging) by MRI. Brain damage was monitored by MRI at W8–9. Axial, sagittal, and coronal views of representative mock and MCMV-infected brains are shown, and abnormal hyperintense signals are indicated by red asterisks. In the MCMV-infected group the percentages of cases with or without abnormal hyperintense signals among the total cases were calculated. Sample size n is indicated. Scale bar: 1 mm. (B) Pathological examination of brain damage. Representative images of W14 mouse brains following neurological tests are shown. Damaged areas outlined by white dashed lines were measured. Brain damage was classified into mild (0%~30%), moderate (30%~70%), and severe (>70%) groups according to the percentage of damaged area to the total area of the brain. The proportions of cases in each group to total cases were calculated and presented. Sample size n is indicated. Scale bar: 2 mm.
Figure 4
Figure 4. Brain developmental disorders with ventriculomegaly and cortical atrophy.
(A) Viral loads in different organs. Viral genome copy number was assessed by qPCR using MCMV-DNA extracted from equal amounts of different organ tissues from 3 MCMV-infected mice at the indicated time points. Results are presented as mean ± SEM. (B) Dynamic changes in brain weight. Representative images of brains harvested at P7 using bright-field and fluorescence microscopies are shown. Hemorrhage is indicated by black arrow. Brain weights were measured at the indicated time points. Scale bar: 2 mm. (C) Lateral ventricle areas and thicknesses of cortical layers at P7. Coronal brain sections were stained for IE1 (green), DAPI (blue), and Tbr1 (red) or Ctip2 (red), respectively. Lateral ventricle areas of position-matched brain sections outlined by white dashed lines were measured. Thicknesses of cortical layers in the position-matched region (indicated in white dashed box) were measured. Data were collected from 3 mice/group in 3 independent experiments. Results are presented as mean ± SEM and analyzed by 2-tailed Student’s t test, respectively. *, P < 0.05; **, P < 0.01, ***, P < 0.001. Scale bar: 1 mm or 100 μm in the magnified images.
Figure 5
Figure 5. cMCMV infection of brain resident cells and impaired NPC proliferation and migration.
(A) Localization of IE1 and brain cell markers. Coronal brain sections were stained by immunofluorescence assay (IFA) for IE1 (green), DAPI (blue), or GFAP (red), NeuN (red), SOX2 (red), or Iba1 (red), respectively. Position-matched cortex regions (indicated by white dashed box) are shown in magnified views. (B) Percentage of different cell types in IE1+ cells. Among the IE1+ cells, the proportions of GFAP+IE1+, NeuN+IE1+, SOX2+IE1+, or Iba1+IE1+ cells in position-matched cortex were quantified separately. (C) NPCs’ proliferation at P7. BrdU was administrated i.p. to newborns at P7, and the brains were harvested 3 hours later. Coronal brain sections were stained for BrdU (purple), IE1 (green), or DAPI (blue). BrdU+ cells in position-matched cortex (indicated by white dashed rectangle) in each group were quantified. (D) NPCs’ migration at P7. BrdU was administrated i.p. to pregnant mice at E13.5, and neonatal brains from offspring were harvested at P7. Coronal brain sections were stained for BrdU (purple), IE1 (green), or DAPI (blue). BrdU+ cells in position-matched IZ and CP (indicated by white dashed rectangle) were quantified. Data were collected from 3–9 newborns/group in 3 independent experiments and analyzed by 2-tailed Student’s t test. **, P <0.01; ***, P < 0.001. Scale bar: 1 mm (A, top); 200 μm (A, bottom); 100 μm (C and D).
Figure 6
Figure 6. Neuroinflammation induced by cMCMV infection.
(A) Dynamic changes of cytokine levels in cerebrum of infected mice. Levels of IL-1β, IL-18, TNF-α, and IFN-γ in cerebral samples at the indicated time points were determined by ELISA from 3–6 newborns/group in 3 independent experiments. (B) Representative flow cytometric plots of B (CD45+CD19+), T (CD45+CD3+), and NK cells (CD45+CD3CD49b+) among total cells in the cerebrum at P7 are shown. Percentages of leukocytes and B, T, and NK cells in total cells in the cerebrum were calculated from 12 newborns/group. (C) Neutrophils, monocytes, microglia, and macrophage infiltration in cerebra at P7. Representative flow cytometric plots separating neutrophils (CD11b+Ly-6G+), monocytes (CD11b+Ly-6C+), microglia (CD45CD11bdim), and macrophages (CD45+CD11b+F4-80+) among total cells in the cerebrum are shown. Percentages of neutrophils, monocytes, microglia, and macrophages among total cells in the cerebrum were calculated from 12 newborns/group. Data were analyzed by 2-tailed Student’s t test and results are presented as means ± SEMs. *P < 0.05; **P < 0.01; ***P < 0.001.
Figure 7
Figure 7. Brain cell death via pyroptosis and apoptosis induced by cMCMV infection.
(A) Factors in programmed cell death pathways. The factors in pyroptosis (GSDMD-FL and cleaved GSDMD-N), apoptosis (cleaved caspase-3, CC3), necroptosis (p-MLKL), and IE1 in cerebral cell lysates at the indicated time points were determined by Western blot. Positive (P) and negative (N) controls for the target proteins are included to indicate the correct sizes. GAPDH served as a loading control. (B) Distributions of GSDMD or CC3 in IE1+ cells by IFA. Position-matched coronal cerebral sections of mock- and MCMV-infected brains at P7 were stained for IE1 (green), DAPI (blue), or GSDMD (red) or CC3 (red). Magnified views (indicated by white dashed box) are shown. Colocalizations of GSDMD and IE1 are indicated by white arrowheads. Scale bar: 1 mm (top); 50 μm (bottom). (C) Localization of GSDMD in IE1+ cells by IHC. Position-matched adjacent sequential coronal cerebral sections of mock- and MCMV-infected brains at P7 were stained for GSDMD and IE. Colocalizations of GSDMD and IE1 are shown in magnified views (indicated by black dashed rectangles). Scale bar: 1 mm (top), 50 μm (middle), 10 μm (bottom).
Figure 8
Figure 8. CT neuroimaging abnormalities and brain calcification induced by cMCMV infection.
(A) Neuroimaging by CT. Neuroimaging by micro-CT was applied to assess brain damage at P7 and P14. Axial views of mock- and MCMV-infected neonatal brains were obtained by bright-field microscopy or micro-CT. Representative images are shown with cerebral calcification area outlined by white dashed lines. Hemorrhage is indicated by black arrows. Scale bar: 2 mm. (B) Cerebral calcification assessed by IHC at P7 and P14. Position-matched adjacent sequential coronal cerebral sections of mock- and MCMV-infected brains were subjected to HE staining for brain architecture and von Kossa and Alizarin red staining for calcium deposition. Position-matched regions in the sections are shown in magnified views (indicated by black dashed rectangles). Scale bar: 1 mm; 50 μm (magnified images).
Figure 9
Figure 9. Impact of neonatal GCV treatment on viral load, inflammation, and pyroptosis.
(A) Timeline of GCV treatment. GCV was injected i.p. daily from P1 to P7. Experimental groups included (i) GCV-treated mock-infected (Mock), (ii) PBS-treated MCMV-infected (MCMV, negative treatment control), and (iii) GCV-treated MCMV-infected (MCMV+GCV) mice. (B) GCV treatment and viral loads in brain. Viral genome copy number was assessed by qPCR using DNA extracted from equal amounts of cerebral samples at the indicated time points. Data are from 3 mice/group in 3 independent experiments and analyzed by Student’s t test. (C) GCV treatment and cytokine levels. Levels of IL-1β, IL-18, TNF-α, and IFN-γ in cerebral samples were determined from 6 newborns/group in 3 independent experiments and analyzed by Student’s t test. (D) GCV treatment and immune cells infiltration. Percentages of leukocytes; B, T, and NK cells; neutrophils; monocytes; microglia; and macrophages in total cells of the cerebrum from P7 newborns were assessed by flow cytometry. Data were collected from 12 newborns/group and analyzed by Student’s t test. (E) GCV treatment and pyroptosis. Both full-length and active GSDMD (GSDMD-FL and -N) and IE1 (indicated by arrows) in cerebral lysates were detected by Western blot. GAPDH served as a loading control. For all statistical tests, results are presented as mean ± SEM. *P < 0.05; **P < 0.01; ***P < 0.001.
Figure 10
Figure 10. Impact of neonatal GCV treatment on neuroimaging abnormalities and brain calcification.
(A) Neuroimaging by CT after GCV treatment. Neuroimaging by CT was applied to assess brain damage of mice at P14. Representative CT images with cerebral calcification outlined by white dashed lines are shown. The calcification volume was estimated using imaging software. The percentage of calcification volume relative to that of the MCMV group was calculated. Data were analyzed by 2-tailed Student’s t test and results are presented as means ± SEMs. **P < 0.01. Scale bar: 2 mm. (B) GCV treatment, tissue loss, and cerebral calcification by IHC. Position-matched adjacent sequential coronal cerebral sections of mice in each group at P14 were stained with HE for brain architecture and with von Kossa and Alizarin red for cerebral calcium deposition. Scale bar: 1 mm; 50 μm (magnified images).
Figure 11
Figure 11. GCV treatment and neurological functions.
(A) GCV treatment and hearing ability. Hearing ability was determined by ABR test on mice in 4 groups (naive, mock, MCMV, and MCMV+GCV). Examples of 10 ms audiograms of mice from each group over a range of frequencies (clicks) are shown. ABR thresholds were recorded and analyzed by 1-way ANOVA. (B) GCV treatment and short-term learning-memory ability. Short-term learning-memory was assessed by fear conditioning test. Proportion of freezing time and number of freezing events were recorded. Data were analyzed by 1-way ANOVA. (C) GCV treatment and anxiety-like behavior in EPMT. The general anxiety to open spaces was evaluated by the EPMT. Representative heatmaps of mouse movement tracks and durations are shown. Time spent in the open arms (indicated by white dashed line), percentage of entries to the open arms versus total counts, and number of rearing events of mice were recorded. Data were analyzed by 1-way ANOVA. (D) GCV treatment and anxiety-like behavior in OFT. OFT was performed to assess anxiety-like behavior to open area. Representative heatmaps of movement tracks and durations are shown. Total traveled distance, percentage of time traveled in the center, and number of rearing events were measured. Data were analyzed by 1-way ANOVA. (E) GCV treatment and spatial learning-memory. Spatial learning-memory abilities were determined by MWM test. Mice were trained in the maze for 6 days and tested on the eighth day. Representative heatmaps of movement tracks and durations are shown. Total time of finding the target platform from day 1 to day 6 and the percentages of time in second quadrant on day 8 were recorded. Data were analyzed by 1-way ANOVA at each time point. For all statistical tests, results are presented as mean ± SEM. *P < 0.05; **P < 0.01; ***P < 0.001.

References

    1. Manicklal S, et al. The “silent” global burden of congenital cytomegalovirus. Clin Microbiol Rev. 2013;26(1):86–102. doi: 10.1128/CMR.00062-12. - DOI - PMC - PubMed
    1. Kenneson A, Cannon MJ. Review and meta-analysis of the epidemiology of congenital cytomegalovirus (CMV) infection. Rev Med Virol. 2007;17(4):253–276. doi: 10.1002/rmv.535. - DOI - PubMed
    1. Smith MG. Propagation in tissue cultures of a cytopathogenic virus from human salivary gland virus (SGV) disease. Proc Soc Exp Biol Med. 1956;92(2):424–430. doi: 10.3181/00379727-92-22498. - DOI - PubMed
    1. Cheeran MC, et al. Neuropathogenesis of congenital cytomegalovirus infection: disease mechanisms and prospects for intervention. Clin Microbiol Rev. 2009;22(1):99–126. doi: 10.1128/CMR.00023-08. - DOI - PMC - PubMed
    1. Li X-J, et al. Human cytomegalovirus infection dysregulates the localization and stability of NICD1 and Jag1 in neural progenitor cells. J Virol. 2015;89(13):6792–6804. doi: 10.1128/JVI.00351-15. - DOI - PMC - PubMed

Publication types