. 2022 Mar;34(11):e2106829.
doi: 10.1002/adma.202106829. Epub 2022 Feb 6.

Stretchable Mesh Nanoelectronics for 3D Single-Cell Chronic Electrophysiology from Developing Brain Organoids

Affiliations

Stretchable Mesh Nanoelectronics for 3D Single-Cell Chronic Electrophysiology from Developing Brain Organoids

Paul Le Floch et al. Adv Mater. 2022 Mar.

Abstract

Human induced pluripotent stem cell derived brain organoids have shown great potential for studies of human brain development and neurological disorders. However, quantifying the evolution of the electrical properties of brain organoids during development is currently limited by the measurement techniques, which cannot provide long-term stable 3D bioelectrical interfaces with developing brain organoids. Here, a cyborg brain organoid platform is reported, in which "tissue-like" stretchable mesh nanoelectronics are designed to match the mechanical properties of brain organoids and to be folded by the organogenetic process of progenitor or stem cells, distributing stretchable electrode arrays across the 3D organoids. The tissue-wide integrated stretchable electrode arrays show no interruption to brain organoid development, adapt to the volume and morphological changes during brain organoid organogenesis, and provide long-term stable electrical contacts with neurons within brain organoids during development. The seamless and noninvasive coupling of electrodes to neurons enables long-term stable, continuous recording and captures the emergence of single-cell action potentials from early-stage brain organoid development.

Keywords: bioelectronics; brain organoids; electrophysiology; nanoelectronics; neural interface; stretchable electronics.


Conflict of interest statement

Conflict of interests

The authors declare no financial or commercial conflicts of interest.

Figures
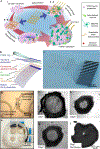
Figure 1.
Figure 1.. Stretchable mesh nanoelectronics for brain organoid integration.
a, Schematics illustrate the stepwise integration of stretchable mesh nanoelectronics into 3D hiPSC-derived neural tissues through cell self-organization and brain organoids through organogenesis. (I) Human induced pluripotent stem cells (hiPSCs) were seeded with Matrigel. (II) Lamination of stretchable mesh nanoelectronics onto the two-dimensional (2D) cell sheet after neuronal differentiation into neural progenitors (II-A) or lamination of stretchable mesh nanoelectronics onto the hiPSCs before neuronal differentiation (II-B). (III) The 2D-to-3D self-organization folds the 2D cell sheet/nanoelectronics hybrid into a 3D structure. 3D embedded sensors are connected to external recording electronics to keep monitoring the electrophysiology of hiPSC-derived neurons and neural progenitors. b, Exploded view of the stretchable mesh nanoelectronics design consisting of (from top to bottom) an 800-nm-thick top SU-8 encapsulation layer, a 50-nm-thick platinum (Pt) electrode layer electroplated with Pt black, a 40-nm-thick gold (Au) interconnects layer, and an 800-nm-thick bottom SU-8 encapsulation layer. The serpentine layout of interconnects is designed to enable stretchability. A polydimethylsiloxane (PDMS) ring is bonded around the device as a chamber to define the size and initial cell number in the seeded hiPSC sheet. c, Optical photograph of stretchable mesh nanoelectronics released from the substrate and floating in the saline solution. d, Optical bright-field (BF) microscopic image of stretchable mesh nanoelectronics before released from the fabrication substrate shows a single Pt electrode coated with Pt black. e, Optical photograph of a 2×2 devices well, with a single culture chamber for 4 cyborg brain organoids cultured simultaneously. f-h, Optical phase images of hiPSC-derived neurons integrated with stretchable mesh nanoelectronics from Day 1 to Day 5 show that the 2D cell sheet with embedded stretchable mesh nanoelectronics self-folded into a 3D cyborg brain organoid. Black numbers and arrows indicate the input/output (I/O) stretchable connectors for the 16-channel electrode array (g). White arrows highlight the stretchable anchors used to keep the stretchable mesh nanoelectronics unfolded on the substrate, which were released after seeding with cells (g). i, Optical phase images of organoid without nanoelectronics integrated at Day 1 of culture as control showing minimal interruption from the integration with stretchable mesh nanoelectronics to the organogenesis of brain organoids.
Figure 2.
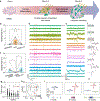
Figure 2.. Long-term tracking neural activities by stretchable mesh nanoelectronics.
a, Schematic of the stepwise assembly of mesh nanoelectronics with hiPSC-derived neurons. b, Injection of KCl produces a significant increase in spiking rate of signals detected by multiple electrodes. c, Injection of CNQX and D-AP5 produces a significant decrease in spiking rate of signals detected by multiple electrodes (n = 8, bar plots show mean ± S.D.). * P<0.05, two-tailed, paired t-test. d, Raw voltage traces of a 16-channel device showing neural activities at month 5 of differentiation (i.e., month 1 of assembly). e, Zoom-in panels from the red dashed box (d). f, Single-spike waveforms (mean ± S.D.) extracted from the voltage traces filtered by 100 Hz-3000 band-pass filter, for each cluster detected by spike sorting. Vertical scale bars, 20μV. g, Full width at half minimum (FWHm) of depolarization of each neuron detected on hiPSC-derived neural tissues as a function of culture time (mean ± S.D., * P< 0.05 using one-way ANOVA with the month 5 group as control). h, Normalized phase plot of single-unit action potentials (inset) detected on the same channel at months 6 and 7 post-differentiation, showing an increase in the depolarization’s speed. i, Single-unit action potentials (top) and corresponding raster plots (bottom) detected from the same channel at 5, 6, and 10 months of culture.
Figure 3.
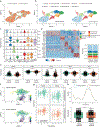
Figure 3.. Single-cell RNA sequencing of cyborg and control human brain organoids.
a, UMAP visualization of single-cell RNA expression in cyborg and control organoids. Cells are colored by cell identities. (n = 9,920 cells. 5,240 and 3,980 cells from cyborg and control brain organoids, respectively). b, UMAP visualization of single-cell RNA expression in cyborg and control brain organoids. Cells are colored by the cell type assignment. c, Violin plots of marker genes expressions across cell types in brain organoids. Colors correspond to cell types, and the colored area indicates the density distribution of each gene. d, Heatmap showing the row z-scored expression of the markers for each cell type from cyborg and control brain organoids (left). Cell-type compositions in cyborg and control organoids (right). Colors correspond to cell types. e, Violin plot of neuron marker gene expression in cyborg and control brain organoids. Colors correspond to their identities. (two-tailed, unpaired t-test). f, UMAP visualization of single-cell RNA expression from neuron populations in cyborg (up) and control brain organoid (down). Cells are colored by the pseudotime value obtained by Monocle3. g, Neuron marker gene expressions along pseudotime from (f) in cyborg (up) and control brain organoid (down). Colors correspond to cell identities. Ellipse draws a 95% confidence level for a multivariate t-distribution. h, Distribution plot (up) and boxplot (down) of pseudotime from neurons in cyborg and control brain organoids (two-tailed, unpaired t-test). Colors correspond to cell identities.
Figure 4.
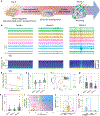
Figure 4.. Electrical recording of human brain organoids during early development.
a, Schematics of the stepwise assembly of mesh nanoelectronics with hiPSCs for cyborg brain organoids. b, Raw voltage traces at 1, 2, and 3 months after cortical differentiation c, Spectrograms at 1, 2, and 3 months of differentiation for channel 3 showing a strong increase in power between 0 to 1 kHz after 3 months of differentiation. * Denotes voltage artifacts. d, Corresponding power spectrums to (c). e, Signal power at 300 Hz for electrodes with detected neural activity. f, Normalized phase plot of single-unit action potentials and its corresponding waveforms (inset) detected from the same channel at 2 and 3 months of differentiation, showing an increase in the rate of depolarization. g-h, FWHm of depolarization (g), and spike count per neurons per 2-min recording (h) at 1, 2, and 3 months of differentiation. i, Spiking rate per neuron detected as a function of the inverse of the FWHm of depolarization, showing that the single-cell action potential spikes from neurons evolve towards shorter spike width and higher spiking rate over the time course of brain organoid development. In panels (e, g), value=mean ± S.D., ** P<0.01, one-way ANOVA with “Month 1” group as control. j, Injection of bicuculline (BCC) produces a significant increase in the spiking rate of signals detected by multiple electrodes. k, Injection of CNQX and D-AP5 produces a significant decrease in spiking rate of signals detected by multiple electrodes (n = 4 electrodes including data from p = 2 different cyborg brain organoids, bar plots show mean ± S.D.). * P<0.05, two-tailed, paired t-test.
Figure 5.
Figure 5.. Electrophysiology of human brain organoids during the early developmental stage.
a, 3D views of reconstructed fluorescence images of tissue cleared, immunostained cyborg brain organoids at month 3 of differentiation. Red, green, and blue colors correspond to Device, Tuj 1, and 4′,6-diamidino-2-phenylindole (DAPI), respectively. White arrows highlight the position of the representative sensors. Channel number was read out through the fluorescence electronic barcode identification. (b, c) 3D positions of the 16 sensors in the cyborg brain organoid from (a) in two different planes. Average waveforms (± S.D.) detected at Month 3 of integration are indicated for each sensor. Vertical scale bars, 25 μV. d, Theta oscillations (4–8 Hz band) measured in the cyborg brain organoid shown in panel (a), at Month 3 of integration. The vertical lines show a clear dephasing between the different electrodes. e, Comparison of the full width at half minimum (FWHm) of neuron’s depolarization at months 1 and 3 of early-stage (cyborg brain organoids, n=6) and month 5 (cyborg hiPSC-derived neural tissues, n=5) of long-term electrophysiological recordings (mean ± S.D., ** P<0.01 and **** P<0.0001, one-way ANOVA with the group “cyborg brain organoids, month 1” as control).

Similar articles

Cited by

References

    1. Trujillo CA, Gao R, Negraes PD, Gu J, Buchanan J, Preissl S, Wang A, Wu W, Haddad GG, Chaim IA, Domissy A, Vandenberghe M, Devor A, Yeo GW, Voytek B, Muotri AR, Cell Stem Cell 2019, 25, 558. - PMC - PubMed
    1. McPartland JC, Curr. Opin. Neurol. 2016, 29, 118. - PMC - PubMed
    1. Jeste SS, Frohlich J, Loo SK, Curr. Opin. Neurol. 2015, 28, 110. - PMC - PubMed
    1. Kelava I, Lancaster MA, Dev. Biol. 2016, 420, 199. - PMC - PubMed
    1. Koo B, Choi B, Park H, Yoon KJ, Mol. Cells 2019, 42, 617. - PMC - PubMed

LinkOut - more resources