. 2022 Feb 23;14(633):eabk3445.
doi: 10.1126/scitranslmed.abk3445. Epub 2022 Feb 23.

Predicting the mutational drivers of future SARS-CoV-2 variants of concern

Affiliations

Predicting the mutational drivers of future SARS-CoV-2 variants of concern

M Cyrus Maher et al. Sci Transl Med. .

Abstract

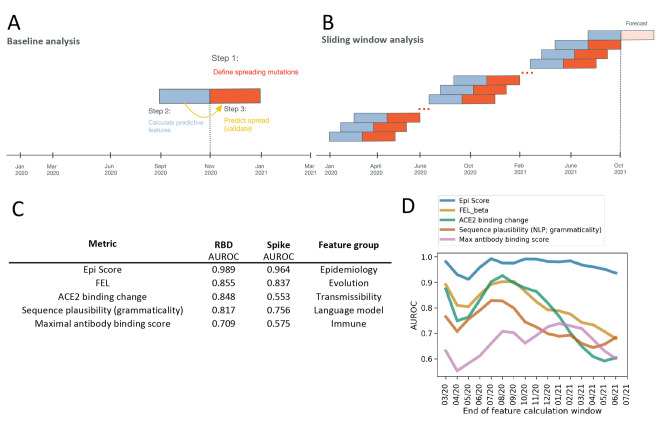
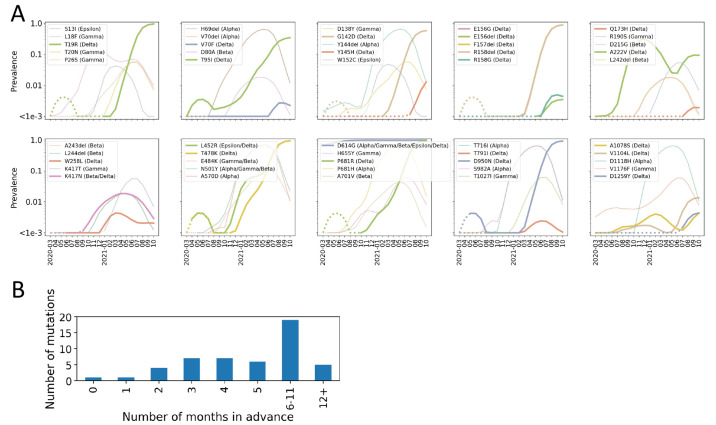
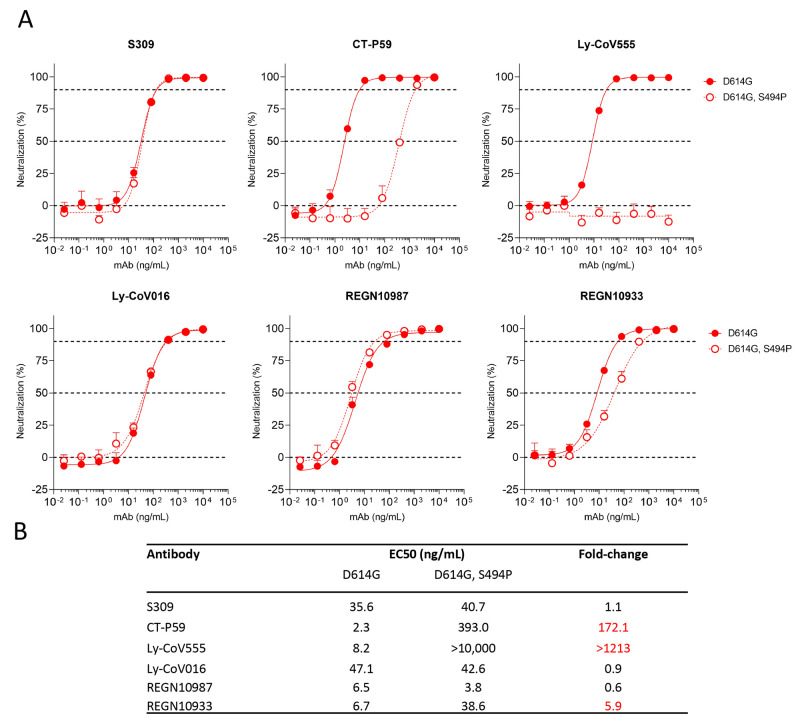
SARS-CoV-2 evolution threatens vaccine- and natural infection-derived immunity as well as the efficacy of therapeutic antibodies. To improve public health preparedness, we sought to predict which existing amino acid mutations in SARS-CoV-2 might contribute to future variants of concern. We tested the predictive value of features comprising epidemiology, evolution, immunology, and neural network-based protein sequence modeling, and identified primary biological drivers of SARS-CoV-2 intra-pandemic evolution. We found evidence that ACE2-mediated transmissibility and resistance to population-level host immunity has waxed and waned as a primary driver of SARS-CoV-2 evolution over time. We retroactively identified with high accuracy (area under the receiver operator characteristic curve, AUROC=0.92-0.97) mutations that will spread, at up to four months in advance, across different phases of the pandemic. The behavior of the model was consistent with a plausible causal structure wherein epidemiological covariates combine the effects of diverse and shifting drivers of viral fitness. We applied our model to forecast mutations that will spread in the future and characterize how these mutations affect the binding of therapeutic antibodies. These findings demonstrate that it is possible to forecast the driver mutations that could appear in emerging SARS-CoV-2 variants of concern. We validate this result against Omicron, showing elevated predictive scores for its component mutations prior to emergence, and rapid score increase across daily forecasts during emergence. This modeling approach may be applied to any rapidly evolving pathogens with sufficiently dense genomic surveillance data, such as influenza, and unknown future pandemic viruses.


Figures

Fig. 1.
Fig. 1.
Predicting mutation spread. (A) Analyzing performance at baseline and over time. The core analysis consists of three steps. First, creating a working definition for spreading mutations. Second, calculating features that can predict future spread using a window of prior data. Third, having constructed models on training data, run prediction of future spread (Forecast), and interpret the results. (B) Performance was assessed over time by repeating this analysis in sliding time windows covering the whole data collection period. (C) The most predictive metrics within each feature group at baseline (see Table 1 and table S1) were ranked by performance within the receptor binding domain (RBD), where the most data are available and for the Spike. (D) RBD classification accuracy over time for the top GISAID-based feature (Epi Score), and the top transmission and immune variables (Table 1). AUROCs in panel D are smoothed with a rolling window of two analysis periods. AUROC, area under the receiver operating characteristic curve. FEL, fixed effects model for detecting site-wise selective pressure.
Fig. 2.
Fig. 2.
Early detection of variant mutations. (A) Depiction of where in their growth trajectories current and former VOC/VOI mutations were first forecast to spread. Dotted lines denote the part of the curve where the variant had not yet been forecast to spread. Solid lines denote the period after first forecast. Delta-defining variants are shown by thick lines. Mutations are presented in genomic order. (B) The number of months between when the mutations presented in (A) were forecast and when they reached a prevalence of 1% globally.
Fig. 3.
Fig. 3.
Epi Score mediates effects captured by other data sources. (A) Causal model: mutation fitness drives viral prevalence at time 1 (as measured by global frequency, and geographic and haplotype distribution, Epi Score). Language model score or evolutionary metrics are summaries of GISAID data and therefore are shaped by mutation prevalence. Prevalence at time 1 predicts prevalence at time 2, which ultimately leads to mutation being defined as spreading. Therefore, prevalence at time 1 (as captured by Epi Score) mediate the effects of the biological variables that enhance viral fitness through transmissibility or escape adaptation. (B) To quantitatively test for mediation, we assessed whether variables were better at predicting mutations in the top 5% of Epi Scores, compared to spreading mutations for time 2 versus time 1. “Combo AUC” refers to the combined AUC of that variable with Epi Score. Significant improvements of the combined model over that of Epi Score alone would indicate complementarity, and therefore predictive information not captured by Epi Score alone.
Fig. 4.
Fig. 4.
Emergence and spread of Omicron. (A) The Epi Scores of 37 Omicron-defining mutations are shown as of December 8, 2021 (red dots). (B) Although some of the mutations in Omicron already had very high Epi Scores and were widely spread, emergent mutations were distinguished by the progressively increasing Epi Score between April 2020 and August 2021 preceding the rapid acceleration at the end of 2021. Shown are mean and confidence interval Epi Score values. Other: Epi Score of all other mutations in the SARS-CoV-2 spike.
Fig. 5.
Fig. 5.
S494P mutation decreases neutralization potential of three clinically approved therapeutic antibodies. (A) VSV-SARS-CoV-2 pseudovirus was generated based on the “Wuhan-Hu-1” sequence with either the D614G mutation or D614G and S494P mutations. Virus neutralization was measured in a microneutralization assay on Vero E6 cells. Example results from one repeat are shown. (B) EC50 values and fold-changes were calculated from two independent experiments. S309 is the parent molecule of VIR-7831, which had been previously evaluated on the S494P variant and showed no change in neutralization (25
Fig. 6.
Fig. 6.
Manhattan-style plot of Epi Scores across the SARS-CoV-2 Delta proteome. (A) For visualization purposes, Epi Scores have been calculated as Z-scores, which correlate to the default, rank-based calculation as a spearman R > 0.99. Points highlighted in color occur at a frequency over 0.1% on a Delta background (B.1.617.2 + AY lineages) and occur at significantly positively selected sites (FEL FDR-adjusted q-value < 0.05). All mutations occurring at over 80% frequency, in the lineages accounting for >80% of all Delta cases, were excluded from the visualization. Thus, the plot serves to highlight variants predicted to spread and under positive selection in the current Delta background. For a complete listing, Suppl. File S2. (B) The rate per 100 amino acids of highlighted forecasted mutations from panel A, per gene in the SARS-CoV-2 proteome.

References

    1. McCallum M., De Marco A., Lempp F. A., Tortorici M. A., Pinto D., Walls A. C., Beltramello M., Chen A., Liu Z., Zatta F., Zepeda S., di Iulio J., Bowen J. E., Montiel-Ruiz M., Zhou J., Rosen L. E., Bianchi S., Guarino B., Fregni C. S., Abdelnabi R., Foo S. C., Rothlauf P. W., Bloyet L.-M., Benigni F., Cameroni E., Neyts J., Riva A., Snell G., Telenti A., Whelan S. P. J., Virgin H. W., Corti D., Pizzuto M. S., Veesler D., N-terminal domain antigenic mapping reveals a site of vulnerability for SARS-CoV-2. Cell 184, 2332–2347.e16 (2021). 10.1016/j.cell.2021.03.028 - DOI - PMC - PubMed
    1. Elbe S., Buckland-Merrett G., Data, disease and diplomacy: GISAID’s innovative contribution to global health. Glob. Chall. 1, 33–46 (2017). 10.1002/gch2.1018 - DOI - PMC - PubMed
    1. C. for D. Control, SARS-CoV-2 Variants of Concern (available at https://www.cdc.gov/coronavirus/2019-ncov/cases-updates/variant-surveill...).
    1. Adiga A., Wang L., Hurt B., Peddireddy A., Porebski P., Venkatramanan S., Lewis B., Marathe M., All Models Are Useful: Bayesian Ensembling for Robust High Resolution COVID-19 Forecasting. Medrxiv, 2021.03.12.21253495 (2021). 10.1145/3447548.3467197 - DOI
    1. Zhao H., Merchant N. N., McNulty A., Radcliff T. A., Cote M. J., Fischer R. S. B., Sang H., Ory M. G., COVID-19: Short term prediction model using daily incidence data. PLOS ONE 16, e0250110 (2021). 10.1371/journal.pone.0250110 - DOI - PMC - PubMed

Publication types

Supplementary concepts