. 2022 Feb 7;219(2):e20211191.
doi: 10.1084/jem.20211191. Epub 2022 Jan 11.

CD127 imprints functional heterogeneity to diversify monocyte responses in inflammatory diseases

Affiliations

CD127 imprints functional heterogeneity to diversify monocyte responses in inflammatory diseases

Bin Zhang et al. J Exp Med. .

Abstract

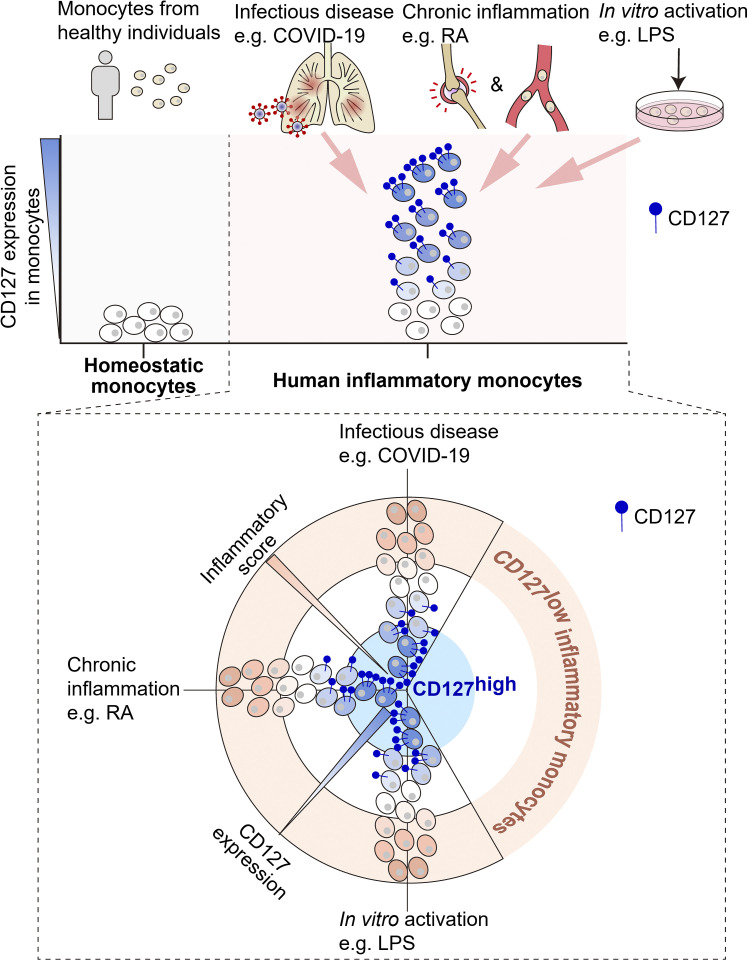
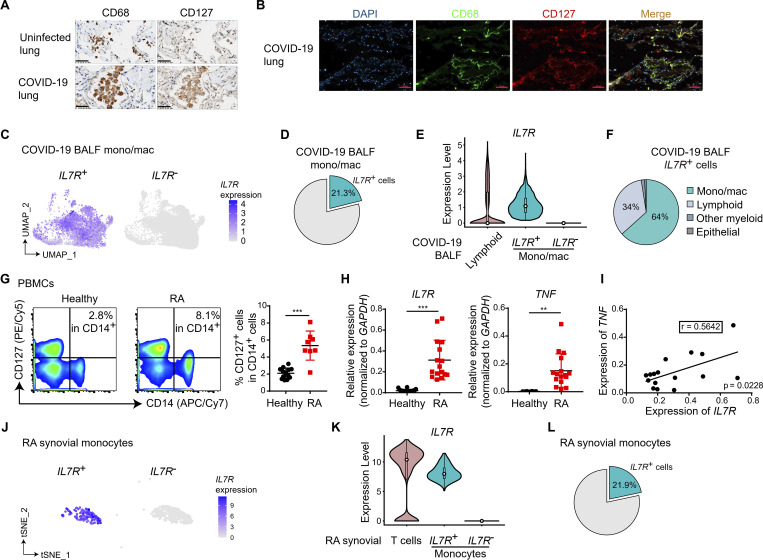
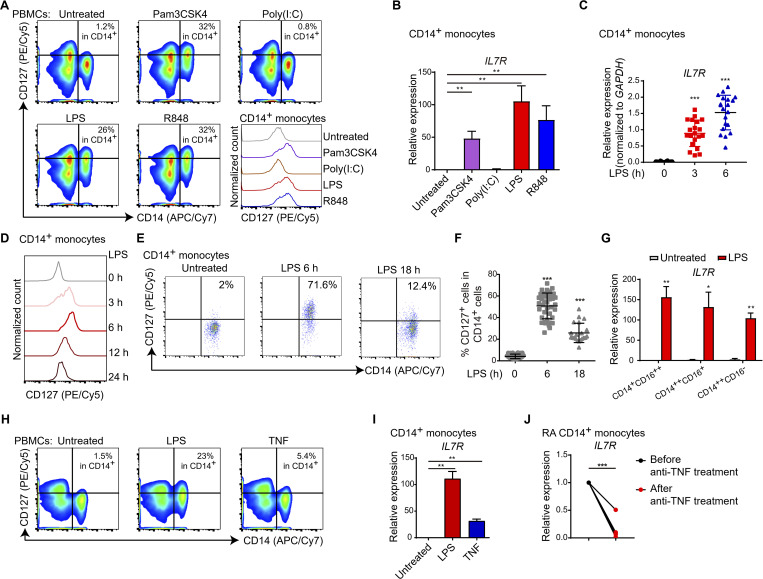
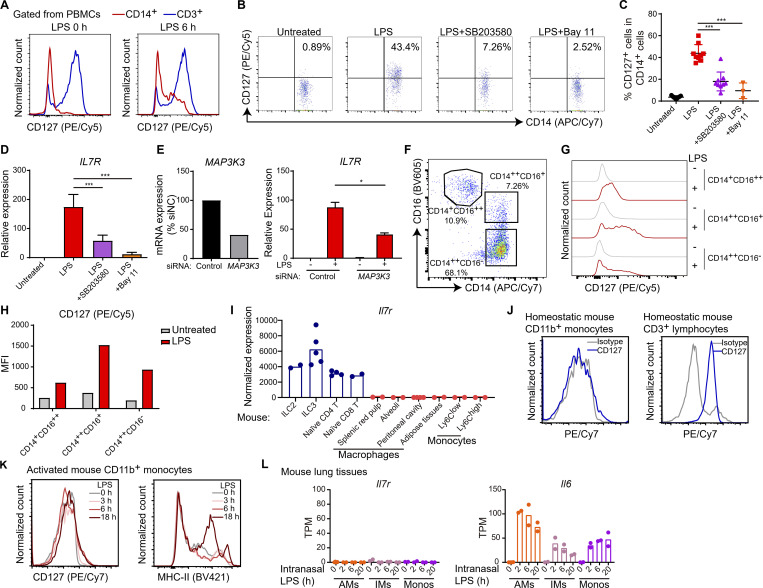
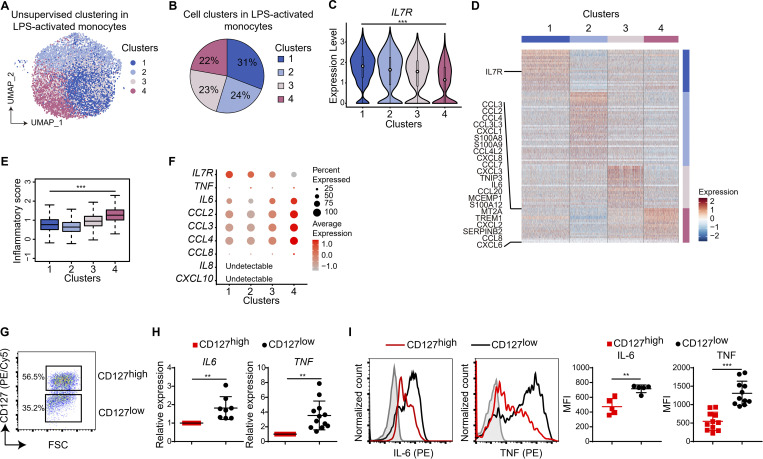
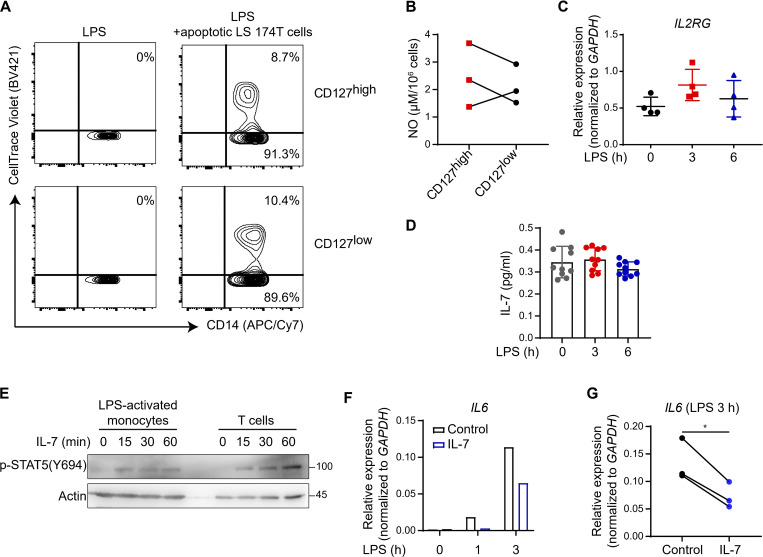
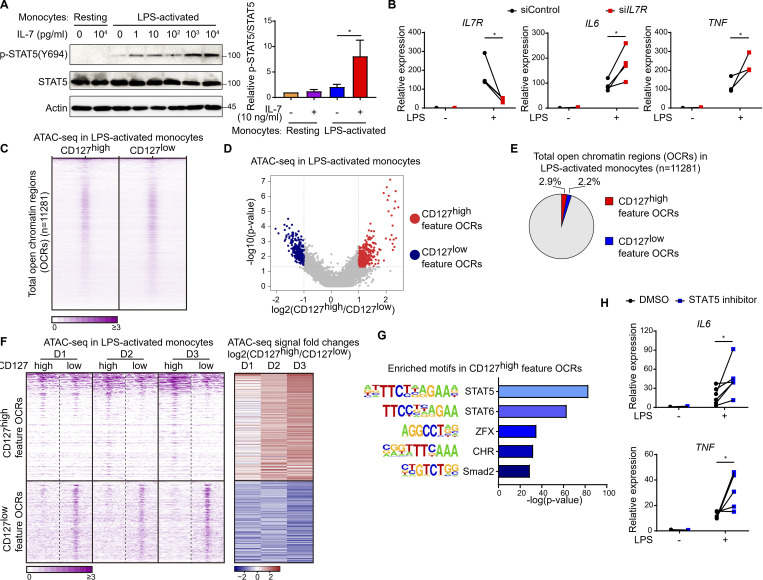
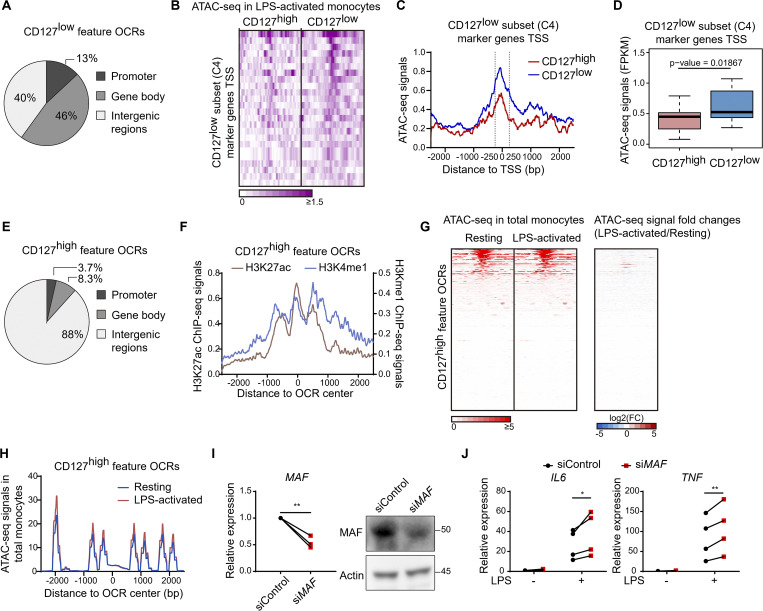
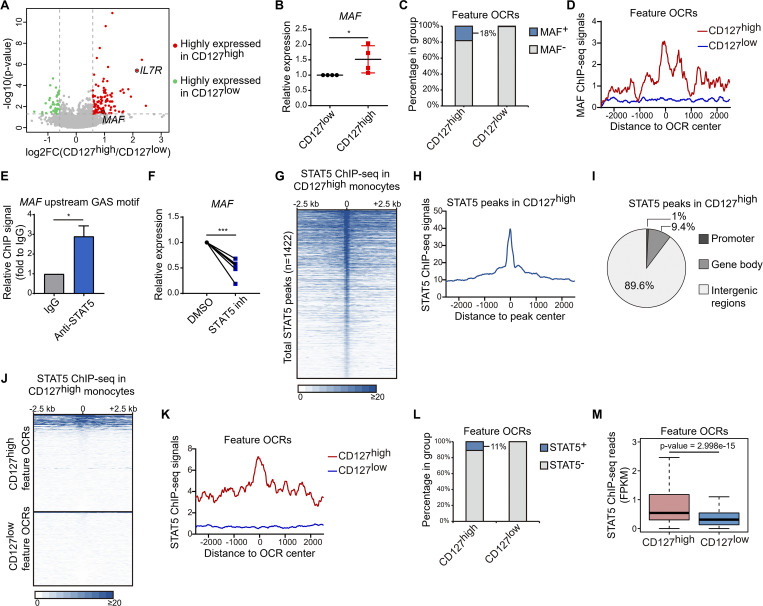
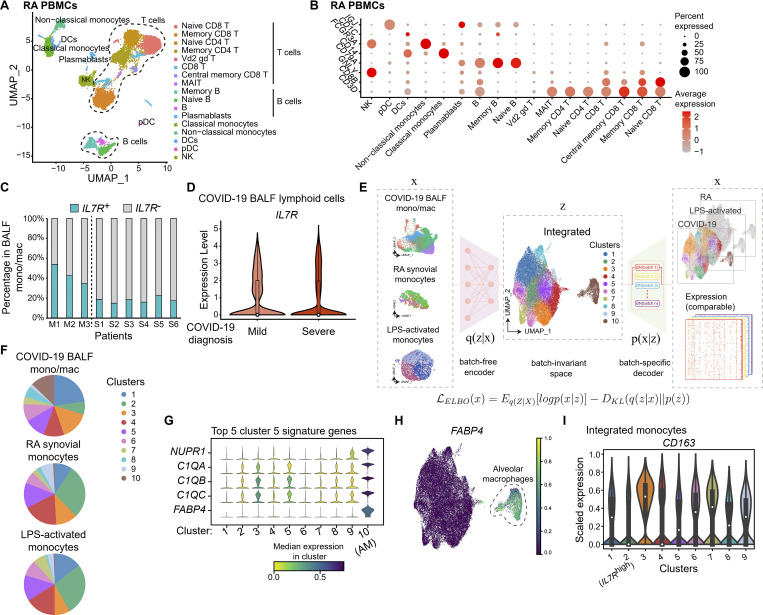
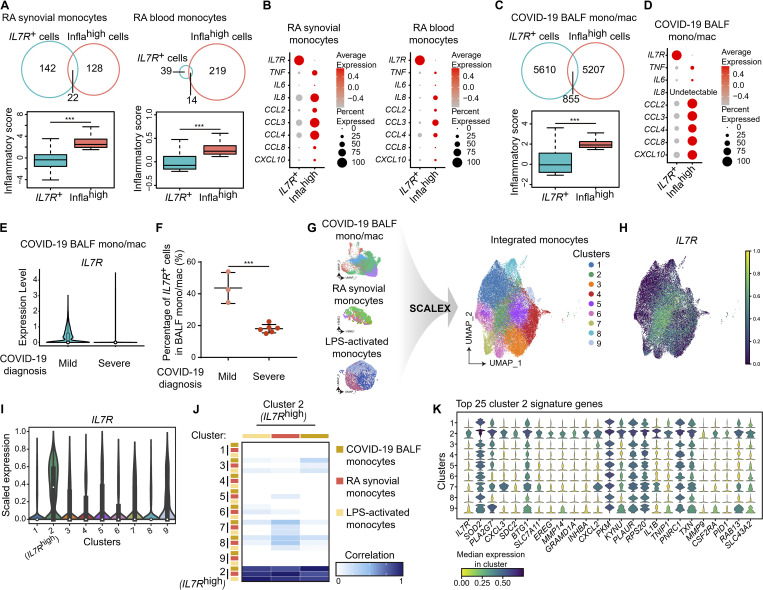
Inflammatory monocytes are key mediators of acute and chronic inflammation; yet, their functional diversity remains obscure. Single-cell transcriptome analyses of human inflammatory monocytes from COVID-19 and rheumatoid arthritis patients revealed a subset of cells positive for CD127, an IL-7 receptor subunit, and such positivity rendered otherwise inert monocytes responsive to IL-7. Active IL-7 signaling engaged epigenetically coupled, STAT5-coordinated transcriptional programs to restrain inflammatory gene expression, resulting in inverse correlation between CD127 expression and inflammatory phenotypes in a seemingly homogeneous monocyte population. In COVID-19 and rheumatoid arthritis, CD127 marked a subset of monocytes/macrophages that retained hypoinflammatory phenotypes within the highly inflammatory tissue environments. Furthermore, generation of an integrated expression atlas revealed unified features of human inflammatory monocytes across different diseases and different tissues, exemplified by those of the CD127high subset. Overall, we phenotypically and molecularly characterized CD127-imprinted functional heterogeneity of human inflammatory monocytes with direct relevance for inflammatory diseases.


Conflict of interest statement

Disclosures: The authors declare no competing interests exist.

Figures

None
Graphical abstract
Figure 1.
Figure 1.
CD127high monocytes/macrophages are hallmarks of human inflammatory conditions. (A and B) Immunohistochemical analysis of CD68 and CD127 expression in lung tissues sections are shown in A. Immunofluorescence staining for DAPI (blue), CD68 (green), and CD127 (red) in sections from COVID-19 lung tissues are shown in B. Uninfected lung tissues and COVID-19 lung tissues were obtained during autopsy as described in Materials and methods. One representative result from tissue sections of three COVID-19 cases is shown. Scale bar, 50 µm. (C) UMAP projection of IL7R+ and IL7R monocytes/macrophages (mono/mac) in BALF from nine COVID-19 patients (see Materials and methods for details). IL7R expression is shown by the indicated colors. (D) Pie graph shows the percentage of IL7R+ cells in COVID-19 BALF mono/mac. (E) Violin plot shows the expression levels of IL7R in lymphoid cells and IL7R+ and IL7R mono/mac from COVID-19 patient BALF. Each overlaid box indicates the interquartile range with median shown as a circle. (F) Pie graph shows the percentages of each cell type in total IL7R+ BALF cells from COVID-19 patients. (G) PBMCs were obtained from healthy donors (n = 13) and RA patients (n = 8), and CD127 expression was measured by FACS analysis. Representative FACS plot (left) and cumulative percentages (right) of CD127+ population in CD14+ monocytes are shown. ***, P < 0.001 by unpaired t test. Data are shown as the mean ± SD. (H) In CD14+ monocytes from PBMCs of healthy donors and RA patients, mRNA of IL7R and TNF was measured by qPCR. Relative expression was normalized to internal control (GAPDH). **, P < 0.01; ***, P < 0.001; unpaired t test. Data are shown as the mean ± SD (IL7R, healthy n = 20 and RA n = 16; TNF, healthy n = 8 and RA n = 16). (I) Linear regression analysis for the expression of TNF and IL7R in CD14+ monocytes from each RA patient in H. Correlation coefficient r and P value by F-test are labeled. (J) t-Distributed stochastic neighbor embedding (tSNE) projection of IL7R+ and IL7R cells in RA synovial monocytes (see Materials and methods for details). IL7R expression is shown by the indicated colors. (K) Violin plot shows the expression levels of IL7R in T cells and IL7R+ and IL7R monocytes in RA synovial tissues. Each overlaid box indicates the interquartile range with median shown as a circle. (L) Pie graph shows the percentage of IL7R+ cells in RA synovial monocytes. Each data point in G–I represents one individual donor or patient.
Figure S1.
Figure S1.
Clustering analyses of scRNA-seq datasets. (A) UMAP projection of BALF cells from COVID-19 patients. Cell type annotations were labeled for each cluster. Monocyte/macrophage clusters (CD14high CD68high) were used for the subsequent analyses. (B) t-Distributed stochastic neighbor embedding (t-SNE) projection of synovial cells from RA patients. Cell type annotations were labeled for each cluster. T, M, F, and B represent T cell, monocytes, fibroblasts, and B cells, respectively. Monocyte clusters (CD14high) were used for the subsequent analyses. mDC, myeloid dendritic cells; NK, natural killer cells; pDC, plasmacytoid dendritic cells.
Figure 2.
Figure 2.
CD127high monocytes are inducible by exogenous and endogenous inflammatory stimuli. (A and B) Cells obtained from healthy blood donors were stimulated with Pam3CSK4 (100 ng/ml), polyinosinic:polycytidylic acid (Poly(I:C); 1 µg/ml), LPS (10 ng/ml), or R848 (1 µg/ml) as indicated. CD127 expression in PBMCs with 6-h stimulation was measured by FACS. One representative FACS result from three independent experiments is shown (A), and histograms in A show the CD127 staining signal in CD14+ cells under each indicated condition. In CD14+ monocytes from healthy donor PBMCs upon 3-h stimulation, mRNA of IL7R was measured by qPCR (B). Relative expression was normalized to internal control (GAPDH) and expressed relative to untreated sample. **, P < 0.01 by paired t test. Data are shown as the mean ± SD of four independent experiments. (C) CD14+ monocytes were treated with 10 ng/ml LPS for 3 h and 6 h, and mRNA of IL7R was measured by qPCR. Relative expression was normalized to internal control (GAPDH). ***, P < 0.001 by unpaired t test. Data are shown as the mean ± SD of 20 independent experiments. (D) Analysis of CD127 expression by FACS in CD14+ monocytes during the time course of LPS stimulation (10 ng/ml) as indicated. (E and F) CD14+ monocytes were treated with or without 10 ng/ml LPS for the indicated time points, and CD127 expression was measured by FACS. Representative FACS distribution (E) and cumulative percentage (F) are shown. ***, P < 0.001 represents comparison of LPS-stimulated samples with unstimulated samples by unpaired t test. Data are shown as the mean ± SD of multiple independent experiments. LPS 0 h, n = 39; LPS 6 h, n = 39; LPS 18 h, n = 21. (G) Three monocyte subsets were FACS sorted from PBMCs as shown in Fig. S2 F and then were treated with or without 10 ng/ml LPS for 3 h. IL7R expression was measured by qPCR. Relative expression was normalized to internal control (GAPDH) and expressed relative to LPS-untreated CD14+CD16++ sample. **, P < 0.01; *, P < 0.05; unpaired t test. Data are shown as the mean ± SD of three independent experiments. (H and I) PBMCs from healthy donors were treated with LPS (10 ng/ml) or human TNF (100 ng/ml). Upon 6-h LPS or TNF treatment, CD127 expression was measured by FACS. Representative FACS distribution is shown (H). mRNA of IL7R was measured in 3-h LPS- or TNF-treated CD14+ monocytes by qPCR (I). Relative expression was normalized to internal control (GAPDH) and expressed relative to untreated sample. **, P < 0.01 by paired t test. Data in I are shown as the mean ± SD of three independent experiments. (J) mRNA level of IL7R was measured by qPCR in monocytes from RA patients (n = 5) before and after etanercept anti-TNF treatment for 2 mo. Relative expression was normalized to internal control (GAPDH), expressed relative to before treatment sample, and shown as the paired data points for before and after treatment samples in each patient. ***, P < 0.001 by paired t test. Independent experiments in A–I were performed with cells from one healthy donor for each experiment.
Figure S2.
Figure S2.
Elicited CD127 expression represents a common but unique feature for activated human monocytes and is induced by TLR signaling. (A) PBMCs from healthy donors were treated with or without 6-h LPS stimulation (10 ng/ml), and CD127 expression in CD3+ T cells and CD14+ monocytes was analyzed by FACS in each condition. Representative FACS distributions are shown from three independent experiments. (B and C) PBMCs form healthy donors were pretreated with DMSO or 10 µM SB203580 or 10 µM Bay 11-7082 (Bay 11) for 30 min and subsequently stimulated with or without 10 ng/ml LPS for 6 h as indicated. The protein levels of CD127 were measured by FACS and are shown as representative FACS distribution (B) and cumulative percentages (C) in CD14+ monocytes. ***, P < 0.001 by unpaired t test. Each data point represents an independent experiment. Data are shown as the mean ± SD of multiple independent experiments as listed, respectively: untreated n = 9, LPS n = 9, SB203580 n = 9, Bay 11-7082 n = 3. (D) CD14+ selected monocytes from healthy donors were pretreated with DMSO or 10 µM SB203580 or 10 µM Bay 11-7082 (Bay 11) for 30 min and subsequently stimulated with or without 10 ng/ml LPS for 6 h as indicated. mRNA of IL7R was measured by qPCR. The relative expression was normalized to internal control (GAPDH) and expressed relative to the untreated sample. ***, P < 0.001 by unpaired t test. Data are shown as the mean ± SD of multiple independent experiments as listed, respectively: untreated n = 9, LPS n = 9, SB203580 n = 6, Bay 11-7082 n = 3. (E) CD14+ monocytes were transfected with negative control or MAP3K3-specific siRNAs. 2 d after transfection, cells were stimulated with LPS (10 ng/ml) for 3 h. Knockdown efficiency of MAP3K3 was examined, and mRNA induction of IL7R by LPS stimulation in siControl and siMAP3K3 transfected cells was measured by qPCR. Relative expression was normalized to internal control (GAPDH) and expressed relative to LPS untreated siControl sample. *, P < 0.05 by paired t test. IL7R expression data are shown as the mean ± SD of three independent experiments. (F–H) Three human monocyte populations were gated by CD14 and CD16 expression in FACS analysis of healthy donor PBMCs as shown in F. CD127 expression in three human monocyte populations was analyzed in conditions with or without LPS stimulation for 6 h. Representative FACS distribution (G) and mean fluorescence intensity (MFI; H) for CD127 expression are shown from three independent experiments. (I) The normalized Il7r expression level assessed by RNA-seq was obtained from the ImmGen database, and expression levels in multiple mouse immune cell types are shown, including ILC2 and ILC3 in small intestines, naive CD4 and CD8 T cells in spleens, macrophages across different tissues, and Ly6C delimited blood monocyte populations. Each data point represents each individual replicate sample included in the ImmGen database. (J and K) Mouse blood cells (red blood cells lysed) were treated with or without 100 ng/ml LPS for different time points as indicated. In the homeostatic condition, CD127 expression in mouse CD11b+ monocytes was analyzed by FACS, and expression in CD3+ lymphoid cells served as a positive control (J). Upon LPS stimulation, the expression of CD127 and MHC-II on mouse CD11b+ monocytes was analyzed by FACS (K). (L) The published RNA-seq datasets were generated in macrophages and monocytes isolated from mouse lung tissues, where mice were intranasally treated with 10 µg LPS per mouse for different time points. The expression levels (gene-specific transcripts per million total transcripts [TPMs]) of Il7r and Il6 were assessed and are shown across alveolar macrophages (AMs), interstitial macrophages (IMs), and tissue monocytes (Monos). Each data point represents each independent biological replicate in the original datasets. Independent experiments in A–H were performed with cells from one healthy donor for each experiment.
Figure 3.
Figure 3.
CD127 expression is associated with hypoinflammatory phenotypes and confers functional heterogeneity to human monocytes. (A) UMAP projection of human CD14+ monocytes treated with LPS for 6 h that were subgrouped by unsupervised clustering analysis of scRNA-seq data. (B) Pie graph shows the percentages of each monocyte cluster shown in A in LPS-activated monocytes. (C) Violin plot shows the expression levels of IL7R among four clusters of LPS-treated monocytes. Each overlaid box indicates the interquartile range with median shown as a circle. ***, P < 0.001 by Wilcoxon rank-sum test. (D) Heat map projected the cross-cluster expression of the marker genes for each cluster shown in A. Expression levels were normalized by z-score and expressed from −2.5 (blue) to +2.5 (red). IL7R and marker genes for cluster 4 are highlighted. (E) Inflammatory score was defined by average expression of eight inflammatory genes (see Materials and methods for details), and box plot shows the inflammatory score distribution among four monocyte clusters in A. ***, P < 0.001 by Wilcoxon rank-sum test. (F) Heat map shows the expression of IL7R and eight inflammatory genes for inflammatory score calculation among four monocyte clusters in A. For each gene, scaled average expression level and ratio of expression positive cells in each cluster were represented by color and size of the dot, respectively. (G and H) CD127high and CD127low populations were isolated from 6-h LPS-stimulated CD14+ monocytes by FACS (G), and mRNAs of IL6 and TNF in two populations were measured by qPCR (H). Relative expression was normalized to internal control (GAPDH) and shown relative to CD127high sample. **, P < 0.01; ***, P < 0.001; paired t test. Data are shown as the mean ± SD of multiple independent experiments. IL6, n = 8; TNF, n = 12. FSC, forward scatter. (I) Protein levels of IL-6 and TNF in CD127high and CD127low populations were measured by GolgiStop intracellular staining and analyzed by FACS. One representative FACS plot (left) and cumulative mean fluorescence intensity (MFI; right) are shown. **, P < 0.01; ***, P < 0.001; paired t test. Data are shown as the mean ± SD of multiple independent experiments. IL-6, n = 5; TNF, n = 11. Independent experiments in G–I were performed with cells from one healthy donor for each experiment.
Figure S3.
Figure S3.
Functional CD127–STAT5 axis imposes hypoinflammatory human monocyte phenotypes. (A) CellTrace Violet–labeled human colonic epithelial cell line LS 174T cells were administered with H2O2 to induce apoptosis. Human CD14+ monocytes were treated with 10 ng/ml LPS for 6 h and subsequently cocultured with apoptotic LS 174T cells for 1 h. Phagocytosed apoptotic cells were measured by CellTrace Violet (BV421) signals in CD127high and CD127low populations in CD14+ monocytes. Representative FACS distribution is shown from three independent experiments. (B) NO production in FACS-sorted CD127high and CD127low populations from CD14+ monocytes upon LPS stimulation for 6 h. NO production was measured and expressed as NO concentration in 100 µl cell lysis for 106 sorted cells. Each pair of data points represents an independent experiment. Results from three independent experiments are shown. (C) Human CD14+ monocytes were treated with 10 ng/ml LPS for 3 h and 6 h, and the mRNA levels of IL2RG were measured by qPCR. Relative expression was normalized to GAPDH as an internal control. Each data point represents an independent experiment. Data are shown as the mean ± SD of four independent experiments. (D) IL-7 concentration in culture media of human monocytes upon LPS stimulation for the indicated times. Each data point represents an independent experiment. Data are shown as the mean ± SD of 10 independent experiments. (E) Human CD14+ monocytes were pretreated with 10 ng/ml LPS for 6 h and subsequently stimulated with recombinant human IL-7 (10 ng/ml) for the indicated times. Meanwhile, CD3+ T cells from the same donor were treated with 10 ng/ml IL-7 for the indicated times. The protein levels of p-STAT5(Y694) were detected by Western blotting. β-Actin was used as a loading control. (F and G) Human CD14+ monocytes were activated by 1 ng/ml LPS with or without 100 pg/ml IL-7 simultaneous stimulation for the indicated time points. The mRNA levels of IL6 were measured by qPCR. Relative expression was normalized to GAPDH as an internal control. One representative result from three independent experiments is shown in F. Statistical results of expression data upon 3-h indicated treatments from three independent experiments are shown in G. *, P < 0.05 by paired t test. Independent experiments in A–G were performed with cells from one healthy donor for each experiment.
Figure 4.
Figure 4.
CD127–STAT5 axis constrains inflammatory gene expression in human monocytes. (A) CD14+ monocytes were pretreated with or without LPS for 6 h, followed by various doses of human IL-7 (from 1 pg/ml to 10 ng/ml) for 30 min. STAT5 activation was detected by Western blotting. β-Actin was used as a loading control. One representative result from three independent experiments is shown (left). The protein level of p-STAT5(Y694) was quantified by densitometry, normalized to total STAT5 protein, and expressed relative to untreated (without LPS and IL-7) sample (right). *, P < 0.05; paired t test. Data are shown as the mean ± SD of three independent experiments. (B) CD14+ monocytes were transfected with negative control or IL7R-specific siRNA (siControl or siIL7R). 2 d after transfection, cells were stimulated with LPS (10 ng/ml) for 3 h, and mRNA of IL7R, IL6, and TNF were measured by qPCR. Relative expression was normalized to an internal control (GAPDH) and expressed relative to LPS untreated siControl sample. *, P < 0.05; paired t test. Each pair of data points indicates an independent experiment. IL7R, n = 4; IL6, n = 4; TNF, n = 3. (C) With CD127-based FACS sorting for 6-h LPS-treated monocytes, ATAC-seq datasets were generated for CD127high and C127low monocytes from three donors separately. Heat maps of pooled ATAC-seq signals around the total identified OCRs were shown in CD127high and C127low monocytes. Each row indicates one OCR, and the rows were sorted by the decreasing ATAC-seq signals in OCRs. (D) Volcano plot shows the differentially opened OCRs by ATAC-seq between CD127high and CD127low monocytes (P < 0.05; fold change ≥2 or ≤0.5). Highly opened OCRs in CD127high population (CD127high feature OCRs) and highly opened OCRs in CD127low population (CD127low feature OCRs) are indicated in red and in blue, respectively. Fold changes are shown as the mean value of CD127high/CD127low ratio from three donors. (E) Pie graph shows the percentages of CD127high and C127low feature OCRs in total identified OCRs in LPS-activated monocytes. (F) Heat maps (left) show the ATAC-seq signals around the CD127high feature and CD127low feature OCRs in each pair of CD127high and CD127low monocytes from three donors and corresponding ATAC-seq signal fold changes (CD127high/CD127low; right) were log2 transformed and expressed by color from blue (negative) to red (positive). (G) Top five results from motif enrichment analysis in CD127high monocyte featured OCRs are shown according to the decreasing −log10(P value) for enriched motifs. P value by binomial distribution. (H) CD14+ monocytes were pretreated with STAT5 inhibitor (100 µM) for 2 h and then were stimulated with LPS (10 ng/ml). mRNA levels of IL6 (LPS 6 h) and TNF (LPS 3 h) were measured using qPCR. *, P < 0.05 by paired t test. Each pair of data points represents an independent experiment (n = 6). Independent experiments in A, B, and H were performed with cells from one healthy donor for each experiment.
Figure S4.
Figure S4.
CD127 expression coordinates enhancer-like OCRs in CD127high monocytes. (A) Pie graph shows the genomic distribution of CD127low monocyte feature OCRs. (B and C) ATAC-seq signals in CD127high monocytes and CD127low monocytes are shown around TSSs (±2,500 bp) of marker genes for CD127low subset (cluster 4) in Fig. 3 D. Heat map shows the ATAC-seq signals for individual TSS regions (B), and the average ATAC-seq signals are shown in a histogram (C). (D) ATAC-seq signals in CD127high and CD127low monocytes were counted around TSS regions (±250 bp) of marker genes for CD127low subset (cluster 4) in Fig. 3 D. FPKM values are shown in box plot. P value was calculated by Wilcoxon rank-sum test. (E) Pie graph shows the genomic distribution of CD127high monocyte feature OCRs. (F) Average ChIP-seq signals of H3K27ac and H3K4me1 in LPS-activated monocytes were assessed around CD127high feature OCRs and expressed by different colors as indicated in the plot. (G) Heat maps (left) show the ATAC-seq signals around the CD127high feature OCRs in human monocytes with or without LPS treatment for 4 h. The ATAC-seq signals were pooled from two independent experiments from the original datasets and were quantified every 10-bp bin from the centers of the each individual CD127high feature OCR. The ATAC-seq signal fold changes (right) were shown as the value of log2-transformed LPS-activated/resting ratio for each bin and expressed by colors from blue (negative) to red (positive). (H) The average ATAC-seq signals around the CD127high feature OCRs in human monocytes with or without LPS treatment for 4 h. (I and J) CD14+ monocytes were transfected with negative control or MAF-specific siRNA (siControl or siMAF). 2 d after transfection, knockdown efficiency was assessed by measuring MAF mRNA with qPCR (relative expression is normalized to internal control (GAPDH) and expressed relative to siControl group) and MAF protein levels with immunoblotting (I). 2 d after transfection, cells were stimulated with LPS (10 ng/ml) for 3 h, and mRNA levels of IL6 and TNF were measured by qPCR (J). Relative expression was normalized to internal control (GAPDH) and expressed relative to LPS untreated siControl sample. *, P < 0.05; **, P < 0.01; paired t test. Each pair of data points represents an independent experiment with cells from a healthy donor. The results from four independent experiments are shown.
Figure 5.
Figure 5.
STAT5 reinforces unique epigenetic landscape in CD127high monocytes to impose hypoinflammatory phenotype. (A) RNA-seq separately performed in CD127high and CD127low populations from LPS 6-h stimulated CD14+ monocytes of three healthy donors. Volcano plot shows the significant differential expression between CD127high and CD127low populations (P < 0.05; fold change ≥1.5 or ≤0.67). Highly expressed genes in CD127high population and CD127low population are colored in red and in green, respectively. Two CD127high highly expressed genes, IL7R and MAF, were labeled. Fold changes (FCs) are shown as mean value of CD127high/CD127low ratio from three donors. (B) mRNA of MAF in CD127high and CD127low populations from LPS 6-h stimulated CD14+ monocytes was measured by qPCR. Relative expression was normalized to internal control (GAPDH) and expressed relative to CD127low sample. *, P < 0.05 by paired t test. Data are shown as the mean ± SD of four independent experiments. (C) Cumulative percentage plot shows the portions of CD127high and CD127low feature OCRs with significant MAF enrichment (MAF+) in resting human monocytes. (D) Average MAF ChIP-seq signals in resting human monocytes are shown around the CD127high and CD127low feature OCRs. (E) The occupancy of STAT5 in the MAF upstream GAS motif was assessed by ChIP-qPCR in LPS 6-h stimulated THP-1 cells. Relative STAT5 ChIP signals were expressed relative to IgG ChIP negative control sample. *, P < 0.05 by paired t test. Data are shown as the mean ± SD of three independent experiments. (F) CD14+ monocytes were pretreated with STAT5 inhibitor (100 µM) for 2 h and then were stimulated with LPS (10 ng/ml) for 6 h. mRNA of MAF was measured by qPCR. Relative expression is normalized to internal control (GAPDH) and expressed relative to DMSO-treated sample. ***, P < 0.001 by paired t test. Results from six independent experiments are shown. (G) Heat map showing the STAT5 ChIP-seq signals around each identified STAT5 peak in CD127high monocytes by each row. The rows were sorted by decreasing STAT5 ChIP-seq signals in peak regions. (H) Average STAT5 ChIP-seq signals in CD127high monocytes are shown around total STAT5 peak regions. (I) Pie graph shows the genomic distribution of STAT5 peaks in CD127high monocytes. (J) Heat map shows the STAT5 ChIP-seq signals in CD127high monocytes around the CD127high and CD127low feature OCRs. (K) Average STAT5 ChIP-seq signals in CD127high monocytes are shown around the CD127high and CD127low feature OCRs. (L) Cumulative percentage plot showing the portions of CD127high and CD127low feature OCRs with significant STAT5 enrichment (STAT5+) in CD127high monocytes. (M) STAT5 ChIP-seq signals in CD127high and CD127low feature OCRs were counted as FPKM and are shown as a box plot. P value was derived by Wilcoxon rank-sum test. Independent experiments in B and D were performed with cells from one healthy donor for each experiment.
Figure S5.
Figure S5.
CD127 expression designates a functionally distinct monocyte subset. (A) UMAP projection of PBMCs from an RA patient. Cell type annotations were labeled for each cluster. DC, dendritic cell; pDC, plasmacytoid dendritic cell. (B) Heat map shows the expression of hallmark genes in different cell clusters from RA PBMCs. The scaled average expression levels of marker genes and the percentage of cells expressing marker genes are expressed by color and size of each dot corresponding to cell clusters, respectively. MAIT, mucosal associated invariant T cell; NK, natural killer cell. (C) The percentages of IL7R+ cells in BALF monocytes/macrophages (mono/mac) from mild or severe COVID-19 patients are individually shown for each patient. (D) Lymphoid cells from COVID-19 patient BALF were subgrouped by the diagnosed disease severity. Violin plot shows the expression of IL7R in BALF lymphoid cells from mild or severe COVID-19 patients. Each overlaid box indicates the interquartile range with the median shown as a circle. (E) The schematic plot briefly shows the methodology of SCALEX. The asymmetric variational autoencoder (VAE) framework was structured for SCALEX via a batch-free encoder and a batch-specific decoder, in which batch-free encoder extracted the batch-invariant biological features (z) that were masked by batch-related variations among the input scRNA-seq datasets (x), and batch-specific decoder incorporated the batch information when reconstructing the expression matrix for integrated data. Such a probabilistic model of SCALEX is shown in the panel and is briefly introduced in Materials and methods. On this basis, we integrated monocytes from COVID-19 BALF, RA synovial tissue, and LPS-treated monocytes by SCALEX to generate a comparable integrated scRNA-seq dataset with preservation of the biological features for each incorporated component. (F) Pie graphs projecting the percentage of each cluster in E in total monocytes or macrophages from different tissue sources. (G) The stacked violin plot shows the expression of the top five cluster 10 signature genes in all 10 clusters shown in E. Median expression levels for each gene in each cluster were indicated by colors. (H) UMAP projection of integrated monocytes/macrophages in E. FABP4 expression in cells was quantitatively visualized by the indicated colors. Cells corresponding to cluster 10 were highlighted by a dotted line as alveolar macrophages, given the specific FABP4 expression pattern. (I) Violin plot shows the expression of CD163 among nine clusters of integrated monocytes in Fig. 6 G, in which cluster 2 was designated as the IL7Rhigh cluster. Each overlaid box indicates the interquartile range with the median shown as a circle.
Figure 6.
Figure 6.
Integrated human inflammatory monocyte expression atlas. (A and C) In monocytes/macrophages (mono/mac) from RA synovia (A, left), RA peripheral blood (A, right), and COVID-19 BALF (C), IL7R+ cells and inflahigh cells (top 20% inflammatory cells by inflammatory score) were grouped as described in Materials and methods. Venn diagrams (upper) show the extent of overlap between IL7R+ cells and inflahigh cells with labeling of the cell counts and box plots (bottom) showing the inflammatory score distribution in IL7R+ cells and inflahigh cells in each disease condition as indicated (see Materials and methods for details in comparison). ***, P < 0.001 by Wilcoxon rank-sum test. (B and D) Heat maps show the expression of IL7R and eight inflammatory genes for inflammatory score calculation in IL7R+ cells and inflahigh cells in mono/mac from each of the disease conditions as indicated. For each gene, scaled average expression level and ratio of expression-positive cells in each cluster are represented by color and size of the dot, respectively. (E and F) Mono/mac cells from COVID-19 patient BALF were subdivided by disease severity. Violin plot shows the expression of IL7R in BALF mono/mac from mild or severe COVID-19 patients (E), and each overlaid box indicates the interquartile range with the median shown as a circle. Cumulative dot plot (F) shows percentages of IL7R+ cells in BALF mono/mac from each mild or severe COVID-19 patient as the mean ± SD. ***, P < 0.001 by unpaired t test. (G) Integration of scRNA-seq datasets for monocytes from COVID-19 BALF, RA synovial tissue, and LPS-treated monocytes was implemented by advanced analysis tool, SCALEX. Nine clusters of integrated monocytes were delimited by unsupervised clustering and are shown in a UMAP plot. (H) IL7R expression is expressed by colors and overlaid to a UMAP projection of integrated monocytes in G. (I) Violin plot shows the expression of IL7R among nine clusters of integrated monocytes in G. Each overlaid box indicates the interquartile range with the median shown as a circle. Cluster 2 were named the IL7Rhigh cluster (highest IL7R expression). (J) For populations of COVID-19 BALF monocytes, RA synovial monocytes, and LPS-treated monocytes, the heat map shows the correlation between cluster 2 cells in each monocyte population and all nine clusters in each monocyte population, respectively. (K) The stacked violin plot shows the expression of the top 25 cluster 2 signature genes in all nine monocyte clusters in G. Median expression levels for each gene in each cluster are indicated by colors.

Update of

References

    1. Al-Mossawi, H., Yager N., Taylor C.A., Lau E., Danielli S., de Wit J., Gilchrist J., Nassiri I., Mahe E.A., Lee W., et al. . 2019. Context-specific regulation of surface and soluble IL7R expression by an autoimmune risk allele. Nat. Commun. 10:4575. 10.1038/s41467-019-12393-1 - DOI - PMC - PubMed
    1. Barata, J.T., Durum S.K., and Seddon B.. 2019. Flip the coin: IL-7 and IL-7R in health and disease. Nat. Immunol. 20:1584–1593. 10.1038/s41590-019-0479-x - DOI - PubMed
    1. Carter, B., and Zhao K.. 2021. The epigenetic basis of cellular heterogeneity. Nat. Rev. Genet. 22:235–250. - PMC - PubMed
    1. Chen, Z., Kim S.J., Chamberlain N.D., Pickens S.R., Volin M.V., Volkov S., Arami S., Christman J.W., Prabhakar B.S., Swedler W., et al. . 2013. The novel role of IL-7 ligation to IL-7 receptor in myeloid cells of rheumatoid arthritis and collagen-induced arthritis. J. Immunol. 190:5256–5266. 10.4049/jimmunol.1201675 - DOI - PMC - PubMed
    1. Cormican, S., and Griffin M.D.. 2020. Human monocyte subset distinctions and function: insights from gene expression analysis. Front. Immunol. 11:1070. 10.3389/fimmu.2020.01070 - DOI - PMC - PubMed

Publication types