Editorial
. 2022 Mar 1;3(2):136-153.
doi: 10.1158/2643-3230.BCD-21-0181.

Blockade or Deletion of IFNγ Reduces Macrophage Activation without Compromising CAR T-cell Function in Hematologic Malignancies

Affiliations
Editorial

Blockade or Deletion of IFNγ Reduces Macrophage Activation without Compromising CAR T-cell Function in Hematologic Malignancies

Stefanie R Bailey et al. Blood Cancer Discov. .

Abstract

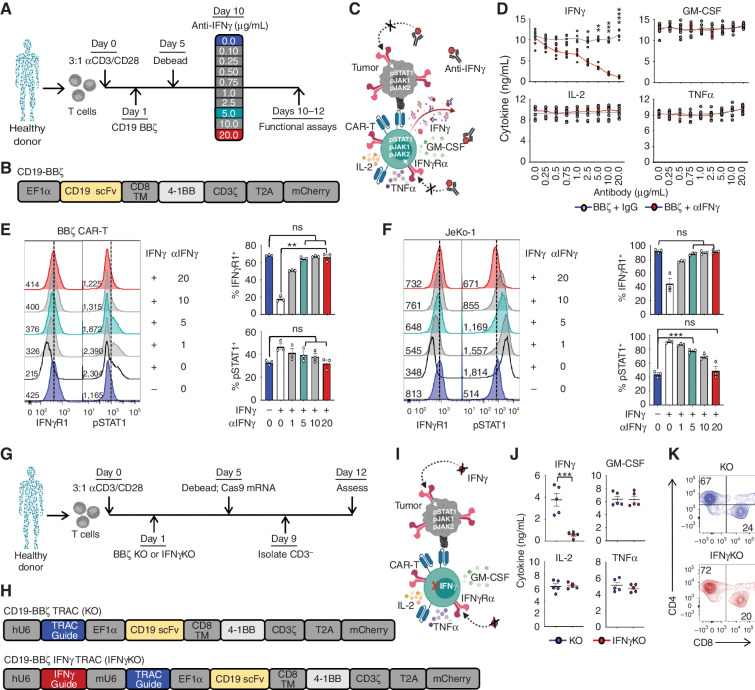
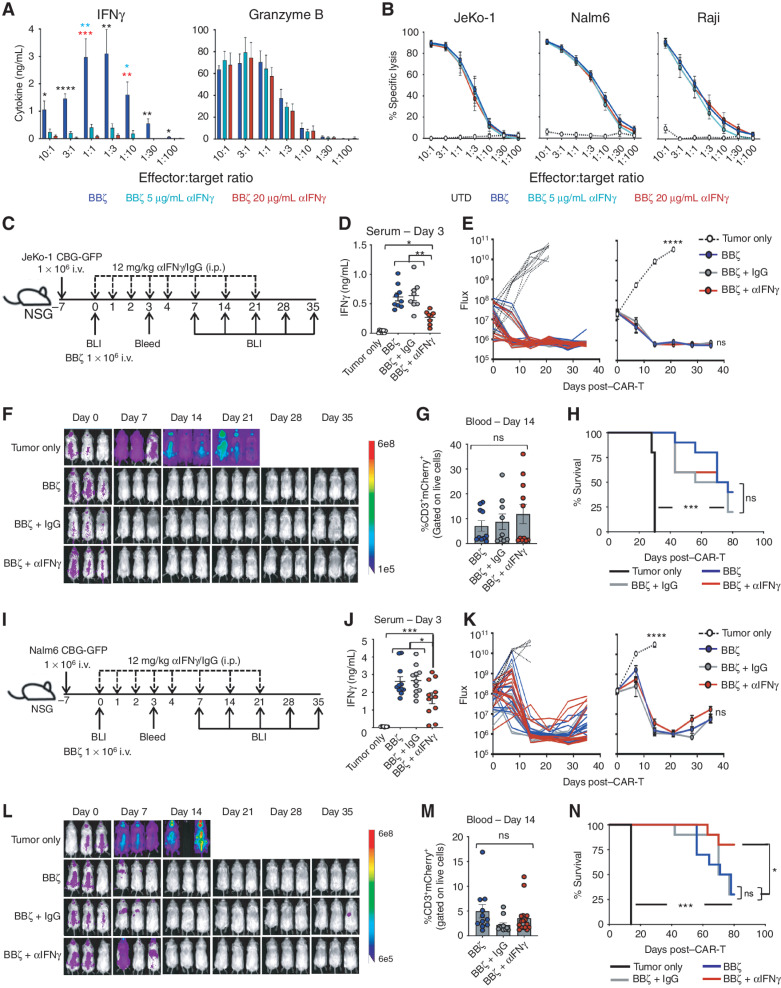
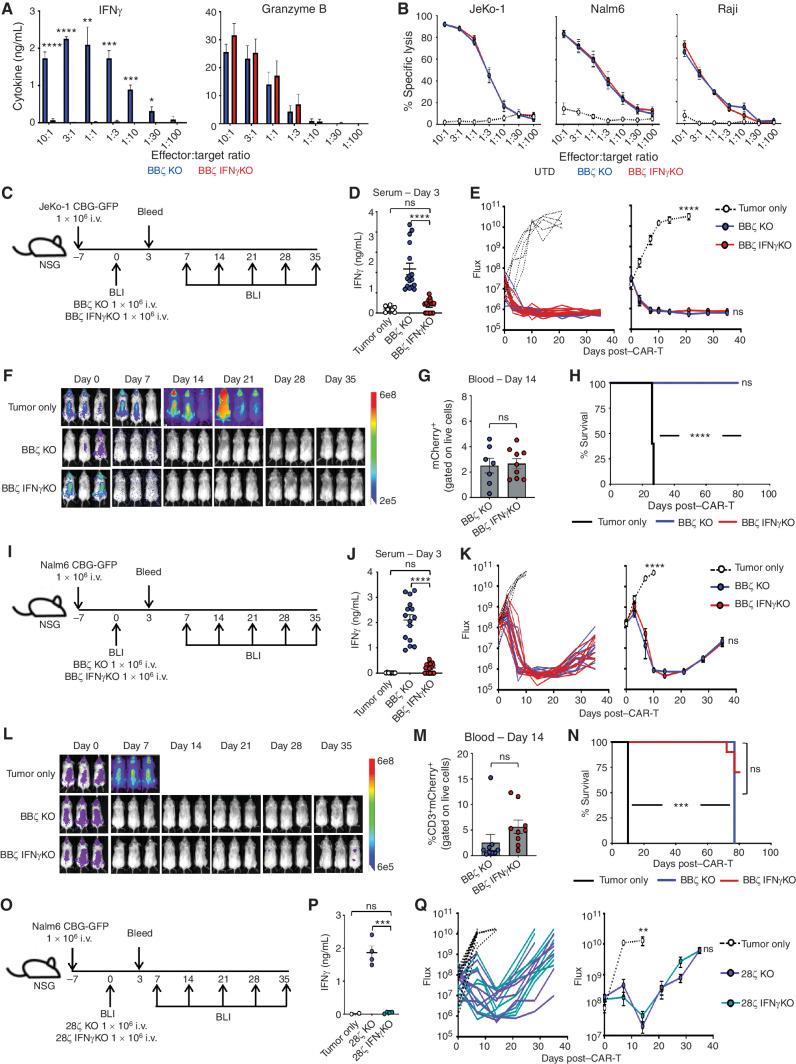
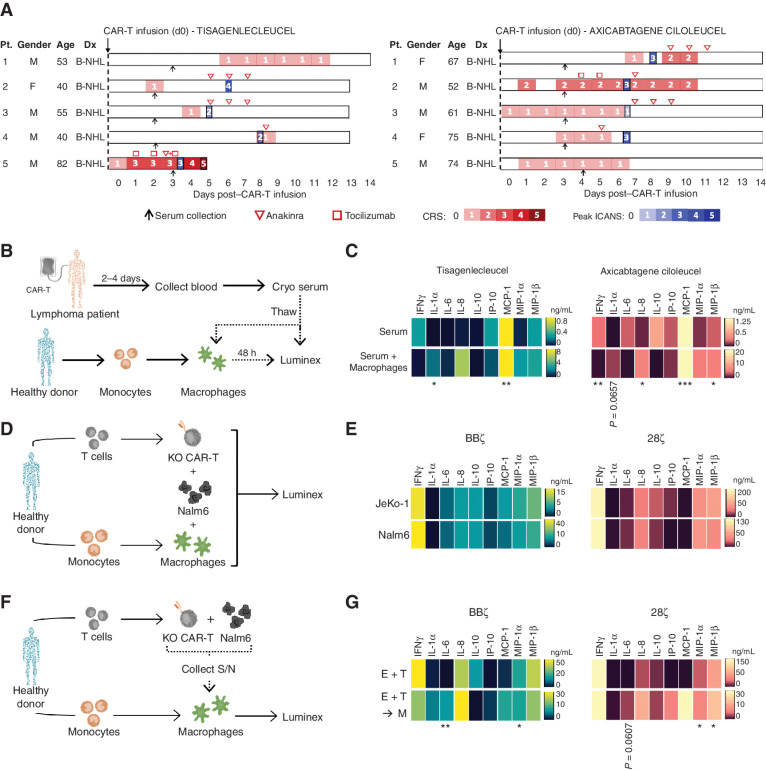
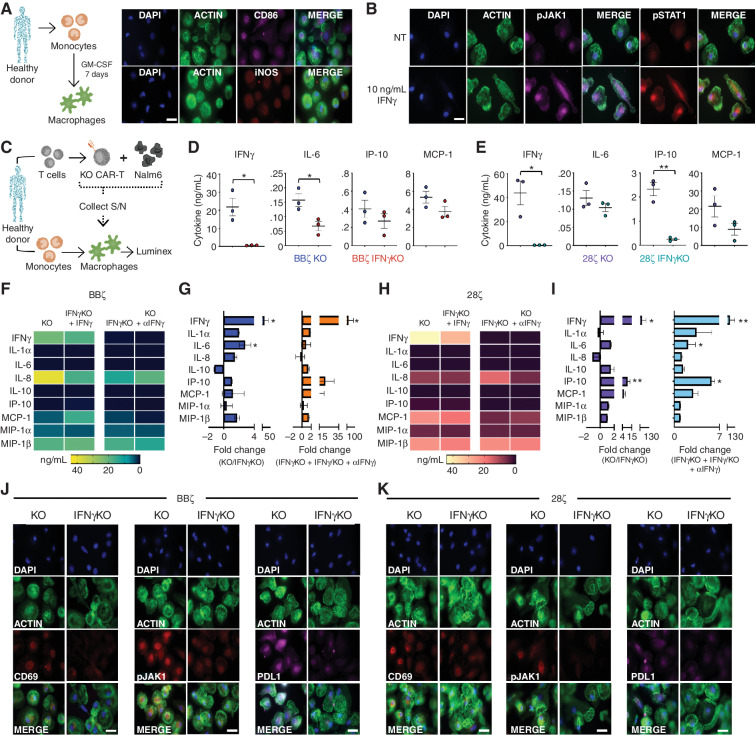
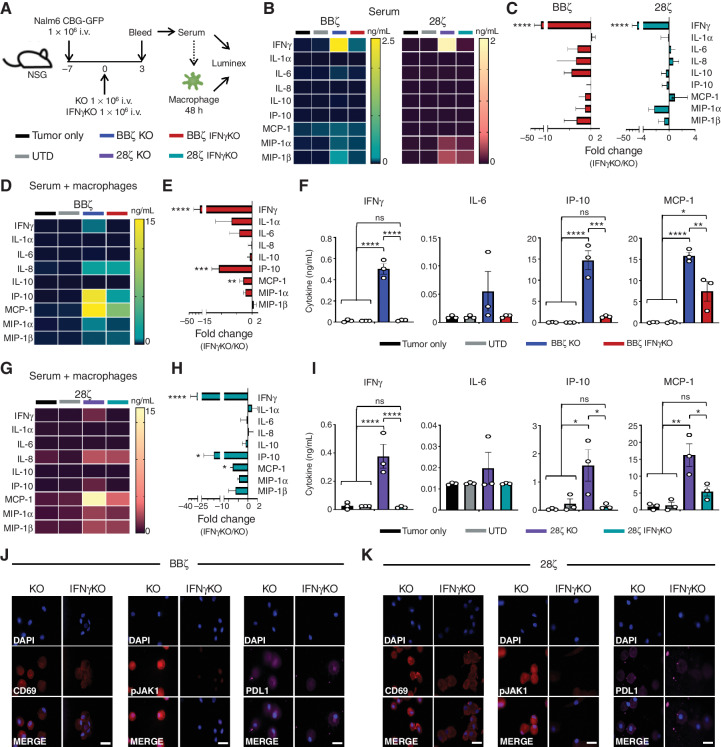
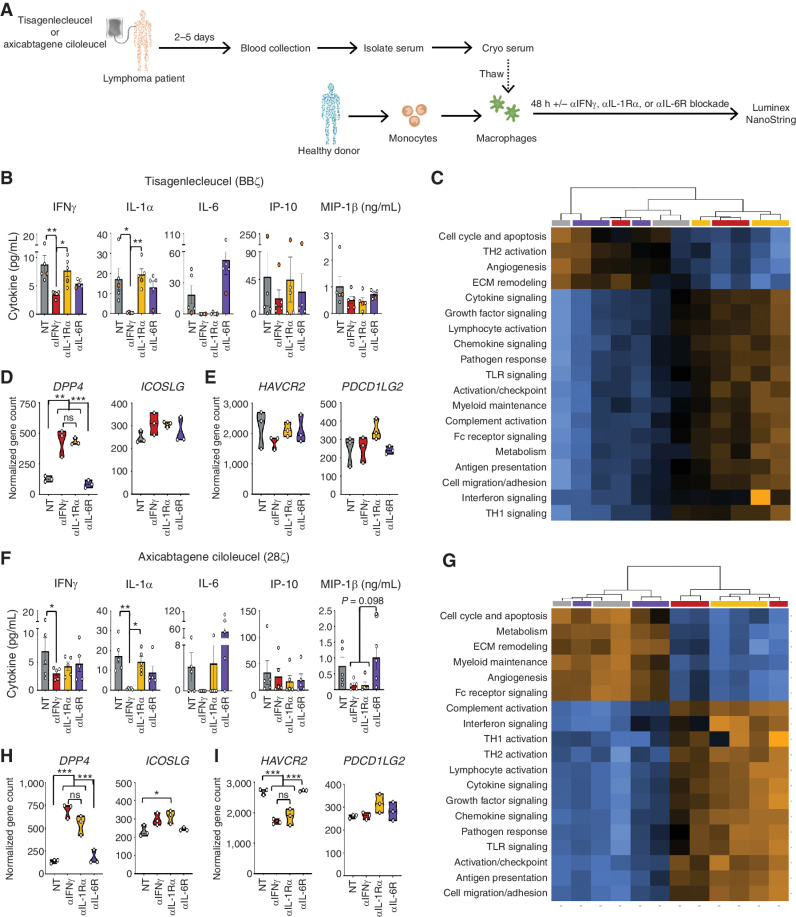
Chimeric antigen receptor (CAR) T cells induce impressive responses in patients with hematologic malignancies but can also trigger cytokine release syndrome (CRS), a systemic toxicity caused by activated CAR T cells and innate immune cells. Although IFNγ production serves as a potency assay for CAR T cells, its biologic role in conferring responses in hematologic malignancies is not established. Here we show that pharmacologic blockade or genetic knockout of IFNγ reduced immune checkpoint protein expression with no detrimental effect on antitumor efficacy against hematologic malignancies in vitro or in vivo. Furthermore, IFNγ blockade reduced macrophage activation to a greater extent than currently used cytokine antagonists in immune cells from healthy donors and serum from patients with CAR T-cell-treated lymphoma who developed CRS. Collectively, these data show that IFNγ is not required for CAR T-cell efficacy against hematologic malignancies, and blocking IFNγ could simultaneously mitigate cytokine-related toxicities while preserving persistence and antitumor efficacy.

Significance: Blocking IFNγ in CAR T cells does not impair their cytotoxicity against hematologic tumor cells and paradoxically enhances their proliferation and reduces macrophage-mediated cytokines and chemokines associated with CRS. These findings suggest that IFNγ blockade may improve CAR T-cell function while reducing treatment-related toxicity in hematologic malignancies. See related content by McNerney et al., p. 90 (17). This article is highlighted in the In This Issue feature, p. 85.


Figures

Figure 1. IFNγ can be pharmacologically and genetically blocked in CAR T cells. A–C, CAR T cells were generated from healthy donors, and IFNγ signaling was disrupted using αIFNγ-blocking antibodies. scFV, single-chain variable fragment. TM, transmembrane domain. d, BBζ CAR T cells were activated with phorbol 12-myristate 13-acetate (PMA)/ionomycin in the presence of αIFNγ antibody or IgG control and assessed by ELISA; n = 5. e and F, IFNγR1 and pSTAT1 expression in CAR T (E) and JeKo-1 (F) lymphoma cells treated with (+) or without (−) 10 ng/mL IFNγ ± αIFNγ-blocking antibody (μg/mL) as shown by mean fluorescence intensity (left) and percentage of positive cells (right); n = 3. G–I, BBζ CAR T cells genetically lacking TRAC (KO) or TRAC and IFNγ (IFNγKO) were generated from healthy donors. j, KO and IFNγKO CAR T cells were activated with PMA/ionomycin and assessed by ELISA; n = 5. k, CD4 and CD8 populations were determined by flow cytometry (representative of n = 5). Data are shown as mean ± SEM with P values by unpaired t tests (D and J) or one-way ANOVA (E and F). *, P < 0.05; **, P < 0.01; ***, P < 0.001; ****, P < 0.0001; ns, not significant.
Figure 1.
IFNγ can be pharmacologically and genetically blocked in CAR T cells. A–C, CAR T cells were generated from healthy donors, and IFNγ signaling was disrupted using αIFNγ-blocking antibodies. scFV, single-chain variable fragment. TM, transmembrane domain. D, BBζ CAR T cells were activated with phorbol 12-myristate 13-acetate (PMA)/ionomycin in the presence of αIFNγ antibody or IgG control and assessed by ELISA; n = 5. E and F, IFNγR1 and pSTAT1 expression in CAR T (E) and JeKo-1 (F) lymphoma cells treated with (+) or without (−) 10 ng/mL IFNγ ± αIFNγ-blocking antibody (μg/mL) as shown by mean fluorescence intensity (left) and percentage of positive cells (right); n = 3. G–I, BBζ CAR T cells genetically lacking TRAC (KO) or TRAC and IFNγ (IFNγKO) were generated from healthy donors. J, KO and IFNγKO CAR T cells were activated with PMA/ionomycin and assessed by ELISA; n = 5. K, CD4 and CD8 populations were determined by flow cytometry (representative of n = 5). Data are shown as mean ± SEM with P values by unpaired t tests (D and J) or one-way ANOVA (E and F). *, P < 0.05; **, P < 0.01; ***, P < 0.001; ****, P < 0.0001; ns, not significant.
Figure 2. IFNγ blockade does not diminish CAR T-cell efficacy in vitro or in vivo. a, BBζ CAR T cells were combined with Nalm6 tumor cells overnight at various effector:target ratios in αIFNγ-blocking antibody (0, 5, 20 μg/mL), and IFNγ and Granzyme B production was determined by ELISA; n = 5. b, Luciferase-based specific lysis of JeKo-1, Nalm6, and Raji tumor cells by BBζ CAR-T with αIFNγ-blocking antibodies; n = 5. C–H, NSG mice were intravenously injected with JeKo-1 tumor cells and treated with BBζ CAR T cells ± αIFNγ or IgG control antibodies as shown in C. IFNγ expression in serum collected from mice 3 days posttreatment with BBζ CAR ± antibodies (D). Tumor growth was tracked by bioluminescent imaging (BLI; E and F), CAR T persistence in the blood was determined on day 14 post–CAR injection (G), and overall survival was monitored throughout (H). I–N, Experiments described in C–H were repeated using the Nalm6 tumor model. For all experiments, n = 3–5 mice/group; repeated with 3 healthy donors. Data are shown as mean ± SEM with P values by one-way ANOVA or log-rank (Mantel–Cox test) for Kaplan–Meier curves. *, P < 0.05; **, P < 0.01; ***, P < 0.001; ****, P < 0.0001; ns, not significant.
Figure 2.
IFNγ blockade does not diminish CAR T-cell efficacy in vitro or in vivo. A, BBζ CAR T cells were combined with Nalm6 tumor cells overnight at various effector:target ratios in αIFNγ-blocking antibody (0, 5, 20 μg/mL), and IFNγ and Granzyme B production was determined by ELISA; n = 5. B, Luciferase-based specific lysis of JeKo-1, Nalm6, and Raji tumor cells by BBζ CAR-T with αIFNγ-blocking antibodies; n = 5. C–H, NSG mice were intravenously injected with JeKo-1 tumor cells and treated with BBζ CAR T cells ± αIFNγ or IgG control antibodies as shown in C. IFNγ expression in serum collected from mice 3 days posttreatment with BBζ CAR ± antibodies (D). Tumor growth was tracked by bioluminescent imaging (BLI; E and F), CAR T persistence in the blood was determined on day 14 post–CAR injection (G), and overall survival was monitored throughout (H). I–N, Experiments described in C–H were repeated using the Nalm6 tumor model. For all experiments, n = 3–5 mice/group; repeated with 3 healthy donors. Data are shown as mean ± SEM with P values by one-way ANOVA or log-rank (Mantel–Cox test) for Kaplan–Meier curves. *, P < 0.05; **, P < 0.01; ***, P < 0.001; ****, P < 0.0001; ns, not significant.
Figure 3. IFNγKO CAR T-cell clear lymphoma and leukemia tumors in vitro and in vivo. a, BBζ KO/IFNγKO CAR T cells were combined with Nalm6 tumor cells overnight at various effector:target ratios, and IFNγ and Granzyme B production was determined by ELISA; n = 5. b, Luciferase-based specific lysis of JeKo-1, Nalm6, and Raji tumor cells by BBζ KO/IFNγKO CAR T cells, n = 5. C–H, NSG mice were intravenously injected with JeKo-1 tumor cells and treated with BBζ KO or IFNγKO CAR T cells as shown in C. IFNγ expression in serum collected from mice 3 days posttreatment with BBζ CAR T cells (D). Tumor growth was tracked by bioluminescent imaging (BLI; E and F), CAR T-cell persistence in the blood was determined on day 14 post–CAR injection (G), and overall survival was monitored throughout (H). I–N, Experiments described in C–H were repeated using the Nalm6 tumor model. O–Q, NSG mice were intravenously injected with Nalm6 tumor cells and treated with 28ζ KO or IFNγKO CAR T cells (O). Mice were assessed for IFNγ in the serum (P) and measured weekly using bioluminescence (Q). For BBζ experiments, n = 3–5 mice/group; repeated with 3 healthy donors. For 28ζ experiment, n = 5 mice/group; repeated with 2 healthy donors. Data are shown as mean ± SEM with P values by one-way ANOVA or log-rank (Mantel–Cox test) for Kaplan–Meier curves. *, P < 0.05; **, P < 0.01; ***, P < 0.001; ****, P < 0.0001; ns, not significant.
Figure 3.
IFNγKO CAR T-cell clear lymphoma and leukemia tumors in vitro and in vivo. A, BBζ KO/IFNγKO CAR T cells were combined with Nalm6 tumor cells overnight at various effector:target ratios, and IFNγ and Granzyme B production was determined by ELISA; n = 5. B, Luciferase-based specific lysis of JeKo-1, Nalm6, and Raji tumor cells by BBζ KO/IFNγKO CAR T cells, n = 5. C–H, NSG mice were intravenously injected with JeKo-1 tumor cells and treated with BBζ KO or IFNγKO CAR T cells as shown in C. IFNγ expression in serum collected from mice 3 days posttreatment with BBζ CAR T cells (D). Tumor growth was tracked by bioluminescent imaging (BLI; E and F), CAR T-cell persistence in the blood was determined on day 14 post–CAR injection (G), and overall survival was monitored throughout (H). I–N, Experiments described in C–H were repeated using the Nalm6 tumor model. O–Q, NSG mice were intravenously injected with Nalm6 tumor cells and treated with 28ζ KO or IFNγKO CAR T cells (O). Mice were assessed for IFNγ in the serum (P) and measured weekly using bioluminescence (Q). For BBζ experiments, n = 3–5 mice/group; repeated with 3 healthy donors. For 28ζ experiment, n = 5 mice/group; repeated with 2 healthy donors. Data are shown as mean ± SEM with P values by one-way ANOVA or log-rank (Mantel–Cox test) for Kaplan–Meier curves. *, P < 0.05; **, P < 0.01; ***, P < 0.001; ****, P < 0.0001; ns, not significant.
Figure 4. Establishing macrophage activation models to simulate lymphoma patient cytokine profiles. a, Swimmer plots for patients with lymphoma in this study, including dates of serum collection (black arrow), anakinra treatment (red inverted triangle), tocilizumab treatment (red square), CRS grading (red gradient), and peak ICANS days (blue gradient). B-NHL, B-cell non-Hodgkin lymphoma; Dx, diagnosis. b and C, Serum from patients receiving tisagenlecleucel or axicabtagene ciloleucel CAR T-cell products was collected 2 to 5 days post–CAR treatment and added to healthy donor–derived GM-CSF–activated macrophages; cytokines were assessed 48 hours later. Luminex data were graphed by heat map to highlight upregulated proteins in serum alone (top) and following addition to macrophages (bottom) in tisagenlecleucel and axicabtagene ciloleucel patients; n = 5 patients/CAR T-cell product. d and E, Healthy donor BBζ and 28ζ KO CAR T cells were generated and combined at a 1E:1T:0.02M ratio with donor-matched macrophages and JeKo–Nalm6 or JeKo-1 cells for 48 hours, and serum was analyzed by Luminex (n = 5). f and G, Healthy donor KO CAR T cells were generated and combined with Nalm6 at a 1:1 ratio overnight before serum was collected and added to donor-matched macrophages for 48 hours. Serum from the E:T cultures (top) and E:T:M (bottom) was collected, analyzed by Luminex, and graphed by BBζ (left) or 28ζ (right), n = 5. S/N, supernatant. Data are shown as heat maps depicting mean values with P values by unpaired t tests. *, P < 0.05; **, P < 0.01; ***, P < 0.001.
Figure 4.
Establishing macrophage activation models to simulate lymphoma patient cytokine profiles. A, Swimmer plots for patients with lymphoma in this study, including dates of serum collection (black arrow), anakinra treatment (red inverted triangle), tocilizumab treatment (red square), CRS grading (red gradient), and peak ICANS days (blue gradient). B-NHL, B-cell non-Hodgkin lymphoma; Dx, diagnosis. B and C, Serum from patients receiving tisagenlecleucel or axicabtagene ciloleucel CAR T-cell products was collected 2 to 5 days post–CAR treatment and added to healthy donor–derived GM-CSF–activated macrophages; cytokines were assessed 48 hours later. Luminex data were graphed by heat map to highlight upregulated proteins in serum alone (top) and following addition to macrophages (bottom) in tisagenlecleucel and axicabtagene ciloleucel patients; n = 5 patients/CAR T-cell product. D and E, Healthy donor BBζ and 28ζ KO CAR T cells were generated and combined at a 1E:1T:0.02M ratio with donor-matched macrophages and JeKo–Nalm6 or JeKo-1 cells for 48 hours, and serum was analyzed by Luminex (n = 5). F and G, Healthy donor KO CAR T cells were generated and combined with Nalm6 at a 1:1 ratio overnight before serum was collected and added to donor-matched macrophages for 48 hours. Serum from the E:T cultures (top) and E:T:M (bottom) was collected, analyzed by Luminex, and graphed by BBζ (left) or 28ζ (right), n = 5. S/N, supernatant. Data are shown as heat maps depicting mean values with P values by unpaired t tests. *, P < 0.05; **, P < 0.01; ***, P < 0.001.
Figure 5. IFNγKO CAR T cells reduce macrophage activation in a contact-independent manner. a, Monocytes were isolated from healthy donors and expanded to generate GM-CSF–activated macrophages prior to immunofluorescence staining; representative of n = 2 (magnification 63×). Scale bars, 10 μm. b, GM-CSF–activated macrophages were generated in healthy donors and left untreated (NT; top) or given 10 ng/mL recombinant human IFNγ (bottom) for 4 hours prior to staining for pJAK1 and pSTAT1 by fluorescent microscopy; representative of n = 2 (magnification 63×). Scale bars, 10 μm. C–E, KO/IFNγKO CAR T cells were generated from healthy donors and combined with Nalm6 cells for 24 hours prior to supernatant (S/N) collection and addition to donor-matched GM-CSF–activated macrophages (C). Forty hours later, supernatant was collected from macrophages, and function was assessed by Luminex for BBζ (D) and 28ζ (E); n = 3. f and G, Using the protocol from C, supernatant from BBζ cultures was added to macrophages and left untreated, or IFNγKO CAR T cells were given 10 ng/mL recombinant human IFNγ and KO CAR T-cell supernatant was supplemented with 20 μg/mL αIFNγ-blocking antibody. Cytokines were assessed by Luminex and graphed as a heat map of mean expression (F) and fold change (G; n = 5). h and I, Using the protocol from C, supernatant from 28ζ cultures was added to macrophages and left untreated or IFNγKO CAR T cells were given 10 ng/mL recombinant human IFNγ and KO CAR T-cell supernatant was supplemented with 20 μg/mL αIFNγ-blocking antibody. Cytokines were assessed by Luminex and graphed as a heat map of mean expression (H) and fold change (I; n = 5). Macrophages from cultures in D and E were fixed and stained for CD69, pJAK1, and PD-L1 for both BBζ (J) and 28ζ (K); representative of n = 2 (magnification 63×). Scale bars, 10 μm. Data are shown as mean ± SEM with P values by unpaired t tests. *, P < 0.05; **, P < 0.01.
Figure 5.
IFNγKO CAR T cells reduce macrophage activation in a contact-independent manner. A, Monocytes were isolated from healthy donors and expanded to generate GM-CSF–activated macrophages prior to immunofluorescence staining; representative of n = 2 (magnification 63×). Scale bars, 10 μm. B, GM-CSF–activated macrophages were generated in healthy donors and left untreated (NT; top) or given 10 ng/mL recombinant human IFNγ (bottom) for 4 hours prior to staining for pJAK1 and pSTAT1 by fluorescent microscopy; representative of n = 2 (magnification 63×). Scale bars, 10 μm. C–E, KO/IFNγKO CAR T cells were generated from healthy donors and combined with Nalm6 cells for 24 hours prior to supernatant (S/N) collection and addition to donor-matched GM-CSF–activated macrophages (C). Forty hours later, supernatant was collected from macrophages, and function was assessed by Luminex for BBζ (D) and 28ζ (E); n = 3. F and G, Using the protocol from C, supernatant from BBζ cultures was added to macrophages and left untreated, or IFNγKO CAR T cells were given 10 ng/mL recombinant human IFNγ and KO CAR T-cell supernatant was supplemented with 20 μg/mL αIFNγ-blocking antibody. Cytokines were assessed by Luminex and graphed as a heat map of mean expression (F) and fold change (G; n = 5). H and I, Using the protocol from C, supernatant from 28ζ cultures was added to macrophages and left untreated or IFNγKO CAR T cells were given 10 ng/mL recombinant human IFNγ and KO CAR T-cell supernatant was supplemented with 20 μg/mL αIFNγ-blocking antibody. Cytokines were assessed by Luminex and graphed as a heat map of mean expression (H) and fold change (I; n = 5). Macrophages from cultures in D and E were fixed and stained for CD69, pJAK1, and PD-L1 for both BBζ (J) and 28ζ (K); representative of n = 2 (magnification 63×). Scale bars, 10 μm. Data are shown as mean ± SEM with P values by unpaired t tests. *, P < 0.05; **, P < 0.01.
Figure 6. Serum from tumor-bearing mice treated with IFNγKO CAR T cells yield reduced macrophage responses in vitro. NSG mice were intravenously injected with Nalm6 tumor cells and left untreated (tumor only) or given UTD or KO/IFNγKO CAR T cells. Three days post–CAR injection, serum was collected and used directly for Luminex assessment or added to donor-matched macrophages. Forty-eight hours later, supernatant was collected and assayed for cytokine expression. a, Schematic of experimental layout. b and C, Serum from BBζ and 28ζ CAR–treated mice collected directly from mice was assayed by Luminex and graphed by mean values (B) and fold-change expression (C). D–I, Serum from mice was added to macrophages for 24 hours prior to collection and Luminex assessment for BBζ (D–F) and 28ζ (G–I) groups. Data are shown as mean value (D and G), fold-change expression (E and H), and cytokine level (F and I). j and K, Following supernatant collection, macrophages were stained for CD69, pJAK1, and PD-L1 expression for both BBζ (J) and 28ζ (K) subsets (magnification 63×). Scale bars, 10 μm. Experiments were performed in 3–5 mice/group and repeated with 4 healthy donors. Data in C, E, and H are shown as mean ± SEM with P values by unpaired t tests. Data in F and I are shown as mean ± SEM with P values by one-way ANOVA. *, P < 0.05; **, P < 0.01; ***, P < 0.001; ****, P < 0.0001; ns, not significant.
Figure 6.
Serum from tumor-bearing mice treated with IFNγKO CAR T cells yield reduced macrophage responses in vitro. NSG mice were intravenously injected with Nalm6 tumor cells and left untreated (tumor only) or given UTD or KO/IFNγKO CAR T cells. Three days post–CAR injection, serum was collected and used directly for Luminex assessment or added to donor-matched macrophages. Forty-eight hours later, supernatant was collected and assayed for cytokine expression. A, Schematic of experimental layout. B and C, Serum from BBζ and 28ζ CAR–treated mice collected directly from mice was assayed by Luminex and graphed by mean values (B) and fold-change expression (C). D–I, Serum from mice was added to macrophages for 24 hours prior to collection and Luminex assessment for BBζ (D–F) and 28ζ (G–I) groups. Data are shown as mean value (D and G), fold-change expression (E and H), and cytokine level (F and I). j and K, Following supernatant collection, macrophages were stained for CD69, pJAK1, and PD-L1 expression for both BBζ (J) and 28ζ (K) subsets (magnification 63×). Scale bars, 10 μm. Experiments were performed in 3–5 mice/group and repeated with 4 healthy donors. Data in C, E, and H are shown as mean ± SEM with P values by unpaired t tests. Data in F and I are shown as mean ± SEM with P values by one-way ANOVA. *, P < 0.05; **, P < 0.01; ***, P < 0.001; ****, P < 0.0001; ns, not significant.
Figure 7. Blocking IFNγ reduces macrophage activation in lymphoma patients to a greater extent than current biological approaches. a, Serum from patients receiving tisagenlecleucel or axicabtagene ciloleucel CAR T-cell products was collected 2 to 5 days post–CAR treatment, added to healthy donor-derived GM-CSF–activated macrophages ± blocking antibodies to IFNγ, IL-1Rα, and IL-6R, and were assessed 48 hours later. B–F, Cultures receiving serum from tisagenlecleucel patients were assessed by Luminex (B) or NanoString (C–E). Experiments above were repeated using serum from axicabtagene ciloleucel (F–I). NanoString analysis for both groups was graphed as pathway score heat maps (C and G) and normalized gene counts (D, E, H, and I). Data are shown as mean ± SEM with P values by one-way ANOVA. *, P < 0.05; **, P < 0.01; ***, P < 0.001; ns, not significant.
Figure 7.
Blocking IFNγ reduces macrophage activation in lymphoma patients to a greater extent than current biological approaches. A, Serum from patients receiving tisagenlecleucel or axicabtagene ciloleucel CAR T-cell products was collected 2 to 5 days post–CAR treatment, added to healthy donor-derived GM-CSF–activated macrophages ± blocking antibodies to IFNγ, IL-1Rα, and IL-6R, and were assessed 48 hours later. B–F, Cultures receiving serum from tisagenlecleucel patients were assessed by Luminex (B) or NanoString (C–E). Experiments above were repeated using serum from axicabtagene ciloleucel (F–I). NanoString analysis for both groups was graphed as pathway score heat maps (C and G) and normalized gene counts (D, E, H, and I). Data are shown as mean ± SEM with P values by one-way ANOVA. *, P < 0.05; **, P < 0.01; ***, P < 0.001; ns, not significant.

Comment in

Comment on

References

    1. Kang K, Bachu M, Park SH, Kang K, Bae S, Park-Min KHet al. . IFN-gamma selectively suppresses a subset of TLR4-activated genes and enhancers to potentiate macrophage activation. Nat Commun 2019;10:3320. - PMC - PubMed
    1. Wu C, Xue Y, Wang P, Lin L, Liu Q, Li Net al. . IFN-gamma primes macrophage activation by increasing phosphatase and tensin homolog via downregulation of miR-3473b. J Immunol 2014;193:3036–44. - PubMed
    1. Garcia-Diaz A, Shin DS, Moreno BH, Saco J, Escuin-Ordinas H, Rodriguez GAet al. . Interferon receptor signaling pathways regulating PD-L1 and PD-L2 expression. Cell Rep 2017;19:1189–201. - PMC - PubMed
    1. Abiko K, Matsumura N, Hamanishi J, Horikawa N, Murakami R, Yamaguchi Ket al. . IFN-gamma from lymphocytes induces PD-L1 expression and promotes progression of ovarian cancer. Br J Cancer 2015;112:1501–9. - PMC - PubMed
    1. Wang XB, Zheng CY, Giscombe R, Lefvert AK. Regulation of surface and intracellular expression of CTLA-4 on human peripheral T cells. Scand J Immunol 2001;54:453–8. - PubMed

MeSH terms