. 2022 Feb 22;7(4):e156928.
doi: 10.1172/jci.insight.156928.

Angiogenesis depends upon EPHB4-mediated export of collagen IV from vascular endothelial cells

Affiliations

Angiogenesis depends upon EPHB4-mediated export of collagen IV from vascular endothelial cells

Di Chen et al. JCI Insight. .

Abstract

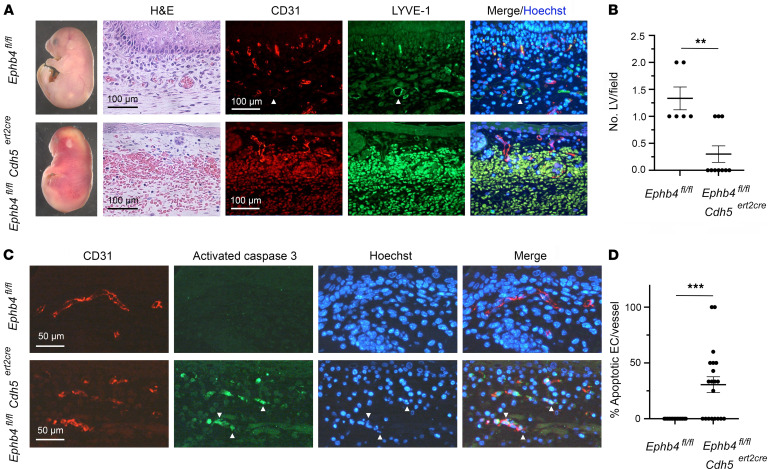
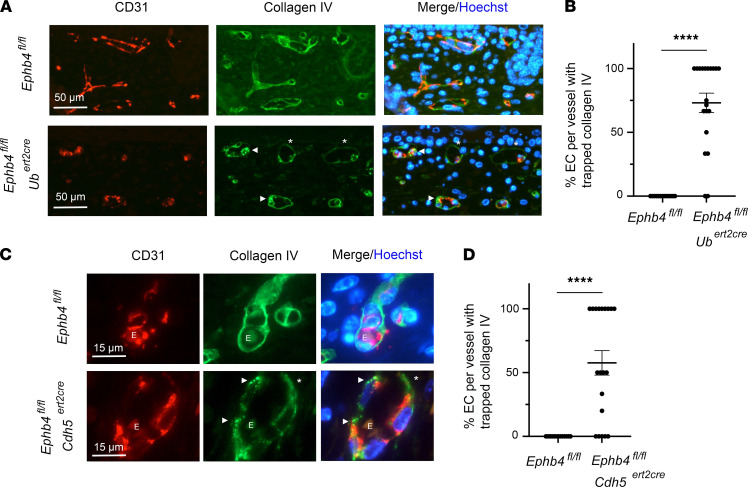
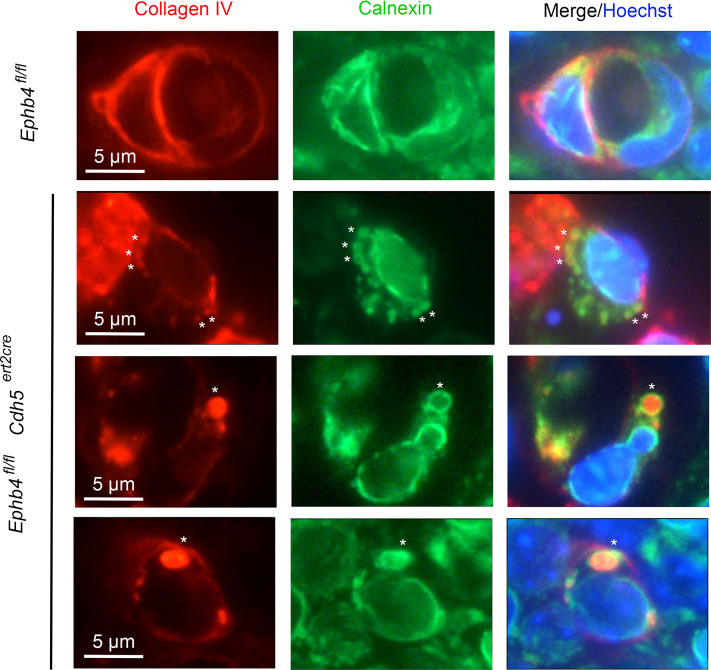
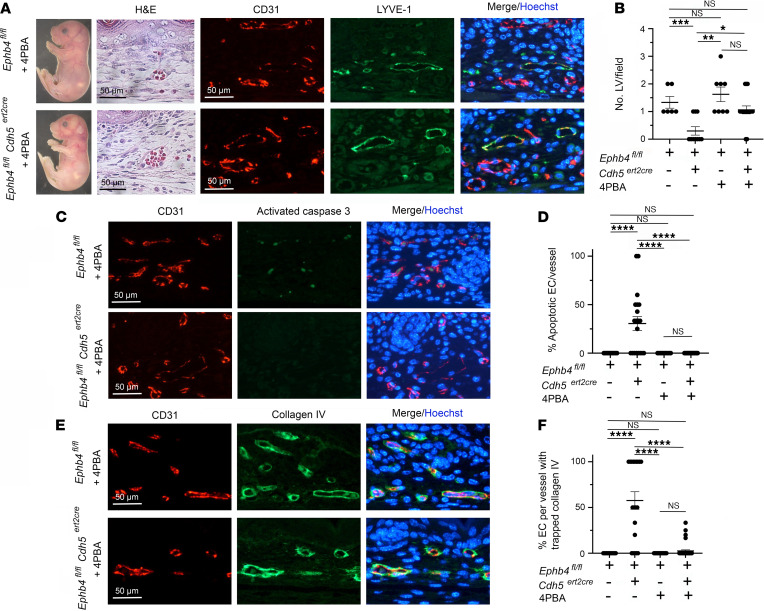
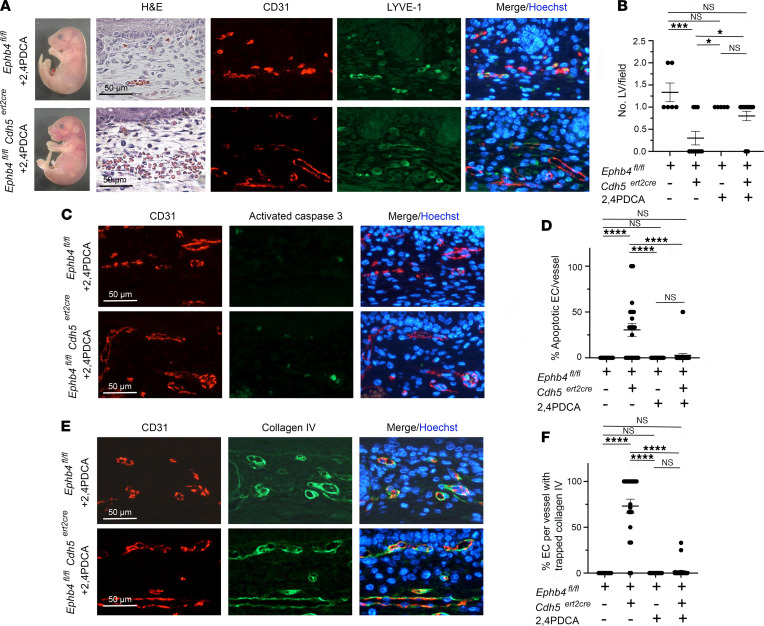
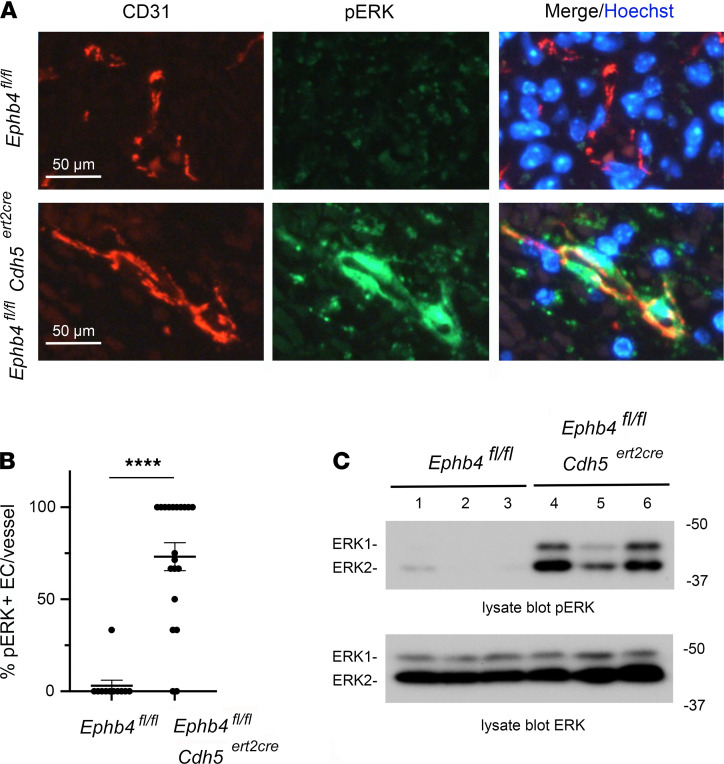
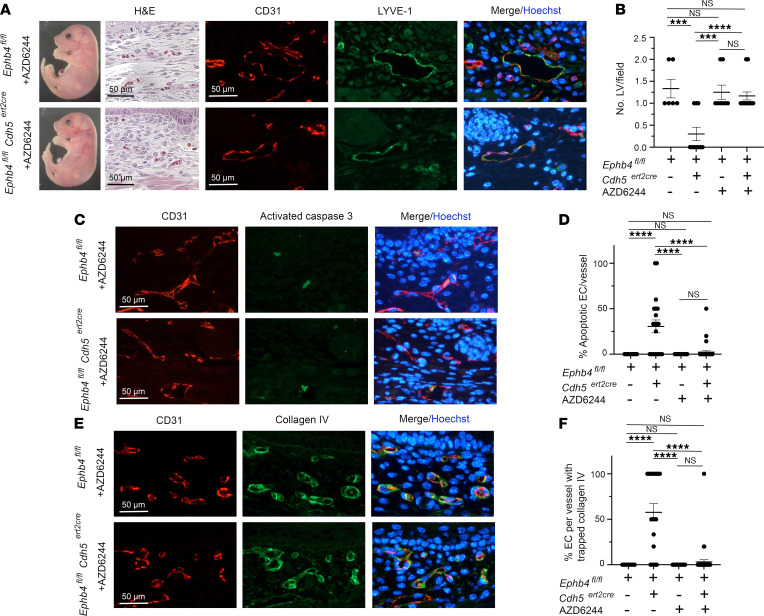
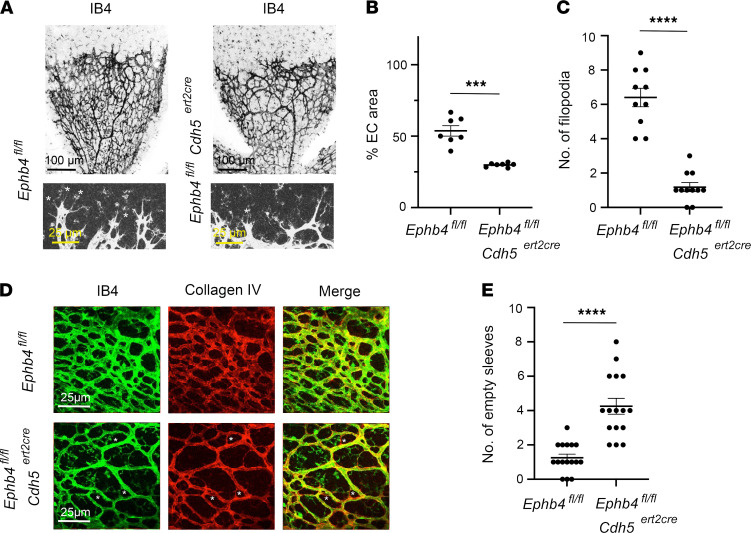
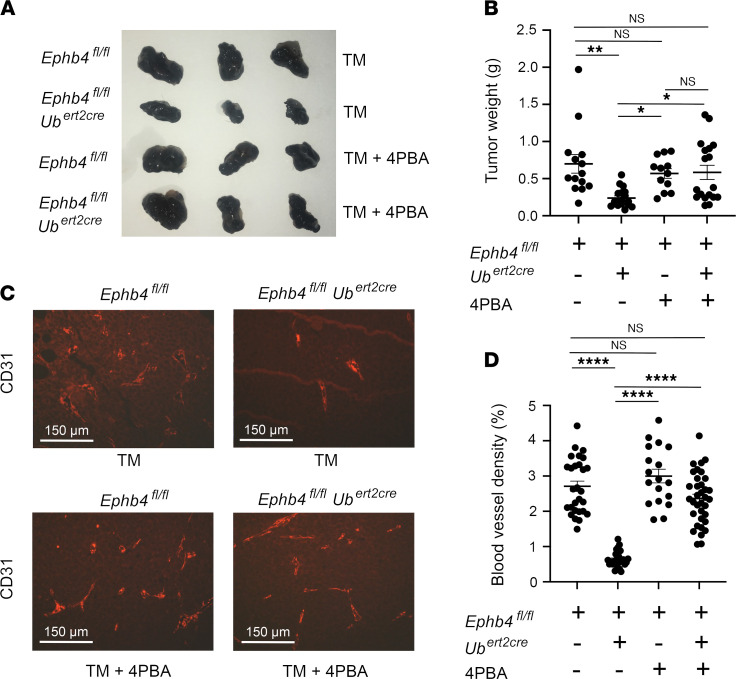
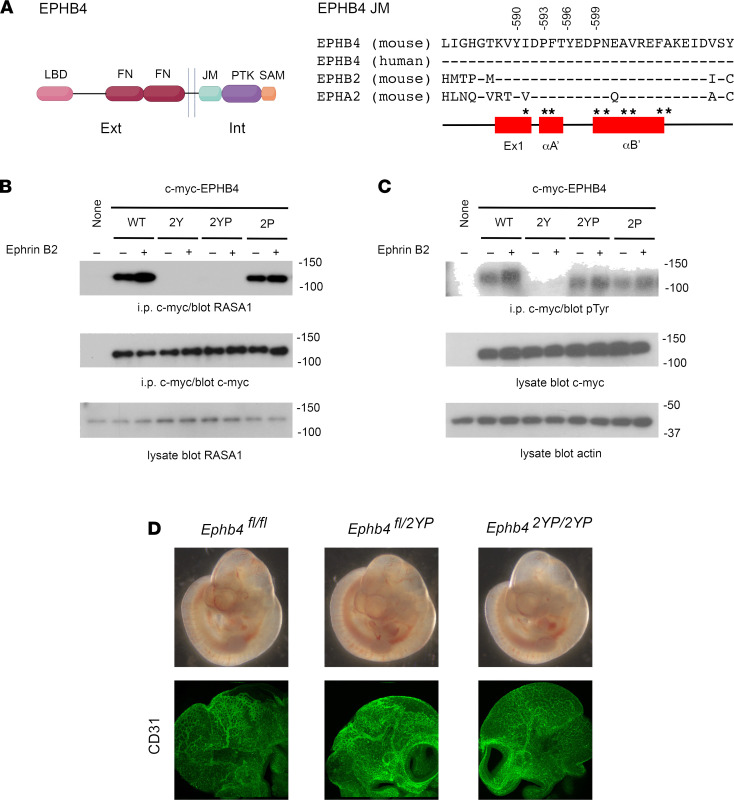
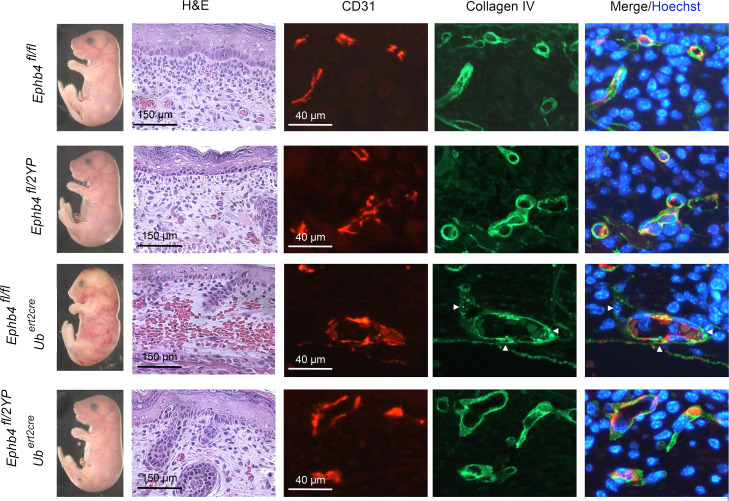
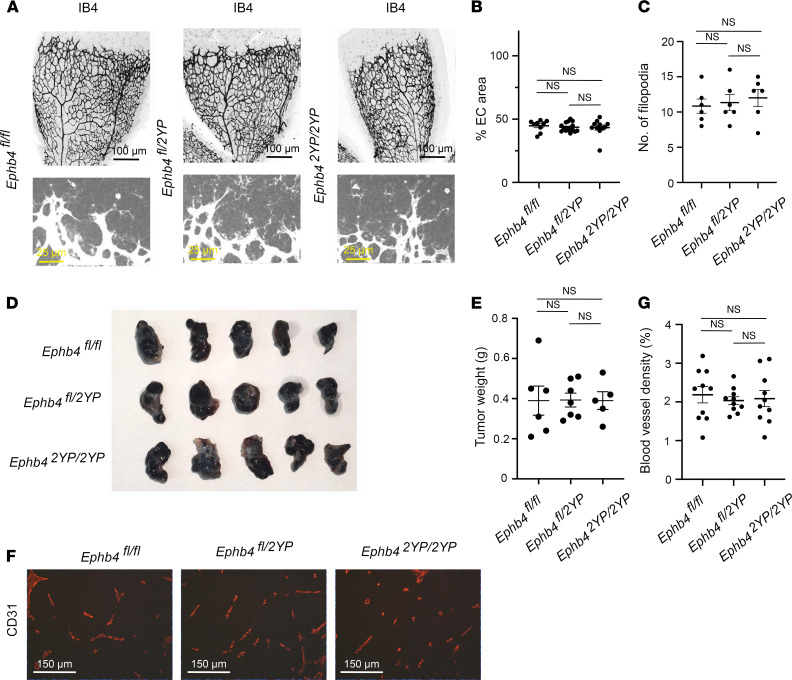
Capillary malformation-arteriovenous malformation (CM-AVM) is a blood vascular anomaly caused by inherited loss-of-function mutations in RASA1 or EPHB4 genes, which encode p120 Ras GTPase-activating protein (p120 RasGAP/RASA1) and Ephrin receptor B4 (EPHB4). However, whether RASA1 and EPHB4 function in the same molecular signaling pathway to regulate the blood vasculature is uncertain. Here, we show that induced endothelial cell-specific (EC-specific) disruption of Ephb4 in mice resulted in accumulation of collagen IV in the EC ER, leading to EC apoptotic death and defective developmental, neonatal, and pathological angiogenesis, as reported previously in induced EC-specific RASA1-deficient mice. Moreover, defects in angiogenic responses in EPHB4-deficient mice could be rescued by drugs that inhibit signaling through the Ras pathway and drugs that promote collagen IV export from the ER. However, EPHB4-mutant mice that expressed a form of EPHB4 that is unable to physically engage RASA1 but retains protein tyrosine kinase activity showed normal angiogenic responses. These findings provide strong evidence that RASA1 and EPHB4 function in the same signaling pathway to protect against the development of CM-AVM independent of physical interaction and have important implications for possible means of treatment of this disease.

Keywords: Angiogenesis; Endothelial cells; Signal transduction; Vascular Biology.


Conflict of interest statement

Conflict of interest: The authors have declared that no conflict of interest exists.

Figures

Figure 1
Figure 1. Hemorrhage, EC apoptosis, and paucity of LVs following induced EC-specific disruption of Ephb4 during developmental angiogenesis.
TM was administered to Ephb4fl/fl and Ephb4fl/fl Cdh5ert2cre embryos at E13.5 and embryos were harvested at E18.5. (A) Images at left show extensive cutaneous hemorrhage and an edematous appearance of Ephb4fl/fl Cdh5ert2cre embryos. H&E staining of skin sections demonstrated vascular hemorrhage, and combined anti-CD31 and anti–LYVE-1 antibody staining of sections revealed a reduced number of intact CD31loLYVE-1+ initial LVs in Ephb4fl/fl Cdh5ert2cre embryos (shown with arrowheads in images of Ephb4fl/fl sections). (B) Plot shows the number of identified CD31loLYVE-1+ LVs in randomly selected 200 × 200 μm areas of skin. Bars show the mean ± 1 SEM of LVs/field (Ephb4fl/fl, n = 5; Ephb4fl/fl Cdh5ert2cre, n = 10). (C) Skin sections were stained with anti-CD31 and anti–activated caspase 3 antibodies and Hoechst to identify apoptotic ECs. Examples of activated caspase 3–positive ECs with fragmented nuclei in images of Ephb4fl/fl Cdh5ert2cre sections are indicated with arrowheads. (D) Plot shows the percentage of apoptotic ECs in individual CD31+ BVs in skin selected from multiple randomly chosen areas. Bars show the mean ± 1 SEM of percentage apoptotic ECs per vessel (Ephb4fl/fl, n = 14; Ephb4fl/fl Cdh5ert2cre, n = 20). **, P < 0.01; ***, P < 0.001; Mann-Whitney test.
Figure 2
Figure 2. Collagen IV accumulation in ECs of induced EPHB4-deficient embryos.
TM was administered to Ephb4fl/fl Ubert2cre, Ephb4fl/fl Cdh5ert2cre, and corresponding littermate Ephb4fl/fl embryos at E13.5. (A and C) Embryos were harvested at E18.5 and skin sections were stained with anti-CD31 and anti–collagen IV antibodies and Hoechst. Note intracellular accumulation of collagen IV in ECs of Ephb4fl/fl Ubert2cre embryos (A) and Ephb4fl/fl Cdh5ert2cre embryos (C) (examples highlighted with arrowheads) and relative paucity of collagen IV in basement membranes (asterisks). E, erythrocyte. (B and D) Plots show the percentage of EC with intracellular collagen IV puncta in individual CD31+ BV in skin of embryos selected from multiple randomly chosen areas. Bars show the mean ± 1 SEM of percentage EC with collagen IV accumulation (B, Ephb4fl/fl, n = 13; Ephb4fl/fl Ubert2cre, n = 20), (C, Ephb4fl/fl, n = 13; Ephb4fl/fl Cdh5ert2cre, n = 20). ****, P < 0.0001; Mann-Whitney test.
Figure 3
Figure 3. Collagen IV is retained within the ER of induced EPHB4-deficient ECs during developmental angiogenesis.
TM was administered to Ephb4fl/fl and Ephb4fl/fl Cdh5ert2cre embryos at E13.5 and embryos were harvested at E18.5. Skin sections were stained with anti–collagen IV antibodies and antibodies against calnexin to identify the ER. Representative images of individual BVs are shown. Note collagen IV puncta surrounded by rings of calnexin in Ephb4fl/fl Cdh5ert2cre embryos (asterisks).
Figure 4
Figure 4. Partial rescue of developmental angiogenesis in induced EPHB4-deficient mice by 4PBA.
TM and 4PBA were administered to Ephb4fl/fl and Ephb4fl/fl Cdh5ert2cre embryos at E13.5, and embryos were harvested at E18.5. (A) Shown are an Ephb4fl/fl embryo and an Ephb4fl/fl Cdh5ert2cre embryo with mild cutaneous hemorrhage (see Table 1) and intact LVs confirmed by staining of skin sections with H&E and anti-CD31 and anti–LYVE-1 antibodies. (B) Plot shows the mean ± 1 SEM of CD31loLYVE-1+ LVs/field in randomly selected 200 x 200 μm areas of skin of Ephb4fl/fl embryos and Ephb4fl/fl Cdh5ert2cre embryos with mild hemorrhage (Ephb4fl/fl TM + 4PBA, n = 8; Ephb4fl/fl Cdh5ert2cre TM + 4PBA, n = 16). Data from Ephb4fl/fl and Ephb4fl/fl Cdh5ert2cre embryos treated with TM alone are also shown (Figure 1). (C) Skin sections were stained with anti-CD31 and anti–activated caspase 3 antibodies and Hoechst to identify apoptotic ECs. (D) Plot shows the mean ± 1 SEM of the percentage apoptotic ECs in individual CD31+ BVs from randomly chosen areas (Ephb4fl/fl Cdh5ert2cre embryos with mild hemorrhage) (Ephb4fl/fl TM + 4PBA, n = 11; Ephb4fl/fl Cdh5ert2cre TM + 4PBA, n = 42). (E) Skin sections were stained with anti-CD31 and anti–collagen IV antibodies and Hoechst to determine the distribution of collagen IV in BVs. (F) Plot shows the mean ± 1 SEM of percentage ECs with collagen accumulation in individual CD31+ BVs from randomly chosen areas (Ephb4fl/fl Cdh5ert2cre embryos with mild hemorrhage) (Ephb4fl/fl TM + 4PBA, n = 19; Ephb4fl/fl Cdh5ert2cre TM + 4PBA, n = 38). *, P < 0.05; **, P < 0.01; ***, P < 0.001; ****, P < 0.0001; 1-way ANOVA with Tukey.
Figure 5
Figure 5. Partial rescue of developmental angiogenesis in induced EPHB4-deficient mice by 2,4PDCA.
TM and 2,4PDCA were administered to Ephb4fl/fl and Ephb4fl/fl Cdh5ert2cre embryos at E13.5, and embryos were harvested at E18.5. (A) Shown are an Ephb4fl/fl embryo and an Ephb4fl/fl Cdh5ert2cre embryo with mild cutaneous hemorrhage (see Table 1) and intact LVs confirmed by staining of skin sections with H&E and anti-CD31 and anti–LYVE-1 antibodies. (B) Plot shows the mean ± 1 SEM of CD31loLYVE-1+ LVs/field in randomly selected 200 x 200 μm areas of skin of Ephb4fl/fl embryos and Ephb4fl/fl Cdh5ert2cre embryos with mild hemorrhage (Ephb4fl/fl TM + 2,4PDCA, n = 5; Ephb4fl/fl Cdh5ert2cre TM + 2,4PDCA, n = 15). Data from Ephb4fl/fl and Ephb4fl/fl Cdh5ert2cre embryos treated with TM alone are also shown (Figure 1). (C) Skin sections were stained with anti-CD31 and anti–activated caspase 3 antibodies and Hoechst to identify apoptotic ECs. (D) Plot shows the mean ± 1 SEM of percentage apoptotic ECs in individual CD31+ BVs from randomly chosen areas (Ephb4fl/fl Cdh5ert2cre embryos with mild hemorrhage) (Ephb4fl/fl TM + 2,4PDCA, n = 16; Ephb4fl/fl Cdh5ert2cre TM + 2,4PDCA, n = 36). (E) Skin sections were stained with anti-CD31 and anti–collagen IV antibodies and Hoechst to determine the distribution of collagen IV in BVs. (F) Plot shows the mean ± 1 SEM of percentage of ECs with collagen accumulation in individual CD31+ BVs from randomly chosen areas (Ephb4fl/fl Cdh5ert2cre embryos with mild hemorrhage) (Ephb4fl/fl TM + 2,4PDCA, n = 19; Ephb4fl/fl Cdh5ert2cre TM + 2,4PDCA, n = 36). *, P < 0.05; ***, P < 0.001; ****, P < 0.0001; 1-way ANOVA with Tukey.
Figure 6
Figure 6. Activation of MAPK in EPHB4-deficient ECs during developmental angiogenesis.
(A) TM was administered to Ephb4fl/fl and Ephb4fl/fl Cdh5ert2cre embryos at E13.5 and embryos were harvested at E18.5. (A) Skin sections were stained with anti-CD31 and anti–phospho-ERK MAPK antibodies (pERK) and Hoechst. Note strong activation of MAPK in ECs of Ephb4fl/fl Cdh5ert2cre embryos. (B) Plot shows the percentage of pERK+ ECs per BV identified in randomly selected areas of skin. Bars show the mean ± 1 SEM of percentage pERK+ ECs per vessel (Ephb4fl/fl, n = 11; Ephb4fl/fl Cdh5ert2cre, n = 20). ****, P < 0.0001, Mann-Whitney test. (C) Liver tissue from individual embryos was analyzed by Western blotting using pERK antibodies. Note constitutive activation of MAPK in Ephb4fl/fl Cdh5ert2cre liver samples. See complete unedited blots in the supplemental material.
Figure 7
Figure 7. Partial rescue of developmental angiogenesis in induced EPHB4-deficient mice by AZD6244.
TM and AZD6244 were administered to Ephb4fl/fl and Ephb4fl/fl Cdh5ert2cre embryos at E13.5, and embryos were harvested at E18.5. (A) Shown are an Ephb4fl/fl embryo and an Ephb4fl/fl Cdh5ert2cre embryo with mild cutaneous hemorrhage (see Table 1) and intact LVs confirmed by staining of skin sections with H&E and anti-CD31 and anti–LYVE-1 antibodies. (B) Plot shows the mean ± 1 SEM of CD31loLYVE-1+ LVs/field in randomly selected 200 x 200 μm areas of skin of Ephb4fl/fl embryos and Ephb4fl/fl Cdh5ert2cre embryos with mild hemorrhage (Ephb4fl/fl TM + AZD6244, n = 8; Ephb4fl/fl Cdh5ert2cre TM + AZD6244, n = 18). Data from Ephb4fl/fl and Ephb4fl/fl Cdh5ert2cre embryos treated with TM alone are also shown (Figure 1). (C) Skin sections were stained with anti-CD31 and anti–activated caspase 3 antibodies and Hoechst to identify apoptotic ECs. (D) Plot shows the mean ± 1 SEM of percentage apoptotic ECs in individual CD31+ BVs from randomly chosen areas (Ephb4fl/fl Cdh5ert2cre embryos with mild hemorrhage) (Ephb4fl/fl TM + AZD6244, n = 16; Ephb4fl/fl Cdh5ert2cre TM + AZD6244, n = 37). (E) Skin sections were stained with anti-CD31 and anti–collagen IV antibodies and Hoechst to determine the distribution of collagen IV in BVs. (F) Plot shows the mean ± 1 SEM of percentage of ECs with collagen accumulation in individual CD31+ BVs from randomly chosen areas (Ephb4fl/fl Cdh5ert2cre embryos with mild hemorrhage) (Ephb4fl/fl TM + 4PBA, n = 19; Ephb4fl/fl Cdh5ert2cre TM + 4PBA alone, n = 44). ***, P < 0.001; ****, P < 0.0001; 1-way ANOVA with Tukey.
Figure 8
Figure 8. Impaired retinal angiogenesis in induced EC-specific EPHB4-deficient mice.
TM was administered to Ephb4fl/fl and Ephb4fl/fl Cdh5ert2cre mice at P1 and P2. Retinas were harvested at P6 and stained with IB4 to identify BVs and anti–collagen IV antibodies. (A) Representative low-power images of IB4 staining are shown at top. Representative higher power images of IB4 staining at the angiogenic front are shown at bottom. Asterisks indicate filopodia. (B) Plot shows the percentage coverage of retinas with ECs. Bars show the mean ± 1 SEM of percentage EC coverage of individual retinas (Ephb4fl/fl, n = 7; Ephb4fl/fl Cdh5ert2cre, n = 7). (C) Plot shows the number of filopodia per 300 μm of angiogenic front that were randomly selected. Bars show the mean ± 1 SEM of filopodia (Ephb4fl/fl, n = 10; Ephb4fl/fl Cdh5ert2cre, n = 11). (D) Shown are representative images of IB4 and anti–collagen IV staining. Empty collagen sleeves are indicated with asterisks. (E) Plot shows the number of empty sleeves in randomly selected 200 μm x 200 μm areas of retinas. Bars show the mean ± 1 SEM of empty sleeves (Ephb4fl/fl, n = 16; Ephb4fl/fl Cdh5ert2cre, n = 16). ***, P < 0.001; ****, P < 0.0001; Student’s 2-sample t test.
Figure 9
Figure 9. Reduced B16 melanoma growth in adult induced EPHB4-deficient mice associated with impaired tumor angiogenesis.
Adult TM-treated Ephb4fl/fl and Ephb4fl/fl Ubert2cre mice were injected in flanks with B16 melanoma cells and tumors were harvested 13 days later. Some mice received 4PBA at the same time as the tumor and on all subsequent days until tumor harvest. (A) Representative images of explanted tumors. (B) Plot shows tumor weights at day 13. Bars represent mean ± 1 SEM tumor weight (Ephb4fl/fl TM alone, n = 14; Ephb4fl/fl Ubert2cre TM alone, n = 18; Ephb4fl/fl TM + 4PBA, n = 12; Ephb4fl/fl Ubert2cre TM + 4PBA, n = 18). (C) Sections of explanted tumors were stained with anti-CD31 antibodies to identify BVs. Shown are representative images. (D) Plot shows percentage BV coverage of randomly selected 200 × 200 μm areas of tumors. Bars represent mean ± 1 SEM percentage BV coverage (Ephb4fl/fl TM alone, n = 26; Ephb4fl/fl Ubert2cre TM alone, n = 27; Ephb4fl/fl TM + 4PBA, n = 18; Ephb4fl/fl Ubert2cre TM + 4PBA, n = 35). *, P < 0.05; **, P < 0.01; ****, P < 0.0001; 1-way ANOVA with Tukey.
Figure 10
Figure 10. Normal vascular development in homozygous EPHB4 2YP mice.
(A) At left is a schematic representation of EPHB4 showing the ligand-binding domain (LBD), fibronectin domains (FN), JM segment, PTK domain (PTK), and sterile alpha motif domain (SAM). Ext, extracellular; int, intracellular. At right are shown the amino acid sequences of the JM regions of mouse and human EPHB4 and mouse EPHB2 and EPHA4. Numbering of the indicated conserved tyrosine and proline residues (mutated in EPHB4 2YP) is based upon mouse EPHB4 isoform b. Below are shown the secondary structure elements of the JM segment (27). Ex1, extended strand segment; αA’, single turn helix; αB’, 4 turn helix. Asterisks indicate residues that contact the PTK domain. (B and C) Cos-7 cells were transfected with c-myc–tagged wild-type (WT), Y590F/Y596F (2Y), Y590F/P593G/Y596F/P599G (2YP), or P593G/P599G (2P) EPHB4. Cells were stimulated or not with Ephrin B2, and transfected EPHB4 receptors were immunoprecipitated from lysates using an anti–c-myc antibody. (B) Coimmunoprecipitated RASA1 was detected by Western blotting. (C) Phosphotyrosine content of immunoprecipitated EPHB4 was detected by Western blotting. (D) Heterozygous Ephb4fl/2YP mice were intercrossed and embryos were harvested at E10.5. Development of Ephb4fl/2YP and Ephb42YP/2YP was normal at E10.5 (top). Anti-CD31 antibody staining reveals a normal vasculature in the head region of Ephb4fl/2YP and Ephb42YP/2YP embryos (bottom). See complete unedited blots in the supplemental material.
Figure 11
Figure 11. Absence of hemorrhage and EC collagen IV accumulation in ECs of induced EPHB4 2YP embryos.
TM was administered to littermate embryos of the indicated genotypes at E13.5 and embryos were harvested at E18.5. Hemorrhage that was confirmed by H&E staining of skin sections was observed in Ephb4fl/fl Ubert2cre embryos but not Ephb4fl/2YP Ubert2cre embryos or Cre-negative embryos. Skin sections were additionally stained with anti-CD31 and anti–collagen IV antibodies and Hoechst. Note accumulation of collagen IV in ECs of Ephb4fl/fl Ubert2cre embryos (arrowheads) but not embryos of other genotypes. Scale bars: 150 μm (H&E), 40 μm (anti-CD31).
Figure 12
Figure 12. Normal retinal and pathological angiogenesis in EPHB4 2YP mice.
(AC) Retinas were harvested from mice of the indicated littermate mice at P6 and stained with IB4 to identify BVs. (A) Representative low-power images of IB4 staining are shown at top. Representative higher power images of IB4 staining at the angiogenic front are shown at bottom. Asterisks indicate filopodia. Scale bars: 100 μm (top), 25 μm (bottom). (B) Plot shows the percentage coverage of retinas with ECs. Bars show the mean ± 1 SEM of percentage EC coverage of individual retinas (Ephb4fl/fl, n = 9; Ephb4fl/2YP, n = 15; Ephb42YP/2YP, n = 11). (C) Plot shows the number of filopodia per 300 μm of angiogenic front that were randomly selected. Bars show the mean ± 1 SEM of filopodia (Ephb4fl/fl, n = 6; Ephb4fl/2YP, n = 6; Ephb42YP/2YP, n = 6). (DG) Adult mice of the indicated genotypes were injected in flanks with B16 melanoma cells, and tumors were harvested 13 days later. (D) Representative images of explanted tumors. (E) Plot shows tumor weights at day 13. Bars represent mean ± 1 SEM tumor weight (Ephb4fl/fl, n = 6; Ephb4fl/2YP, n = 7; Ephb42YP/2YP, n = 5). (E) Sections of explanted tumors were stained with anti-CD31 antibodies and Hoechst to identify BVs. Shown are representative images. (F) Sections of explanted tumors were stained with anti-CD31 antibodies to identify BVs. Shown are representative images. Scale bar: 150 μm. (G) Plot shows percentage BV coverage of randomly selected 200 × 200 μm areas of tumors. Bars represent mean ± 1 SEM percentage BV coverage (Ephb4fl/fl, n = 10; Ephb4fl/2YP, n = 10; Ephb42YP/2YP, n = 10). One-way ANOVA with Tukey.

References

    1. Eerola I, et al. Capillary malformation-arteriovenous malformation, a new clinical and genetic disorder caused by RASA1 mutations. Am J Hum Genet. 2003;73(6):1240–1249. doi: 10.1086/379793. - DOI - PMC - PubMed
    1. Revencu N, et al. RASA1 mutations and associated phenotypes in 68 families with capillary malformation-arteriovenous malformation. Hum Mutat. 2013;34(12):1632–1641. doi: 10.1002/humu.22431. - DOI - PubMed
    1. Revencu N, et al. Parkes Weber syndrome, vein of Galen aneurysmal malformation, and other fast-flow vascular anomalies are caused by RASA1 mutations. Hum Mutat. 2008;29(7):959–965. doi: 10.1002/humu.20746. - DOI - PubMed
    1. Amyere M, et al. Germline loss-of-function mutations in EPHB4 cause a second form of capillary malformation-arteriovenous malformation (CM-AVM2) deregulating RAS-MAPK signaling. Circulation. 2017;136(11):1037–1048. doi: 10.1161/CIRCULATIONAHA.116.026886. - DOI - PubMed
    1. Burrows PE, et al. Lymphatic abnormalities are associated with RASA1 gene mutations in mouse and man. Proc Natl Acad Sci U S A. 2013;110(21):8621–8626. doi: 10.1073/pnas.1222722110. - DOI - PMC - PubMed

Publication types

MeSH terms