Clinical Trial
. 2022 Apr 15;205(8):949-958.
doi: 10.1164/rccm.202108-1808OC.

Daily Exposure to Mild Intermittent Hypoxia Reduces Blood Pressure in Male Patients with Obstructive Sleep Apnea and Hypertension

Affiliations
Clinical Trial

Daily Exposure to Mild Intermittent Hypoxia Reduces Blood Pressure in Male Patients with Obstructive Sleep Apnea and Hypertension

Gino S Panza et al. Am J Respir Crit Care Med. .

Abstract

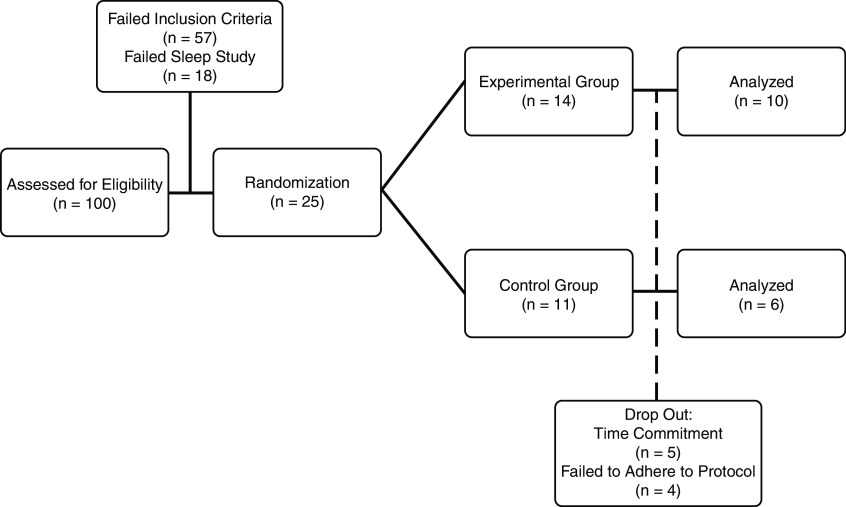
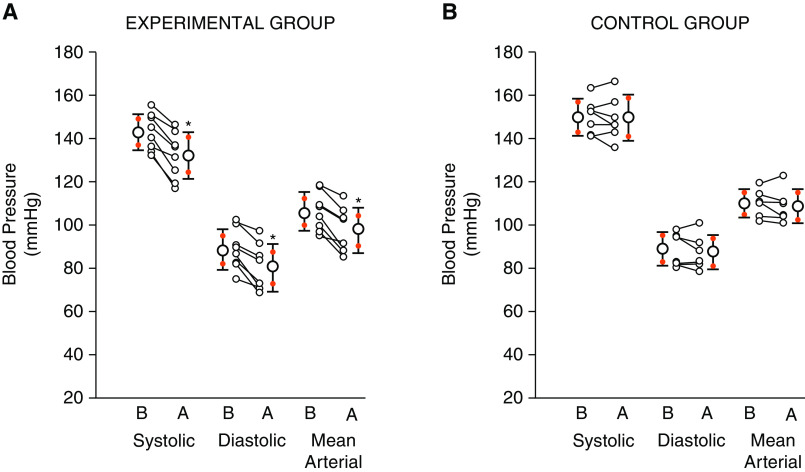
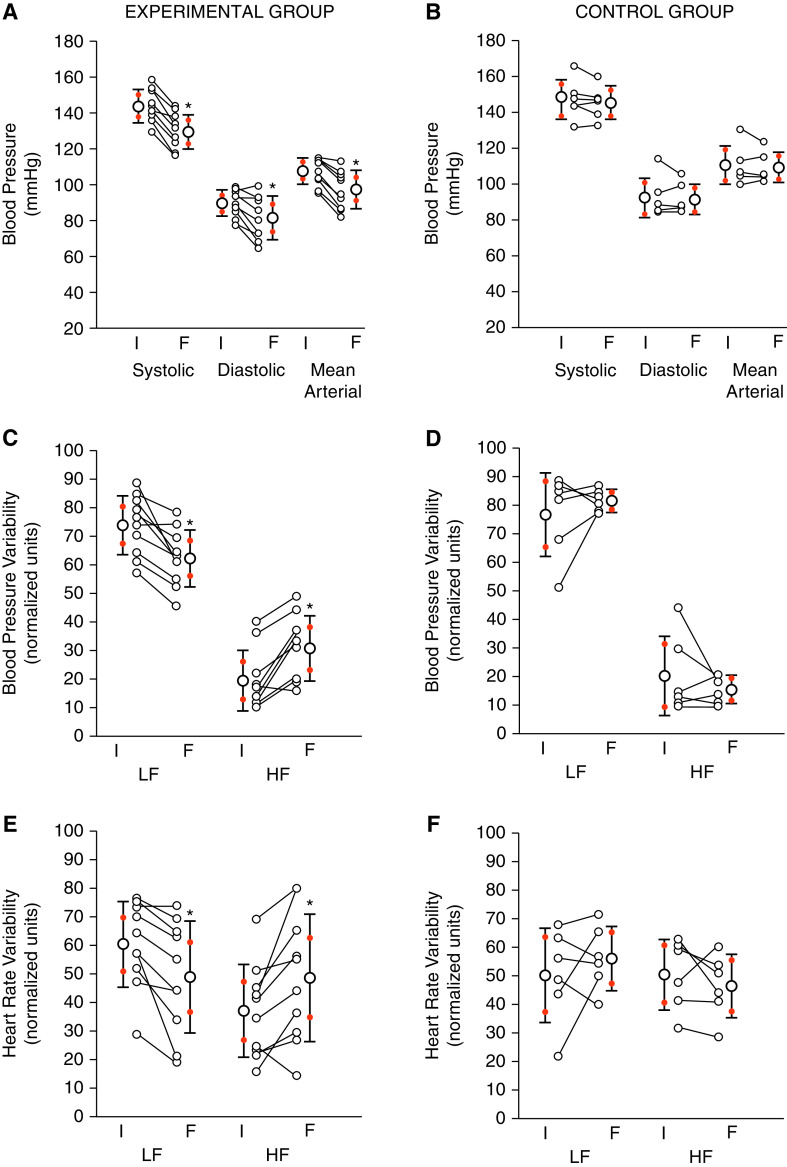
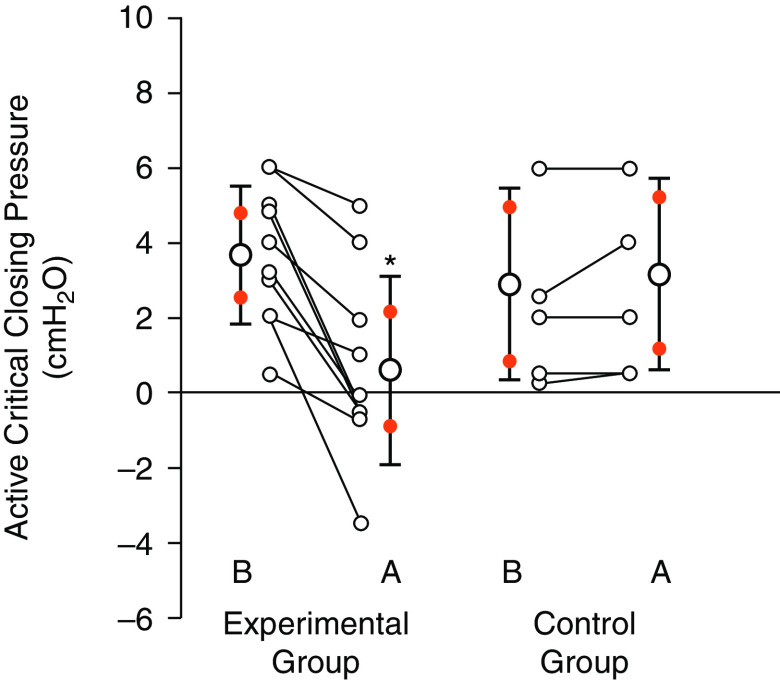
Rationale: Daily exposure to mild intermittent hypoxia (MIH) may elicit beneficial cardiovascular outcomes. Objectives: To determine the effect of 15 days of MIH and in-home continuous positive airway pressure treatment on blood pressure in participants with obstructive sleep apnea and hypertension. Methods: We administered MIH during wakefulness 5 days/week for 3 weeks. The protocol consisted of twelve 2-minute bouts of hypoxia interspersed with 2 minutes of normoxia. End-tidal carbon dioxide was maintained 2 mm Hg above baseline values throughout the protocol. Control participants were exposed to a sham protocol (i.e., compressed air). All participants were treated with continuous positive airway pressure over the 3-week period. Results are mean ± SD. Measurements and Main Results: Sixteen male participants completed the study (experimental n = 10; control n = 6). Systolic blood pressure at rest during wakefulness over 24 hours was reduced after 15 days of MIH (142.9 ± 8.6 vs. 132.0 ± 10.7 mm Hg; P < 0.001), but not following the sham protocol (149.9 ± 8.6 vs. 149.7 ± 10.8 mm Hg; P = 0.915). Thus, the reduction in blood pressure from baseline was greater in the experimental group compared with control (-10.91 ± 4.1 vs. -0.17 ± 3.6 mm Hg; P = 0.003). Modifications in blood pressure were accompanied by increased parasympathetic and reduced sympathetic activity in the experimental group, as estimated by blood pressure and heart rate variability analysis. No detrimental neurocognitive and metabolic outcomes were evident following MIH. Conclusions: MIH elicits beneficial cardiovascular and autonomic outcomes in males with OSA and concurrent hypertension. Clinical trial registered with www.clinicaltrials.gov (NCT03736382).

Keywords: continuous positive airway pressure; hypertension; intermittent hypoxia; obstructive sleep apnea.


Figures

Figure 1.
Figure 1.
Consolidated Standards of Reporting Trials flow diagram.
Figure 2.
Figure 2.
(A and B) Scatterplots that show average values (white circles) ± SD with 95% confidence intervals (orange circles overlaying the SD bars) for systolic, diastolic, and mean arterial blood pressure calculated from measures obtained during wake-rest over a 24-hour period before and after completion of the intermittent hypoxia (A) or sham protocol (B). Individual data for each participant are also shown (white circles connected by solid lines). (A and B) Note that blood pressure during wake-rest over the 24-hour period was reduced after repeated daily exposure to intermittent hypoxia (A) but not after exposure to the sham protocol (B). Experimental group n = 8 (blood pressure was not available in 2 participants because of technical difficulties); control group n = 6. A 2 × 2 repeated measures ANOVA in conjunction with a Student-Newman-Keuls post hoc analysis was used to compare differences within and between groups. *Significantly different from baseline. A = after protocol; B = before protocol.
Figure 3.
Figure 3.
(A and B) Scatterplots that show average values (white circles) ± SD with 95% confidence intervals (orange circles overlaying the SD bars) calculated from beat-to-beat systolic, diastolic, and mean arterial blood pressure recorded during baseline on the initial and final day of the intermittent hypoxia (A) or sham (B) protocol. (C and D) Likewise, blood pressure variability in the low- and high-frequency regions of the power spectrum determined from beat-to-beat blood pressure measurements obtained during baseline on the initial and final day of the intermittent hypoxia (C) or sham protocol (D). (E and F) Lastly, scatterplots that show heart rate variability in the low- and high-frequency regions of the power spectrum determined from an electrocardiogram obtained during baseline on the initial and final day of the intermittent hypoxia (E) or sham protocol (F). Individual data for each participant are also shown (white circles connected by solid lines). Note that beat-to-beat blood pressure measured during baseline on the final day, before exposure to the intermittent hypoxia or sham protocol, was reduced in the experimental group compared with the control group (A). (C and E) In addition, note that in response to repeated daily exposure to mild intermittent hypoxia, blood pressure and heart rate variability markers of sympathetic nervous system activity (i.e., low-frequency) and parasympathetic nervous system activity (i.e., high-frequency) were reduced (C) and increased (E), respectively. (D and F) In contrast, these changes were not evident after repeated daily exposure to the sham protocol . Experimental group n = 10; control group n = 6. A 2 × 2 repeated measures ANOVA in conjunction with a Student-Newman-Keuls post hoc analyses was used to compare differences within and between groups. *Significantly different from baseline. F = final day; HF = high-frequency; I = initial day; LF = low-frequency.
Figure 4.
Figure 4.
Scatterplots that show the average values (white circles) ± SD, with 95% confidence intervals (orange circles overlaying the SD bars), of the active critical closing pressure measured during sleep before and after exposure to the mild intermittent hypoxia (n = 10) or sham protocol (n = 6). Note that the active critical closing pressure was reduced following exposure to mild intermittent hypoxia but not after exposure to the sham protocol. Individual data for each participant is also shown (white circles connected by solid lines). A 2 × 2 repeated measures ANOVA in conjunction with a Student-Newman-Keuls post hoc analyses was used to compare differences within and between groups. *Significantly different from baseline. A = after protocol; B = before protocol.
Figure 5.
Figure 5.
(A) Scatterplots that show the average values (white circles) ± SD, with 95% confidence intervals (orange circles overlaying the SD bars), showing the therapeutic continuous positive airway pressure measured during sleep at baseline and following exposure to mild intermittent hypoxia (MIH) or the sham protocol. Individual data for each participant are also shown (white circles connected by solid lines). Note that the therapeutic pressure was reduced following exposure to MIH but not the sham protocol. (B) Scatterplots that show the average values (white circles) ± SD, with 95% confidence intervals (orange circles overlaying the SD bars), showing adherence to in-home treatment with continuous positive airway pressure during the initial and final half of the MIH or sham protocol. Note that adherence improved in the final half of the protocol in those participants exposed to MIH but not the sham protocol. Individual data for each participant are also shown (white circles connected by solid lines). A 2 × 2 repeated measures ANOVA in conjunction with a Student-Newman-Keuls post hoc analyses was used to compare differences within and between groups. *Significantly different compared with baseline. A = after protocol; B = before protocol; F = final half of the protocol; I = initial half of the protocol.

Comment in

References

    1. Dempsey JA, Veasey SC, Morgan BJ, O’Donnell CP. Pathophysiology of sleep apnea. Physiol Rev . 2010;90:47–112. - PMC - PubMed
    1. Ramar K, Caples SM. Vascular changes, cardiovascular disease and obstructive sleep apnea. Future Cardiol . 2011;7:241–249. - PubMed
    1. Lavie CJ, Arena R, Swift DL, Johannsen NM, Sui X, Lee D-C, et al. Exercise and the cardiovascular system: clinical science and cardiovascular outcomes. Circ Res . 2015;117:207–219. - PMC - PubMed
    1. Sawyer AM, Gooneratne NS, Marcus CL, Ofer D, Richards KC, Weaver TE. A systematic review of CPAP adherence across age groups: clinical and empiric insights for developing CPAP adherence interventions. Sleep Med Rev . 2011;15:343–356. - PMC - PubMed
    1. Burns SP, Rad MY, Bryant S, Kapur V. Long-term treatment of sleep apnea in persons with spinal cord injury. Am J Phys Med Rehabil . 2005;84:620–626. - PubMed

Publication types

Associated data