. 2022 Jan 10;57(1):32-46.e8.
doi: 10.1016/j.devcel.2021.12.007.

Quiescent human glioblastoma cancer stem cells drive tumor initiation, expansion, and recurrence following chemotherapy

Affiliations

Quiescent human glioblastoma cancer stem cells drive tumor initiation, expansion, and recurrence following chemotherapy

Xuanhua P Xie et al. Dev Cell. .

Abstract

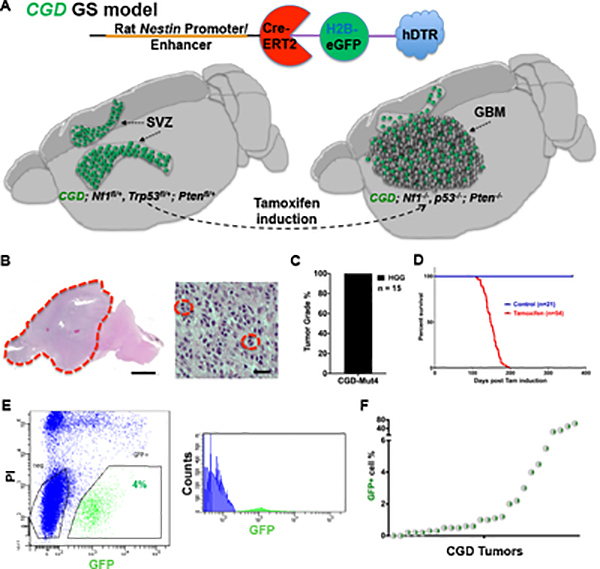
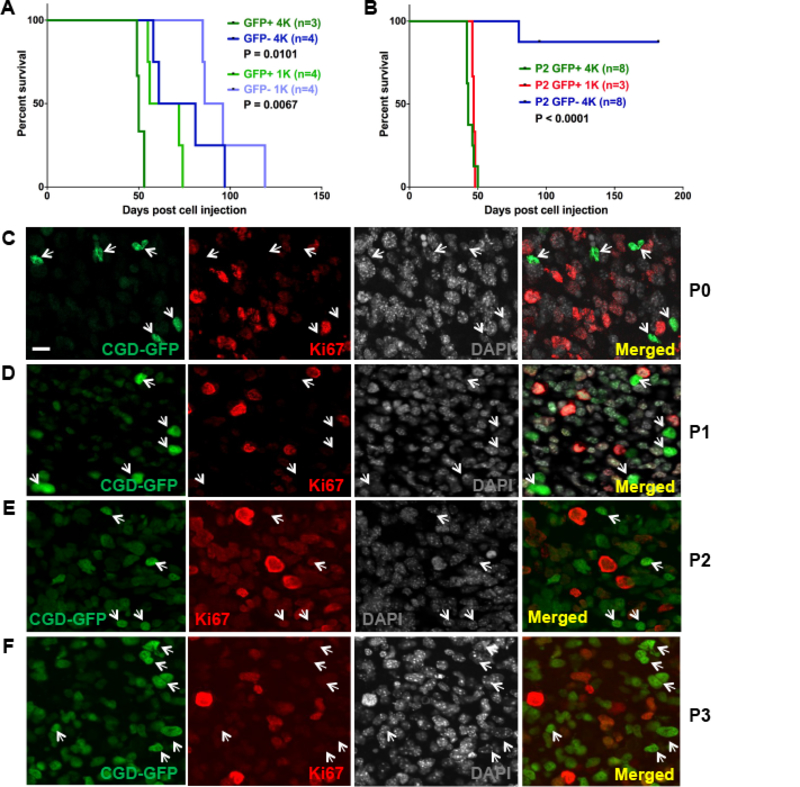
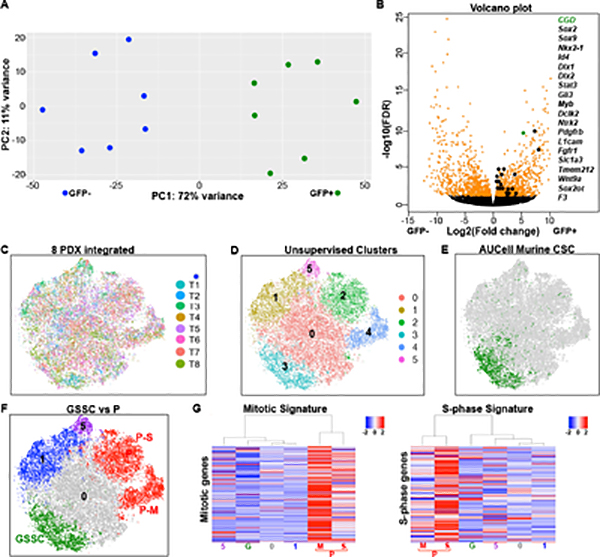
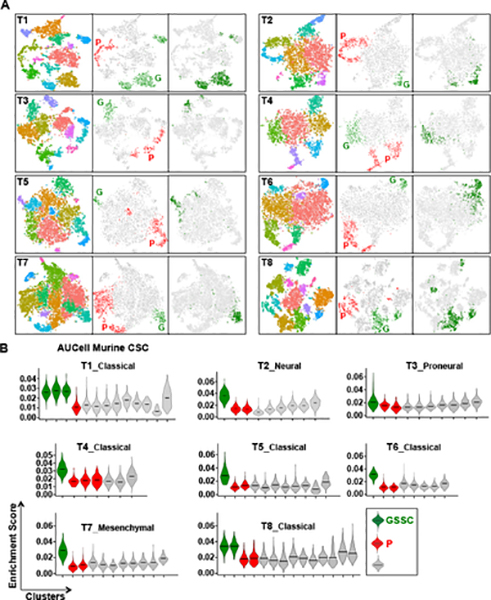
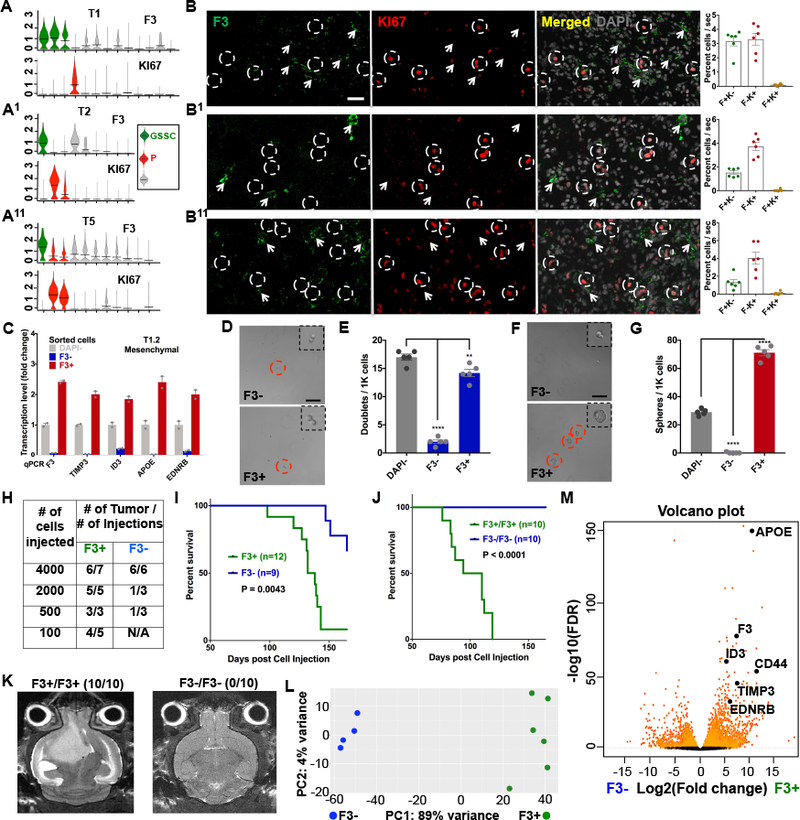
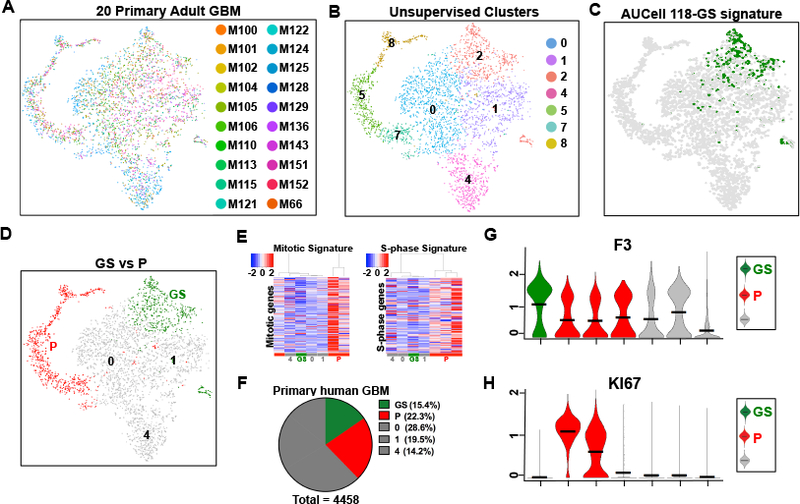
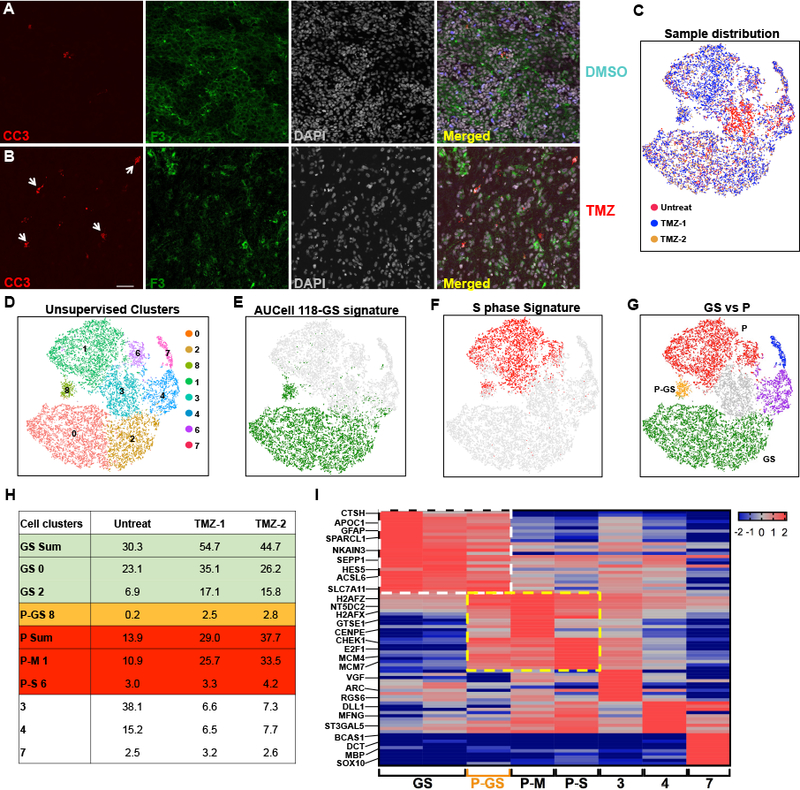
We test the hypothesis that glioblastoma harbors quiescent cancer stem cells that evade anti-proliferative therapies. Functional characterization of spontaneous glioblastomas from genetically engineered mice reveals essential quiescent stem-like cells that can be directly isolated from tumors. A derived quiescent cancer-stem-cell-specific gene expression signature is enriched in pre-formed patient GBM xenograft single-cell clusters that lack proliferative gene expression. A refined human 118-gene signature is preserved in quiescent single-cell populations from primary and recurrent human glioblastomas. The F3 cell-surface receptor mRNA, expressed in the conserved signature, identifies quiescent tumor cells by antibody immunohistochemistry. F3-antibody-sorted glioblastoma cells exhibit stem cell gene expression, enhance self-renewal in culture, drive tumor initiation and serial transplantation, and reconstitute tumor heterogeneity. Upon chemotherapy, the spared cancer stem cell pool becomes activated and accelerates transition to proliferation. These results help explain conventional treatment failure and lay a conceptual framework for alternative therapies.

Keywords: F3 receptor; cancer stem cells; chemoresistance; glioblastoma; heterogeneity; quiescence; recurrence; single-cell RNA sequencing; temozolomide.


Conflict of interest statement

Declaration of interests The authors declare no competing interests.

Figures

Figure 1.
Figure 1.. CGD transgene GFP labels putative GBM CSC initiated from wild-type neural stem cells.
(A) Upper panel: Depiction of transgenic products generated from CGD transgene. Cre-ERT2, H2B-eGFP, and hDTR are translated from the same transcript through ribosomal skipping. Lower Panel: Cartoon illustrates localization of GFP proteins in NSC of wild-type SVZ (left) and, upon Cre induction, putative GBM CSC. (B) Hematoxylin and eosin (H&E) staining of spontaneous GBM (dotted red line) in representative brain sagittal section from CGD;Nf1fl/+;Trp53fl/+;Ptenfl/+ mice. Actively dividing GBM cells are highlighted by red circles (right panel). Scale bars in left and right panels: 1mm and 20um. (C) CGD-GBM mice develop high-grade gliomas (HGG). (D) Survival curves demonstrate fully penetrant mortality induced by CGD transgene following tamoxifen administration within three to seven months after induction. (E) Representative FACS sorting images show a 4% GFP+ cell compartment in a spontaneous CGD-GBM. (F) 22 of 26 CGD GBM contain fewer than 6% GFP+ cells. See also Figure S1.
Figure 2.
Figure 2.. Quiescent GFP+ GBM cancer stem cells accelerate tumor initiation and serial transplantation.
(A) Survival curves of passage 1 (P1) mice transplanted with 1000 (GFP+: light green; GFP−: light blue) or 4000 (GFP+: dark green; GFP−: dark blue) cells isolated from spontaneous (P0) CGD tumors. (B) Survival curves of Passage 2 (P2) mice transplanted with 1000 (red) or 4000 (green) GFP+ P1 tumor cells versus 4000 GFP− P1 tumor cells. P values in A and B were calculated with Log-rank (Mantel-Cox) test. (C-F) Immunofluorescence (IF) images of (C) a spontaneous mouse GBM, (D) a primary GFP+ cell transplanted GBM, (E) a secondary GFP+ cell transplanted GBM, and (F) a tertiary GFP+ cell transplanted GBM. GFP+ cells are rare and remain Ki67− throughout the serial transplantations. Scale bar: 20μm.
Figure 3.
Figure 3.. Murine GBM cancer stem cell signature enrichment in unsupervised human GBM clusters.
(A) Principal component (PC) analysis of RNA sequencing from GFP+ CSC and GFP− cells sorted from seven spontaneous CGD-GBM illustrates segregation of two transcriptional cohorts. (B) Volcano plot summarizes differentially expressed genes (DEG) between GFP+ CSC and GFP− cells from seven tumors. Some DEG including CGD transgene and various stem cell related genes are highlighted. (C-F) tSNE projections of integrated 8 PDX dataset. (C) Individual PDX samples shown in different colors (T =PDX tumor) illustrate equivalent cell distribution for each tumor. (D) tSNE of unsupervised gene expression clustering depicts 6 clusters colored randomly. (E) Green colored cells surpass the AUCell threshold for enrichment of the murine CSC signature with all other cells in grey (see Methods). (F) Integrated tumor cells enriched for the mouse CSC signature (integrated GSSC; green), mitotic (P-M; red), S-phase (P-S; red) signatures, oligodendrocyte signature (cluster 1; blue), and neuron signature (cluster 5; purple). (G) Heatmaps of 8 PDX integrated dataset by clusters, showing enrichment of the mitotic (M; red) and S-phase (S; red) signatures (see Methods) in the proliferative clusters P. Rows indicate genes, columns indicate clusters, and the scale of the heatmaps are at the top right. The columns are arranged in a dendrogram according to clustering by similarity, indicating the two P clusters are distinct, proliferative groups. G is the integrated GSSC cluster. See also Figure S3.
Figure 4.
Figure 4.. Human PDX unsupervised cell clustering reveals pre-clustered cells enriched for the murine GFP+ CSC signature.
(A) Each triptych panel indicates one individual tumor. Within each panel on the left is the tSNE projection with randomly assigned colors to each cluster. The middle panel is colored by cell type designation (see Methods, green = GSSC, red = P, grey = others). Right panel is the same tSNE map highlighting in green the cells present within the integrated GSSC group of the integrated 8 PDX dataset for that specific tumor. (B) Violin plots for 8 individual PDX tumors depicting the AUCell enrichment scores for the murine CSC signature by cell clusters. The black horizontal bars indicate mean values. (green = GSSC, red = P, grey = others). See also Figure S4.
Figure 5.
Figure 5.. F3 mRNA and protein expression identify quiescent GBM PDX CSC.
(A-A11) Three representative, of eight examined, GBM PDX unsupervised cell cluster violin plots depicting elevated F3 receptor gene expression in GS designated cell clusters (top) and KI67 mRNA in the proliferative clusters (bottom). Horizontal black bars indicate mean values. (B-B11) Tumor sections from same three representative PDX, of sixteen total examined, illustrate F3 protein expression mutually exclusive from KI67+ cells in GBM PDX. DAPI staining shown in grey (right panels). White arrowheads indicate F3+ cells. White circles highlight proliferative KI67+ cells. Far right shows quantitation for F3+/KI67− (F+K−); F3−/KI67+ (F−K+); and F3+/KI67+ (F+K+) GBM cells. Mean ± SEM, n=6 sections, Scale bars: 40μm. (C) qRT-PCR measurements validate enrichment of 118-human GS signature genes F3, TIMP3, ID3, APOE, and EDNRB in F3+ sorted PDX cells (see also Fig. S5B–B1). n=2 technical replicates for each group. (D-G) Representative images and statistical analyses of (D-E) doublet formation assays for F3 sorted cells; and (F-G) sphere formation assays enhanced in F3+ fraction, while depleted for F3− cells. Red circles highlight doublets in D and spheres in F. Enlarged insets demonstrate spheres only in F3+ fraction. Doublets are shown when no spheres could be identified. **P<0.01, ****P<0.0001. Mean ± SEM, n = 5 technical replicates, Scale bars: 100μm. (H) Limiting dilution transplants with primary F3 antibody sorted PDX cells illustrates enhanced tumor formation in F3+ cell fraction. N/A: not available. (I) Survival curves of primary transplants with either 2000 or 4000 cells exhibit significantly worse outcomes with F3+ sorted GBM cell transplants as compared to F3− cells. (J) Survival curves show accelerated mortality for recipients of F3+ secondary transplants and no survival defect in recipients of F3− secondary transplants. (K) Representative magnetic resonance imaging (MRI) of whole mouse brains at day 97 post-secondary orthotopic transplantation in panel C depict no tumors in F3− secondary transplants while F3+ transplants uniformly exhibit large invasive tumors. Ratios in parenthesis indicate fraction of detected tumors. (L) Principal component analysis of bulk RNAseq data illustrates two cohorts of tumor cells formed by F3+ cancer stem cells and F3− GBM cells sorted from four and six PDX samples respectively. (M) Volcano plot summarizes DEG between F3+ and F3− cells. Examples of CSC DEG including F3 are highlighted. See also Figure S5.
Figure 6.
Figure 6.. The 118-GS signature is enriched in non-proliferative primary GBM unsupervised cell clusters.
(A) Seurat v.3 tSNE depiction of the single cell sequencing data from 20 adult GBM described in Neftel et al., 2019. Each individual tumor cell is represented by a distinct color emphasizing the equivalent distribution throughout the projection. (B) Unsupervised clustering of data in (A) results in segregation of GBM cells into seven distinct clusters that contain representation from each of the 20 GBM. Three wild-type cell clusters were not included. (C) The data in (A) and (B) probed with the conserved 118-GS signature enriches only in cluster 2. (D) tSNE illustration of quiescent (GS) and proliferative cell clusters (P) in (A-C). (E) Heatmaps of the same data with mitotic and S-phase signatures identify clusters 5, 7, & 8 as proliferative. Scales are located at the top left. (F) Pie chart depicts relative proportions of cells enriched for the 118-GS signature (GS, green), proliferative signatures (P, red), and others (grey) in the integrated 20 GBM. (G-H) Violin plots depicting elevated (G) F3 receptor gene expression in GS cell clusters and (H) KI67 mRNA in the proliferative clusters. Horizontal black bars indicate mean values.
Figure 7.
Figure 7.. Tumor cell dynamics following Temozolomide treatment.
(A-B) Representative IF images of (A) DMSO or (B) TMZ treated mouse brain sections indicate depletion of bulk tumor cells (DAPI) and increased cleaved caspase-3+ (white arrow heads). Scale bar: 40μm. (C-G) tSNE projections of integrated datasets from three tumor samples derived from same patient PDX: two PDX underwent TMZ treatment, and one was untreated. (C) tSNE projection illustrates superimposed individual PDX samples shown in different colors. (D) tSNE of unsupervised gene expression clustering depicts 8 independently colored cell clusters. (E) tSNE depicts in green the cells that surpass the AUCell threshold for enrichment for the 118-GS signature (clusters 0, 2, & 8) with all other cells in grey. Note novel cluster 8 enrichment (see Methods); (F) tSNE depicts in red the cells that surpass the AUCell threshold for enrichment for the S-phase signature (clusters 1 & 6) with all other cells in grey. Note novel cluster 8 enrichment; (G) tSNE depicts integrated tumor cells enriched for the 118-GS (green), mitotic and S-phase (red), Neuron (purple), and Oligodendrocyte (blue) signatures, together with a novel population (cluster 8) enriched for both signatures (orange, P-GS). (H) Table illustrates distribution of 3 GBM samples in each of the unsupervised clusters. Note that in TMZ-treated tumors, all GS and proliferative clusters are elevated (shaded green, orange, and red). The novel P-GS cell population increases >10-fold in TMZ treated samples (shaded orange). GS Sum is the sum of all clusters enriched for the 118-GS signature. P-GS 8 is cluster 8 that has enrichment of both GS and proliferative signatures. P Sum is the sum of all clusters enriched for proliferative signature. (I) Heatmap of 10 DEG for each cell cluster from the 3-sample integrated dataset showing enrichment of CSC genes in both Q-GS and P-GS clusters (white dashed square), and proliferative genes in P-GS, P-M, and P-S clusters (yellow dashed square, see Methods). Rows indicate genes, columns indicate cell clusters. Scale is located at the top right. Selected genes are indicated. See also Figure S7.

References

    1. Aibar S, Gonzalez-Blas CB, Moerman T, Huynh-Thu VA, Imrichova H, Hulselmans G, Rambow F, Marine JC, Geurts P, Aerts J, et al. (2017). SCENIC: single-cell regulatory network inference and clustering. Nat Methods 14, 1083–1086. - PMC - PubMed
    1. Alcantara Llaguno S., Chen J, Kwon CH, Jackson EL, Li Y, Burns DK, Alvarez-Buylla A, and Parada LF (2009). Malignant astrocytomas originate from neural stem/progenitor cells in a somatic tumor suppressor mouse model. Cancer Cell 15, 45–56. - PMC - PubMed
    1. Alcantara Llaguno S, Sun D, Pedraza AM, Vera E, Wang Z, Burns DK, and Parada LF (2019). Cell-of-origin susceptibility to glioblastoma formation declines with neural lineage restriction. Nat Neurosci 22, 545–555. - PMC - PubMed
    1. Alcantara Llaguno SR, Wang Z, Sun D, Chen J, Xu J, Kim E, Hatanpaa KJ, Raisanen JM, Burns DK, Johnson JE, and Parada LF (2015). Adult Lineage-Restricted CNS Progenitors Specify Distinct Glioblastoma Subtypes. Cancer Cell 28, 429–440. - PMC - PubMed
    1. Alvarez-Satta M, Moreno-Cugnon L, and Matheu A (2019). Primary cilium and brain aging: role in neural stem cells, neurodegenerative diseases and glioblastoma. Ageing Res Rev 52, 53–63. - PubMed

Publication types

MeSH terms