. 2022 Jan 11;18(1):3.
doi: 10.1186/s13223-022-00645-7.

Role of airway smooth muscle cell phenotypes in airway tone and obstruction in guinea pig asthma model

Affiliations

Role of airway smooth muscle cell phenotypes in airway tone and obstruction in guinea pig asthma model

Mayra D Álvarez-Santos et al. Allergy Asthma Clin Immunol. .

Abstract

Background: Airway obstruction (AO) in asthma is driven by airway smooth muscle (ASM) contraction. AO can be induced extrinsically by direct stimulation of ASM with contractile agonists as histamine, or by indirect provocation with antigens as ovalbumin, while the airway tone is dependent on intrinsic mechanisms. The association of the ASM phenotypes involved in different types of AO and airway tone in guinea pigs was evaluated.

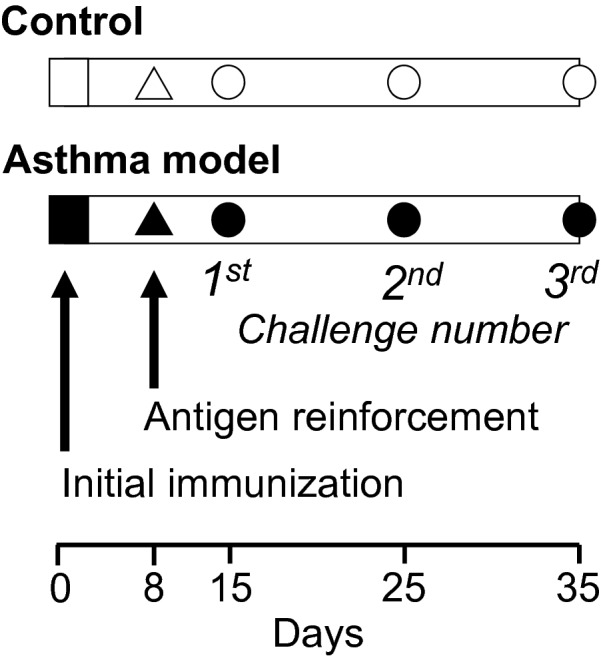
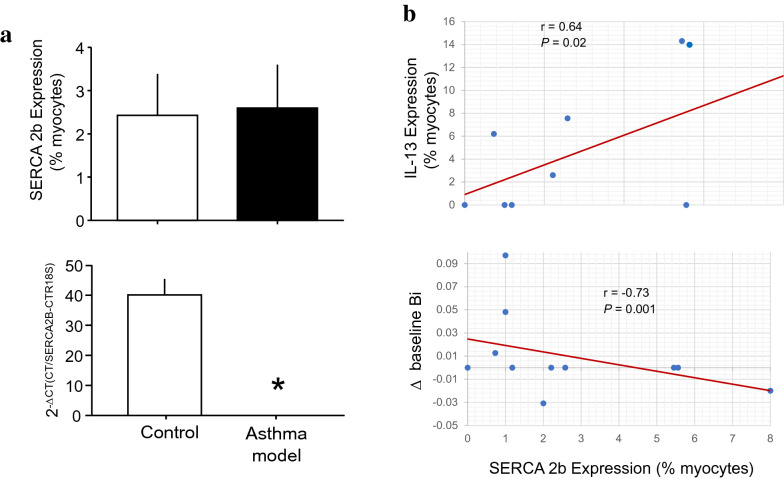
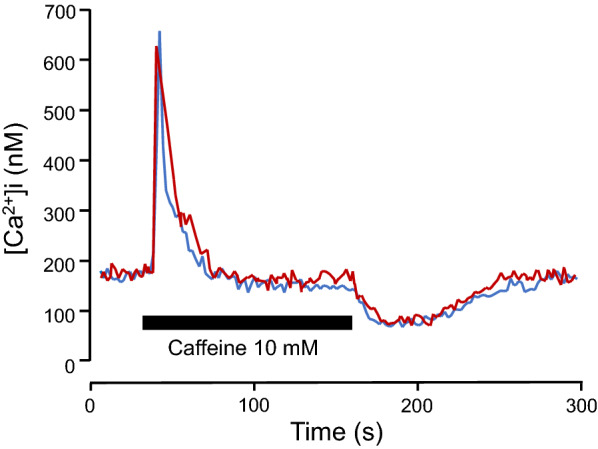
Methods: Guinea pigs were sensitized to ovalbumin and challenged with antigen. In each challenge, the maximum OA response to ovalbumin was determined, and before the challenges, the tone of the airways. At third challenge, airway responsiveness (AR) to histamine was evaluated and ASM cells from trachea were disaggregated to determinate: (a) by flow cytometry, the percentage of cells that express transforming growth factor-β1 (TGF-β1), interleukin-13 (IL-13) and sarco-endoplasmic Ca2+ ATPase-2b (SERCA2b), (b) by RT-PCR, the SERCA2B gene expression, (c) by ELISA, reduced glutathione (GSH) and, (d) Ca2+ sarcoplasmic reticulum refilling rate by microfluorometry. Control guinea pig group received saline instead ovalbumin.

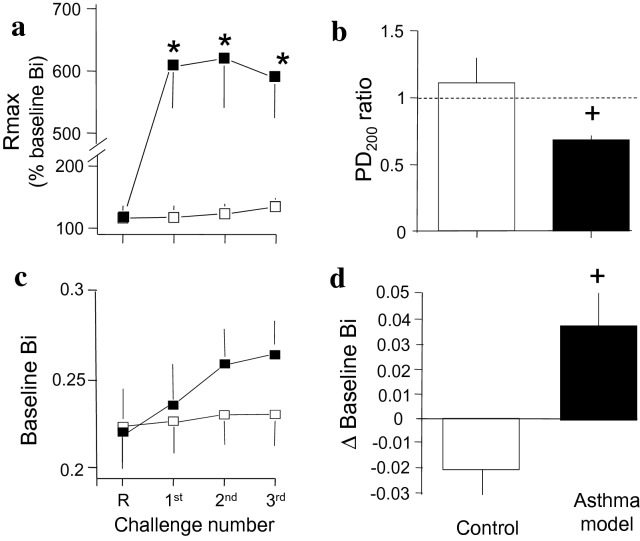
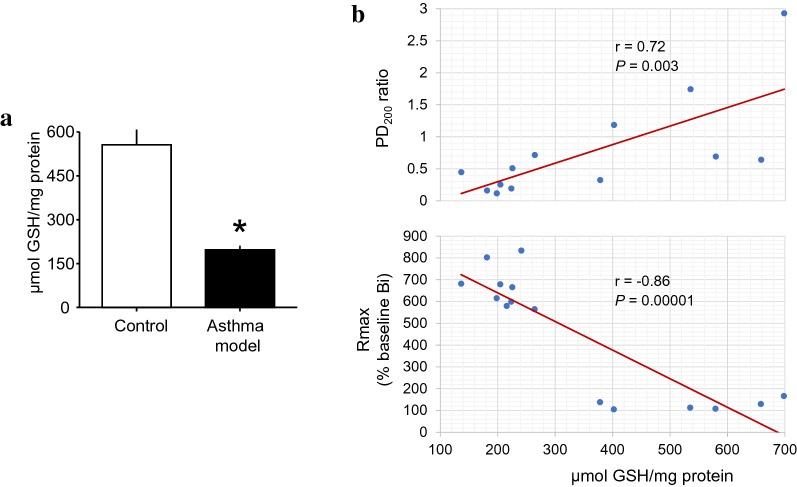
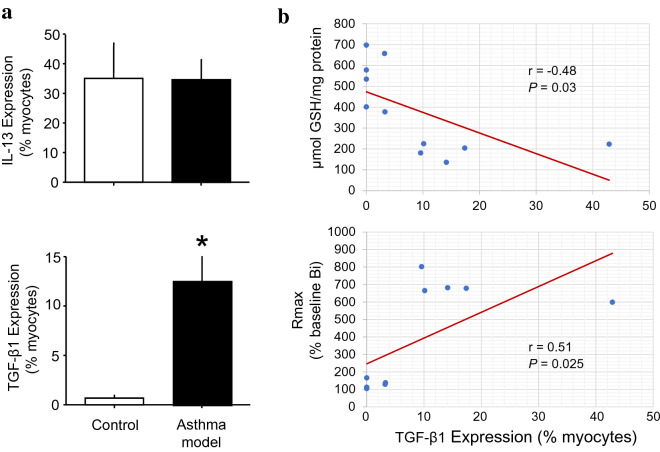
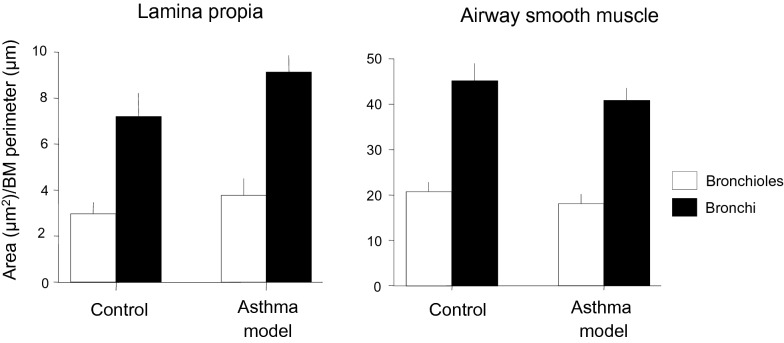
Results: Antigenic challenges in sensitized guinea pigs induced indirect AO, AR to histamine and increment in airway tone at third challenge. No relationship was observed between AO induced by antigen and AR to histamine with changes in airway tone. The extent of antigen-induced AO was associated with both, TGF-β1 expression in ASM and AR degree. The magnitude of AR and antigen-induced AO showed an inverse correlation with GSH levels in ASM. The airway tone showed an inverse association with SERCA2b expression.

Conclusions: Our data suggest that each type of AO and airway tone depends on different ASM phenotypes: direct and indirect AO seems to be sensitive to the level of oxidative stress; indirect obstruction induced by antigen appears to be influenced by the expression of TGF-β1 and the SERCA2b expression level plays a role in the airway tone.

Keywords: Airway obstruction; Airway responsiveness; Airway smooth muscle; Airway tone; GSH; SERCA; TGF-β1.


Conflict of interest statement

The authors declare that they have no competing interests.

Figures

Fig. 1
Fig. 1
Experimental design. Guinea pigs were sensitized by intraperitoneal (0.5 mg/ml) and subdermal (0.5 mg/ml) injections with a combination of ovalbumin (60 μg/ml) and 1 mg/ml aluminium hydroxide dispersed in physiological saline solution (black squares). Eight days later, the sensitization was reinforced with ovalbumin aerosol administration for 5 min (3 mg/ml; black triangle). From day 15 onward, guinea pigs were challenged for one minute with ovalbumin aerosol every 10 days; 1 mg/ml was used for the first challenge, and 0.5 mg/ml was used for the subsequent challenges (black circles). At the third challenge, dose–response curves in response to histamine were generated, and tissue acquisition was performed. The animals in the control group (open figures) received physiological saline solution instead of ovalbumin
Fig. 2
Fig. 2
Antigen-induced changes in lung function in guinea pigs. a Average maximum (Rmax) bronchoobstructive index (Bi) induced by indirect (ovalbumin antigen) provocation. b The PD200 ratio resulting from direct (histamine) provocation was determined according to the PD200 value observed after antigen challenge divided by the PD200 value determined before challenge. c The average intrinsic baseline Bi obtained before indirect and direct provocation. d Difference in the baseline Bi (Δ baseline Bi) obtained after reinforcement (R) and the last challenge with saline (white bar, control) or antigen (black bar, asthma model). Values correspond to challenge with saline (white square) and antigen (black squares) in guinea pigs. *P < 0.05 compared with the control according to repeated measures ANOVA followed by Dunnett’s test. +P < 0.05 compared with the control (unpaired Student’s t-test). The dotted line in B shows the border between hypo- and hyperresponsiveness
Fig. 3
Fig. 3
GSH changes in isolated airway smooth muscle cells from a guinea pig asthma model. a Levels of GSH in isolated myocytes. Scatter graphs showing that GSH levels were correlated (b) directly with changes in the PD200 ratio (upper panel) and inversely with Rmax values (lower panel). *P = 0.0064 compared with the control (unpaired Student’s t-test). r = Spearman correlation coefficient; P = paired Student’s t-test
Fig. 4
Fig. 4
Number of isolated airway myocytes that expressed IL-13 and TGF-β1 measured by flow cytometry. a Bars represent the mean + SEM. b Scatter graphs showing that the number of isolated airway myocytes that expressed TGF-β1 was correlated inversely with GSH levels in myocytes (upper panel) and directly with Rmax (lower panel). *P < 0.05 compared with the control (unpaired Student’s t-test). r = Spearman correlation coefficient; P = paired Student’s t-test
Fig. 5
Fig. 5
Airway wall areas. Data were adjusted according to the length of the corresponding basement membrane (BM). Bars represent the mean ± SEM
Fig. 6
Fig. 6
SERCA2b expression in asthma model guinea pigs. a Number of isolated airway myocytes that expressed SERCA2b determined by flow cytometry (upper panel). SERCA2B gene expression measured by RT-PCR (lower panel). Scatter graphs showing that the number of myocytes that expressed SERCA2b was correlated (b, upper panel) directly with the number of myocytes that expressed IL-13 and (b, lower panel) inversely with the changes (Δ) in the baseline bronchoobstructive index (Bi). *P = 0.00001 compared with the control (unpaired Student’s t-test). r = Spearman correlation coefficient; P = paired Student’s t-test
Fig. 7
Fig. 7
Representative recording showing the changes in intracellular Ca2+ levels ([Ca2+]i) induced by caffeine (10 mM) in myocytes isolated from control (red) and asthma model guinea pigs (blue). The withdrawal of caffeine induced a Ca2+ undershoot

Similar articles

Cited by

References

    1. An SS, Bai TR, Bates JH, et al. Airway smooth muscle dynamics: a common pathway of airway obstruction in asthma. Eur Respir J. 2007;29:834–860. doi: 10.1183/09031936.00112606. - DOI - PMC - PubMed
    1. Ellis JL, Undem BJ. Role of cysteinyl-leukotrienes and histamine in mediating intrinsic tone in isolated human bronchi. Am J Respir Crit Care Med. 1994;149:118–122. doi: 10.1164/ajrccm.149.1.8111568. - DOI - PubMed
    1. Bergner A, Kellner J, Kemp da Silva A, Fischer R, Gamarra F, Huber RM. Bronchial hyperreactivity is correlated with increased baseline airway tone. Eur J Med Res. 2006;11:77–84. - PubMed
    1. Lee-Gosselin A, Gendron D, Blanchet MR, et al. The gain of smooth muscle’s contractile capacity induced by tone on in vivo airway responsiveness in mice. J Appl Physiol. 2015;118:692–698. doi: 10.1152/japplphysiol.00645.2014. - DOI - PMC - PubMed
    1. Molfino NA, Slutsky AS, Julià-Serdà G, et al. Assessment of airway tone in asthma: comparison between double lung transplant patients and healthy subjects. Am Rev Respir Dis. 2012;148:1238–1243. doi: 10.1164/ajrccm/148.5.1238. - DOI - PubMed