

Contribution of 3D genome topological domains to genetic risk of cancers: a genome-wide computational study
- PMID: 35016721
- PMCID: PMC8753905
- DOI: 10.1186/s40246-022-00375-2
Contribution of 3D genome topological domains to genetic risk of cancers: a genome-wide computational study
Abstract
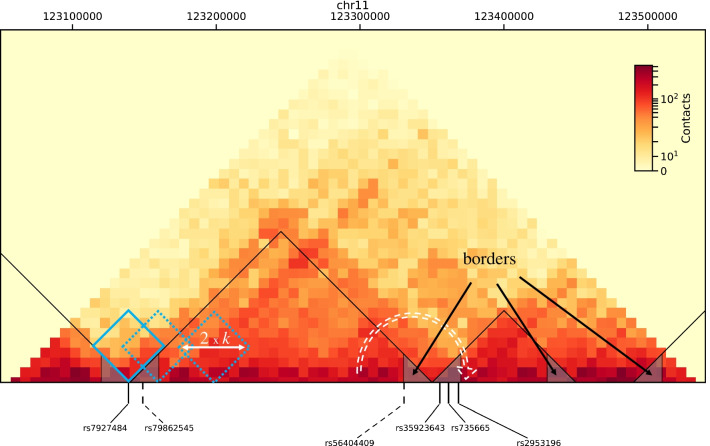
Background: Genome-wide association studies have identified statistical associations between various diseases, including cancers, and a large number of single-nucleotide polymorphisms (SNPs). However, they provide no direct explanation of the mechanisms underlying the association. Based on the recent discovery that changes in three-dimensional genome organization may have functional consequences on gene regulation favoring diseases, we investigated systematically the genome-wide distribution of disease-associated SNPs with respect to a specific feature of 3D genome organization: topologically associating domains (TADs) and their borders.
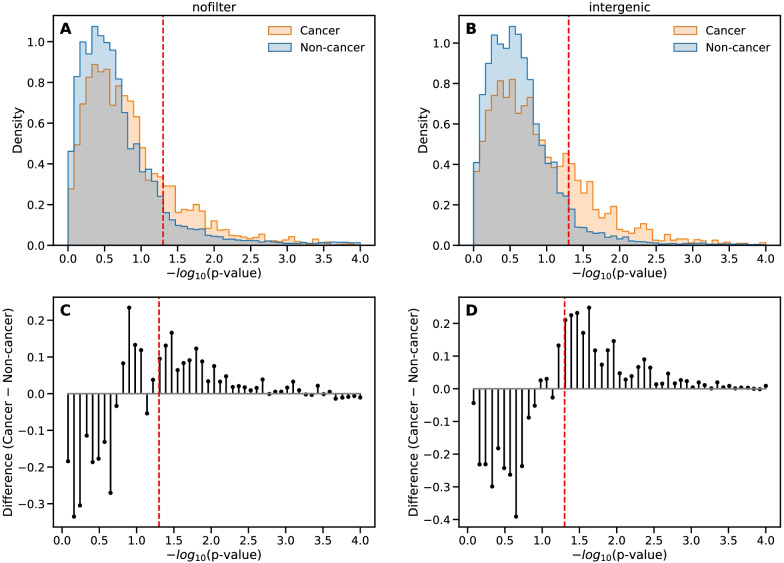
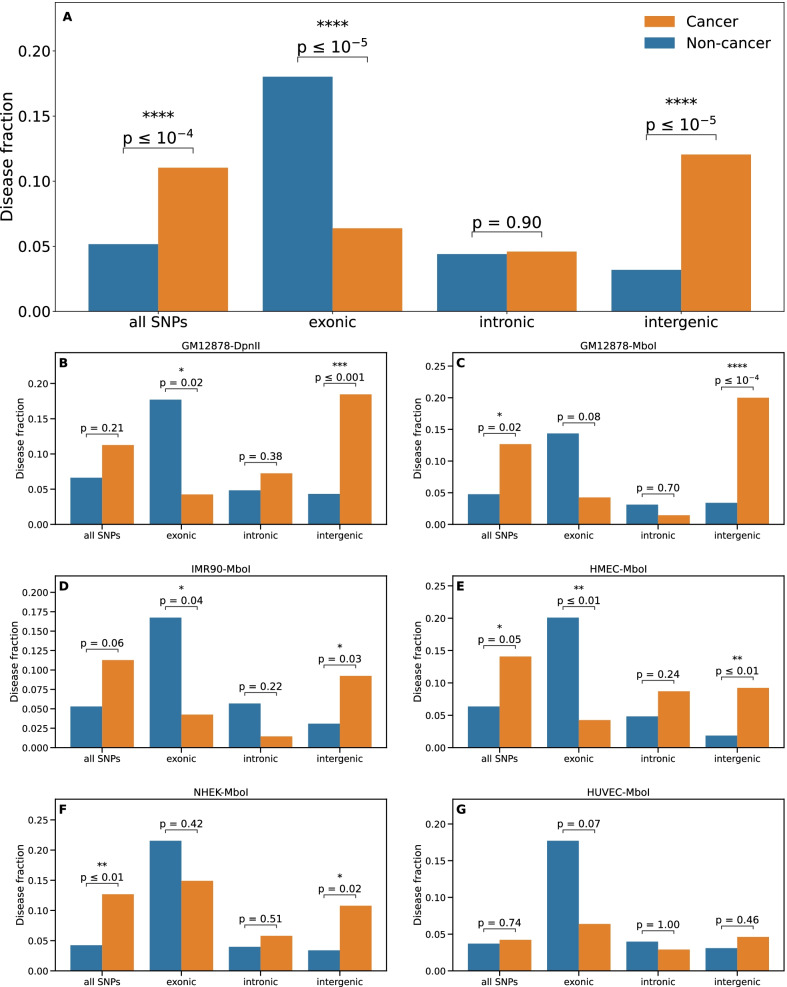
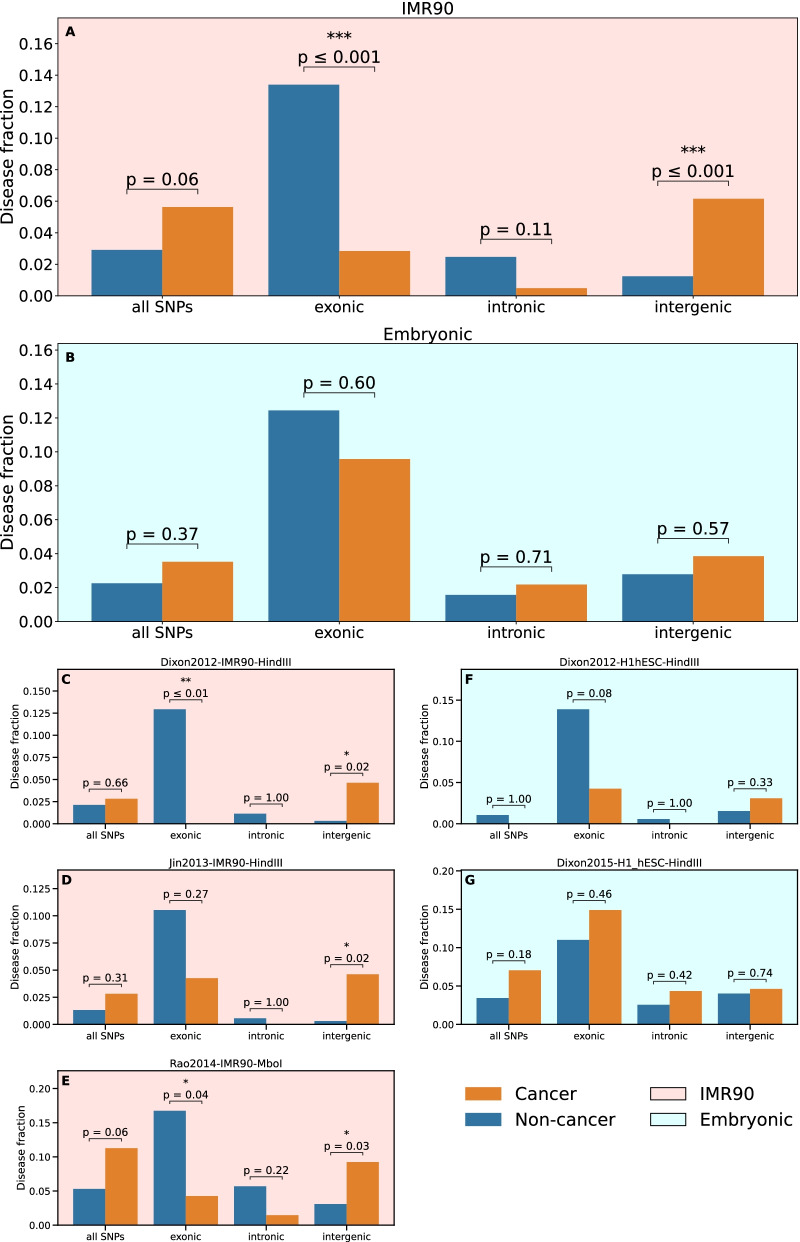
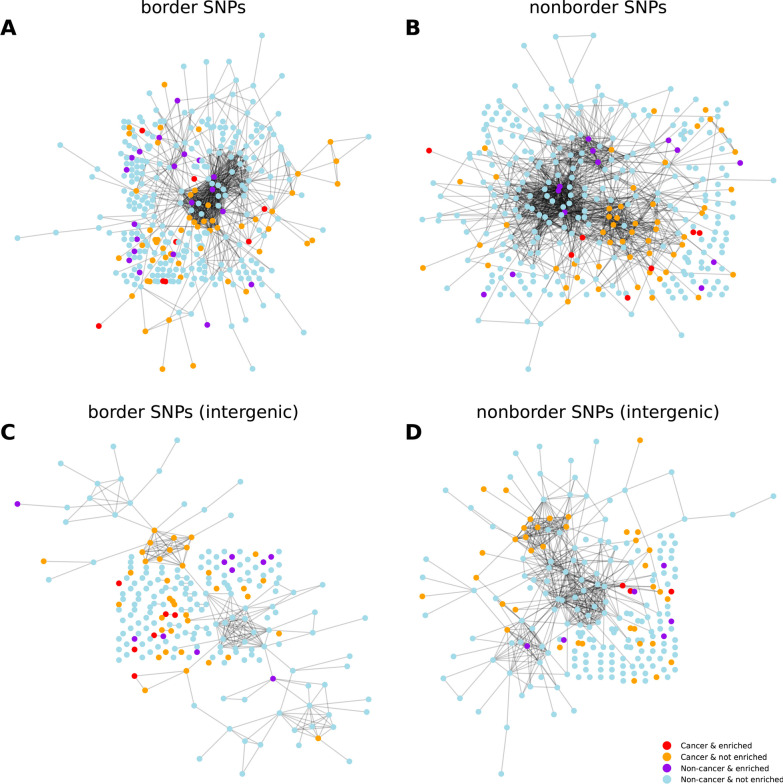
Results: For each of 449 diseases, we tested whether the associated SNPs are present in TAD borders more often than observed by chance, where chance (i.e., the null model in statistical terms) corresponds to the same number of pointwise loci drawn at random either in the entire genome, or in the entire set of disease-associated SNPs listed in the GWAS catalog. Our analysis shows that a fraction of diseases displays such a preferential localization of their risk loci. Moreover, cancers are relatively more frequent among these diseases, and this predominance is generally enhanced when considering only intergenic SNPs. The structure of SNP-based diseasome networks confirms that localization of risk loci in TAD borders differs between cancers and non-cancer diseases. Furthermore, different TAD border enrichments are observed in embryonic stem cells and differentiated cells, consistent with changes in topological domains along embryogenesis and delineating their contribution to disease risk.
Conclusions: Our results suggest that, for certain diseases, part of the genetic risk lies in a local genetic variation affecting the genome partitioning in topologically insulated domains. Investigating this possible contribution to genetic risk is particularly relevant in cancers. This study thus opens a way of interpreting genome-wide association studies, by distinguishing two types of disease-associated SNPs: one with an effect on an individual gene, the other acting in interplay with 3D genome organization.
© 2022. The Author(s).
Conflict of interest statement
The authors declare that they have no competing interests.
Figures
Similar articles
-
Exploring the effects of genetic variation on gene regulation in cancer in the context of 3D genome structure.BMC Genom Data. 2022 Feb 17;23(1):13. doi: 10.1186/s12863-021-01021-x. BMC Genom Data. 2022. PMID: 35176995 Free PMC article.
-
Prioritizing long range interactions in noncoding regions using GWAS and deletions perturbed TADs.Comput Struct Biotechnol J. 2020 Oct 21;18:2945-2952. doi: 10.1016/j.csbj.2020.10.014. eCollection 2020. Comput Struct Biotechnol J. 2020. PMID: 33209206 Free PMC article.
-
Genome-wide association data classification and SNPs selection using two-stage quality-based Random Forests.BMC Genomics. 2015;16 Suppl 2(Suppl 2):S5. doi: 10.1186/1471-2164-16-S2-S5. Epub 2015 Jan 21. BMC Genomics. 2015. PMID: 25708662 Free PMC article.
-
Shared genetic etiology underlying Alzheimer's disease and type 2 diabetes.Mol Aspects Med. 2015 Jun-Oct;43-44:66-76. doi: 10.1016/j.mam.2015.06.006. Epub 2015 Jun 23. Mol Aspects Med. 2015. PMID: 26116273 Free PMC article. Review.
-
Strategies for activity analysis of single nucleotide polymorphisms associated with human diseases.Clin Genet. 2023 Apr;103(4):392-400. doi: 10.1111/cge.14282. Epub 2022 Dec 25. Clin Genet. 2023. PMID: 36527336 Review.
Cited by
-
Epigenetics Role in Spermatozoa Function: Implications in Health and Evolution-An Overview.Life (Basel). 2023 Jan 29;13(2):364. doi: 10.3390/life13020364. Life (Basel). 2023. PMID: 36836724 Free PMC article. Review.
-
CTCF: A misguided jack-of-all-trades in cancer cells.Comput Struct Biotechnol J. 2022 May 27;20:2685-2698. doi: 10.1016/j.csbj.2022.05.044. eCollection 2022. Comput Struct Biotechnol J. 2022. PMID: 35685367 Free PMC article. Review.
-
Network location and clustering of genetic mutations determine chronicity in a stylized model of genetic diseases.Sci Rep. 2022 Nov 19;12(1):19906. doi: 10.1038/s41598-022-23775-9. Sci Rep. 2022. PMID: 36402799 Free PMC article.
-
Hidden secrets of the cancer genome: unlocking the impact of non-coding mutations in gene regulatory elements.Cell Mol Life Sci. 2024 Jun 20;81(1):274. doi: 10.1007/s00018-024-05314-z. Cell Mol Life Sci. 2024. PMID: 38902506 Free PMC article. Review.
-
3D genome alterations in T cells associated with disease activity of systemic lupus erythematosus.Ann Rheum Dis. 2023 Feb;82(2):226-234. doi: 10.1136/ard-2022-222653. Epub 2022 Sep 1. Ann Rheum Dis. 2023. PMID: 36690410 Free PMC article.
References
Publication types
MeSH terms
LinkOut - more resources
Full Text Sources
Medical
