. 2022 Jan 11;14(1):7.
doi: 10.1186/s13148-022-01228-4.

HDAC8 suppresses the epithelial phenotype and promotes EMT in chemotherapy-treated basal-like breast cancer

Affiliations

HDAC8 suppresses the epithelial phenotype and promotes EMT in chemotherapy-treated basal-like breast cancer

Garyfallia Pantelaiou-Prokaki et al. Clin Epigenetics. .

Abstract

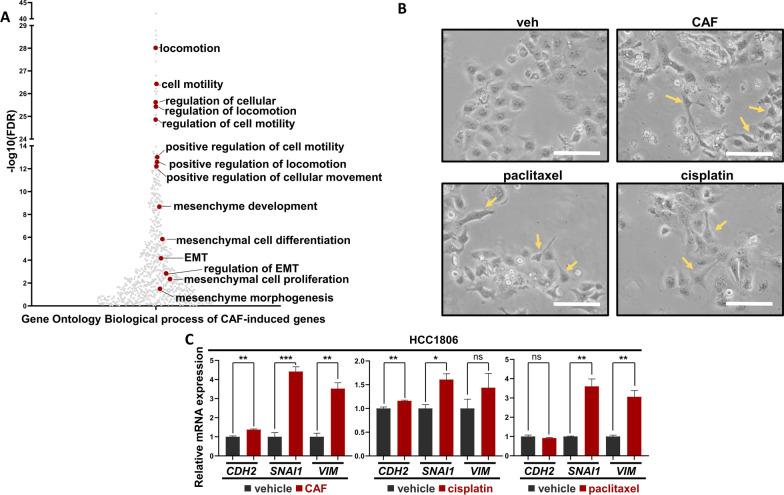
Background: Basal-like breast cancer (BLBC) is one of the most aggressive malignant diseases in women with an increased metastatic behavior and poor prognosis compared to other molecular subtypes of breast cancer. Resistance to chemotherapy is the main cause of treatment failure in BLBC. Therefore, novel therapeutic strategies counteracting the gain of aggressiveness underlying therapy resistance are urgently needed. The epithelial-to-mesenchymal transition (EMT) has been established as one central process stimulating cancer cell migratory capacity but also acquisition of chemotherapy-resistant properties. In this study, we aimed to uncover epigenetic factors involved in the EMT-transcriptional program occurring in BLBC cells surviving conventional chemotherapy.

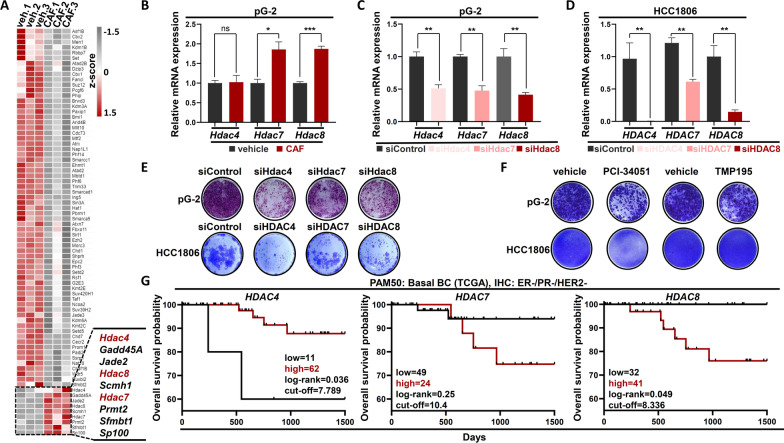
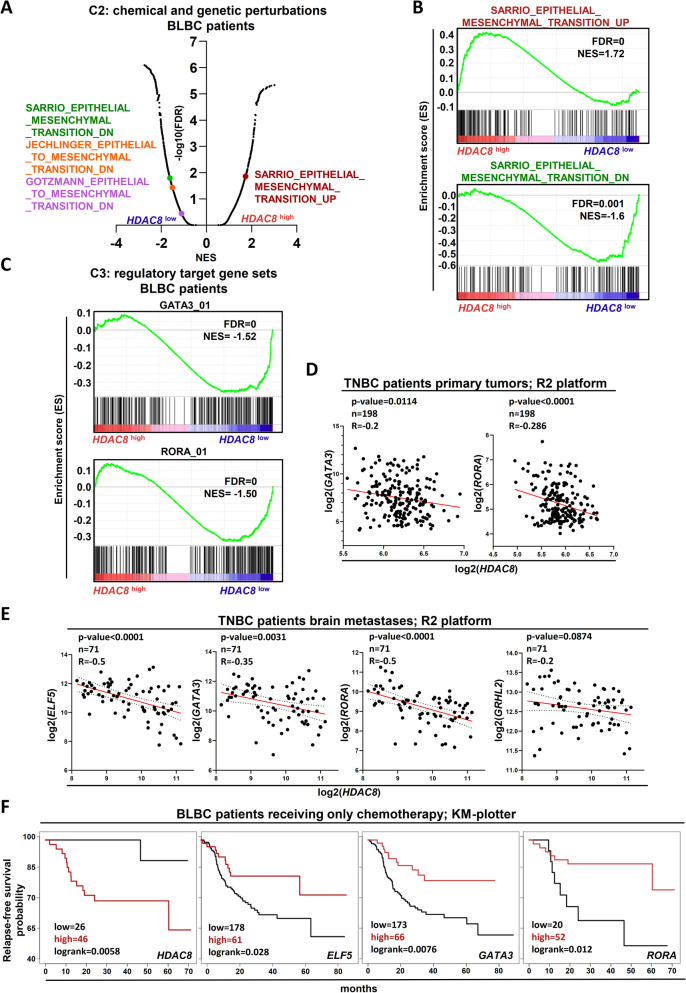
Results: Using whole transcriptome data from a murine mammary carcinoma cell line (pG-2), we identified upregulation of Hdac4, 7 and 8 in tumor cells surviving conventional chemotherapy. Subsequent analyses of human BLBC patient datasets and cell lines established HDAC8 as the most promising factor sustaining tumor cell viability. ChIP-sequencing data analysis identified a pronounced loss of H3K27ac at regulatory regions of master transcription factors (TFs) of epithelial phenotype like Gata3, Elf5, Rora and Grhl2 upon chemotherapy. Interestingly, impairment of HDAC8 activity reverted epithelial-TFs levels. Furthermore, loss of HDAC8 activity sensitized tumor cells to chemotherapeutic treatments, even at low doses.

Conclusion: The current study reveals a previously unknown transcriptional repressive function of HDAC8 exerted on a panel of transcription factors involved in the maintenance of epithelial cell phenotype, thereby supporting BLBC cell survival to conventional chemotherapy. Our data establish HDAC8 as an attractive therapeutically targetable epigenetic factor to increase the efficiency of chemotherapeutics.

Keywords: BLBC; Chemotherapy; EMT; Epigenetics; Epithelial transcription factors; H3K27ac; HDAC8; MET; TNBC.


Conflict of interest statement

The authors declare that they have no competing interests.

Figures

Fig. 1
Fig. 1
Chemotherapy induces EMT in murine and human BLBC cells. A Scatter plot showing EMT signatures, using the online pathway enrichment analysis tool gProfiler, on pG-2 cells upon CAF treatment for 48 h. B Brightfield pictures of HCC1806 cells showing a mesenchymal phenotype upon different chemotherapies (CAF, cisplatin and paclitaxel) for 48 h. The yellow arrows indicate cells with pronounced mesenchymal morphology. White scale bars = 50 µm, C Quantitative real-time PCR (qRT-PCR) on EMT-related genes in vehicle- and CAF-, cisplatin- or paclitaxel-treated (for 48 h) HCC1806 cells. All experiments were performed in biological triplicate. ns = not significant, *p-val < 0.05, **p-val < 0.01, ***p-val < 0.005. C Student's t test. Error bars are standard error of the mean (SEM)
Fig. 2
Fig. 2
HDAC4, HDAC7 and HDAC8 are upregulated in CAF-treated pG-2 and in CAF-resistant clones. A Heatmap of differentially regulated epigenetic factors in pG-2 cells upon CAF treatment (48 h) (basemean ≥ 15, p-adj < 0.05, log2FC ≥|0.7|). B qRT-PCR of Hdac4, Hdac7, Hdac8 in vehicle- and CAF-treated (48 h) pG-2 cells. C, D qRT-PCR validating the efficiency of HDAC4, HDAC7 and HDAC8 knockdowns in pG-2 (C) and HCC1806 (D), respectively. E Proliferation assay of pG-2 and HCC1806 cells upon HDAC4, HDAC7 and HDAC8 silencing, assessed by crystal violet staining. F Proliferation assay of pG-2 and HCC1806 cells upon HDAC8 inhibition (5 μM and 20 μM PCI34051, respectively) or HDAC4/HDAC7 inhibition (4 μM and 2 μM TMP195, respectively), assessed by crystal violet staining. G Kaplan–Meier plots showing the overall survival probability of HDAC4-, HDAC7- and HDAC8-expressing BLBC patients (expression and survival data are from the TCGA-BRCA database). All experiments were performed in triplicate. ns = not significant, *p-val < 0.05, ***p-val < 0.005. Statistical test: B Student's t test, error bars: standard error of the mean (SEM); G Log-rank test
Fig. 3
Fig. 3
HDAC8 supports the induction of EMT by suppressing key-MET TFs in BLBC cells surviving cytotoxic therapy. A Assessment of Vim, Wnt5a, Cdh2, Zeb1 mRNA expression levels by qRT-PCR in vehicle- or CAF-treated (48 h) pG-2 cells, with or without Hdac8 silencing. B GSEA profile showing an enrichment of the "HOLLERN_EMT_BREAST_TUMOR_DN" signature (MSigDB: C2 curated gene sets) in pG-2 cells at basal state (veh) compared to CAF-treated. NES: Normalized Enrichment Score. C Aggregate profile showing changes of H3K27ac at TSS regions of strongly downregulated genes in vehicle- and CAF-treated pG-2 cells (normalized counts basemean ≥ 15, p-adj < 0.05, log2FC ≤ -− 1.5). D Differential binding analysis (DiffBind) depicting changes of H3K27ac occupancy between vehicle- and 48 h CAF-treated pG-2 cells. Genomic regions showing significant changes of H3K27ac occupancy at EMT- or MET-associated genes (MSigDB C2, see method section) were labeled with light red and dark red dots, respectively. E Venn diagram showing genes simultaneously downregulated (normalized counts basemean > 15, p-adj < 0.05, log2FC < − 1.5) and loosing H3K27ac at TSS regions (Diffbind parameters: conc > 3, p-adj < 0.05, FC < -0.5) upon CAF treatment in pG-2 cells. F Pathway enrichment analysis showing that genes with loss of expression and H3K27ac enrich for MET- and cell differentiation-associated signatures (labeled in red). Analysis performed with the online tool. G qRT-PCR and ChIP-RT-PCR of epithelial-specific markers (Cldn8, Cldn3) in vehicle- and CAF-treated pG-2 cells. H Venn diagram showing 10 transcription factors (TFs) with simultaneous gene expression (normalized counts basemean > 15, p-adj < 0.05, log2FC < -− 0.7) and H3K27ac occupancy loss (Diffbind parameters: conc > 3, p-adj < 0.05, FC < − 0.5) upon CAF treatment in pG-2 cells. The murine transcription factor list was retrieved from the Animal TFDB3.0 TF database. I qRT-PCR assessing changes of MET-TFs Elf5, Gata3, Rora, Grhl2 upon pG-2 CAF treatment for 48 h, w/ or w/o Hdac8 silencing. Statistical test: A, I one-way ANOVA, G Student's t test. *p-val < 0.05, **p-val < 0.01, ***p-val < 0.005. Error bars are standard error of the mean (SEM)
Fig. 4
Fig. 4
High HDAC8 expression correlates with repression of the epithelial differentiation program in BLBC patients. A Plot depicting all C2 curated gene sets (MSigDB) enriched in GSEA analyses of HDAC8high- and HDAC8low-expressing BLBC patients. B Representative gene set enrichment profiles of the EMT and MET transcription programs in HDAC8low- and HDAC8high-BLBC patients. NES: Normalized Enrichment Score. C Gene set enrichment profiles of the MET-TFs GATA3 and RORA whose gene targets are particularly expressed in HDAC8low-BLBC patients. D–E Scatter plot showing the anti-correlation of the MET-TFs with HDAC8 in primary tumors (D) and brain metastases (E) of TNBC patients. Data were retrieved from the R2 platform. F Kaplan–Meier plots showing the relapse-free survival probability of HDAC8-, ELF5-, GATA3- and RORA-expressing BLBC patients receiving only chemotherapy as a treatment option (Log-rank test). Data were retrieved from the KM plotter. A–C Source of patient gene expression data: TCGA. Source of gene set enrichment profiles: MSigDB
Fig. 5
Fig. 5
HDAC8 silencing or inhibition sensitizes BLBC cells to chemotherapy treatment. A ROC analysis from publically available TNBC data demonstrating that patients with poor response to chemotherapy harbor high expression levels of HDAC8. Box plots: Mann–Whitney test. B, C Proliferation assay of CAF-treated pG-2 (B) and rG-2 (C) cells upon Hdac8 silencing. Representative crystal violet pictures are at the right panel of the bar charts. D Proliferation assay of pG-2 treated with low CAF doses (156.25 ng/ml cyclophosphamide, 7.8 ng/ml doxorubicin, 156.25 ng/ml 5-FU) for 48 h, w/ or w/o HDAC8 inhibition (5 μM PCI34051). E rG-2 cells treated with CAF for 48 h, w/ or w/o HDAC8 (5 μM PCI34051). Representative crystal violet pictures are at the left and right panel of proliferation kinetic graphs for pG-2 and rG-2, respectively. F Proliferation assay of HCC1806 treated with low CAF doses (156.25 ng/ml cyclophosphamide, 7.8 ng/ml doxorubicin, 156.25 ng/ml 5-FU) for 48 h, w/ or w/o HDAC8 inhibition (10 μM PCI34051). All experiments were performed in biological triplicates. ns = no difference, *p-val < 0.05, ***p-val < 0.005, ****p-val < 0.001. Statistical test: Student's t test. Error bars are standard error of the mean (SEM)

Similar articles

Cited by

References

    1. Harbeck N, Penault-Llorca F, Cortes J, Gnant M, Houssami N, Poortmans P, et al. Breast cancer. Nat Rev Dis Prim. 2019;5:66. - PubMed
    1. Nunnery SE, Mayer IA, Balko JM. Triple-negative breast cancer: breast tumors with an identity crisis. Cancer J. 2021;27:2–7. - PMC - PubMed
    1. Borri F, Granaglia A. Pathology of triple negative breast cancer. Semin Cancer Biol. 2021;72:136–145. - PubMed
    1. Garutti M, Pelizzari G, Bartoletti M, Malfatti MC, Gerratana L, Tell G, et al. Platinum salts in patients with breast cancer: a focus on predictive factors. Int J Mol Sci. 2019;20:3390. - PMC - PubMed
    1. Abaurrea A, Araujo AM, Caffarel MM. The role of the il-6 cytokine family in epithelial–mesenchymal plasticity in cancer progression. Int J Mol Sci. 2021;22:8334. - PMC - PubMed

Publication types

MeSH terms