. 2022;13(4):1095-1120.
doi: 10.1016/j.jcmgh.2022.01.002. Epub 2022 Jan 10.

Macrophage COX2 Mediates Efferocytosis, Resolution Reprogramming, and Intestinal Epithelial Repair

Affiliations

Macrophage COX2 Mediates Efferocytosis, Resolution Reprogramming, and Intestinal Epithelial Repair

David Meriwether et al. Cell Mol Gastroenterol Hepatol. 2022.

Abstract

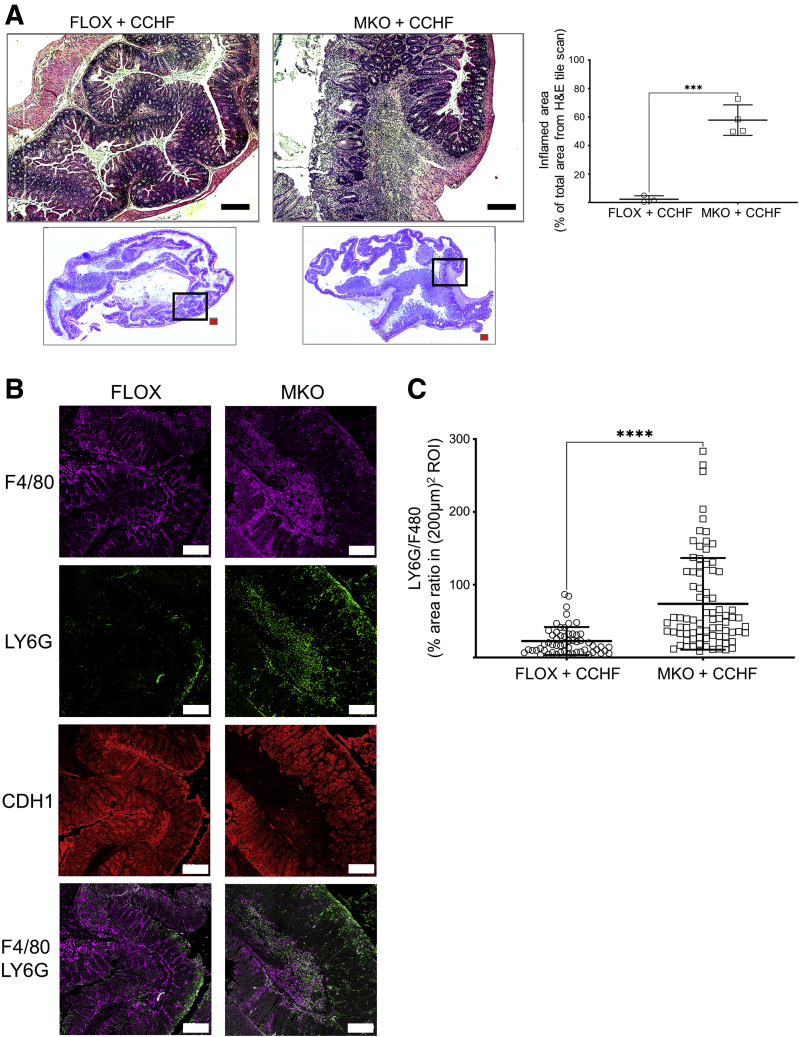
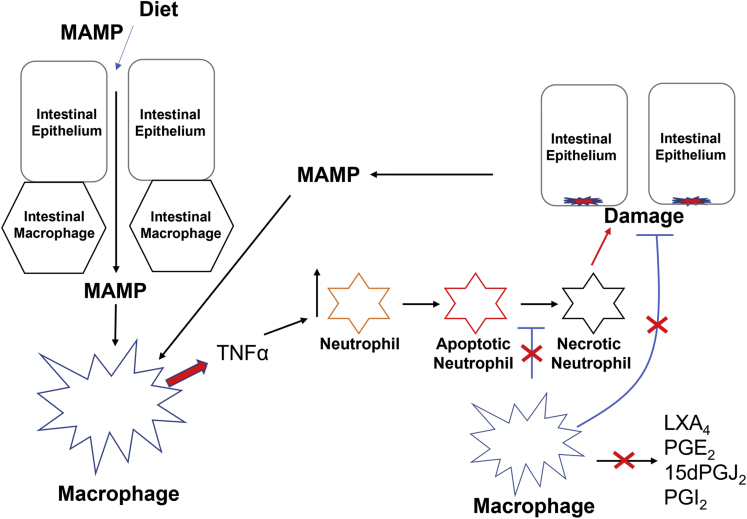
Background and aims: Phagocytosis (efferocytosis) of apoptotic neutrophils by macrophages anchors the resolution of intestinal inflammation. Efferocytosis prevents secondary necrosis and inhibits further inflammation, and also reprograms macrophages to facilitate tissue repair and promote resolution function. Macrophage efferocytosis and efferocytosis-dependent reprogramming are implicated in the pathogenesis of inflammatory bowel disease. We previously reported that absence of macrophage cyclooxygenase 2 (COX2) exacerbates inflammatory bowel disease-like intestinal inflammation. To elucidate the underlying pathogenic mechanism, we investigated here whether COX2 mediates macrophage efferocytosis and efferocytosis-dependent reprogramming, including intestinal epithelial repair capacity.

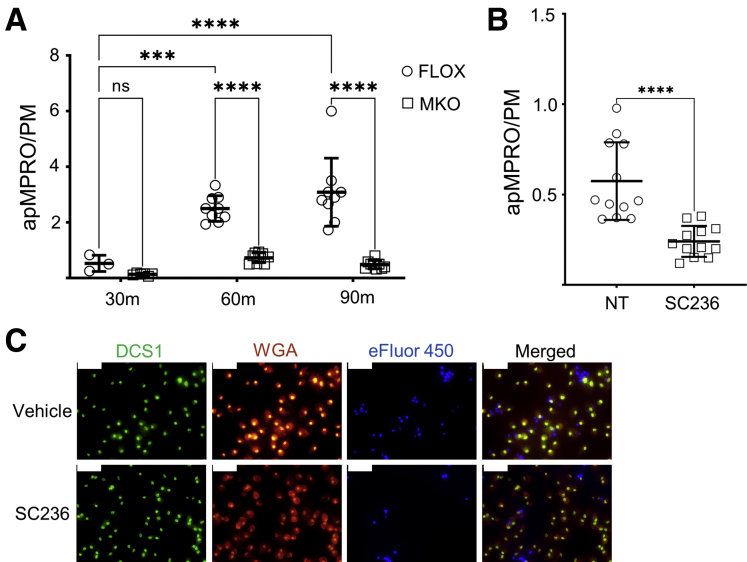
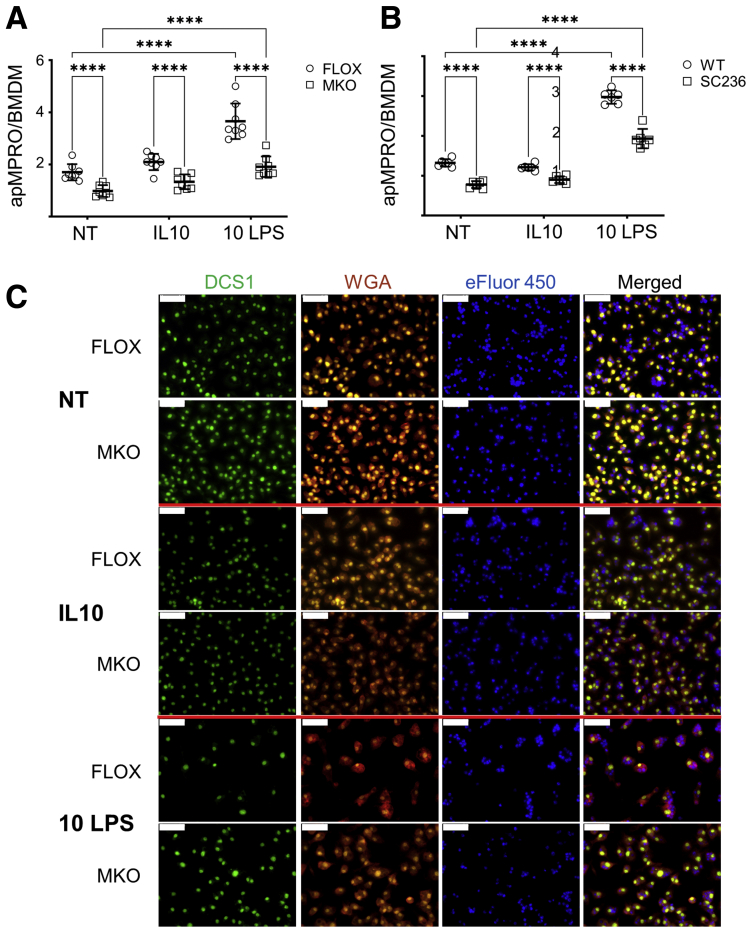
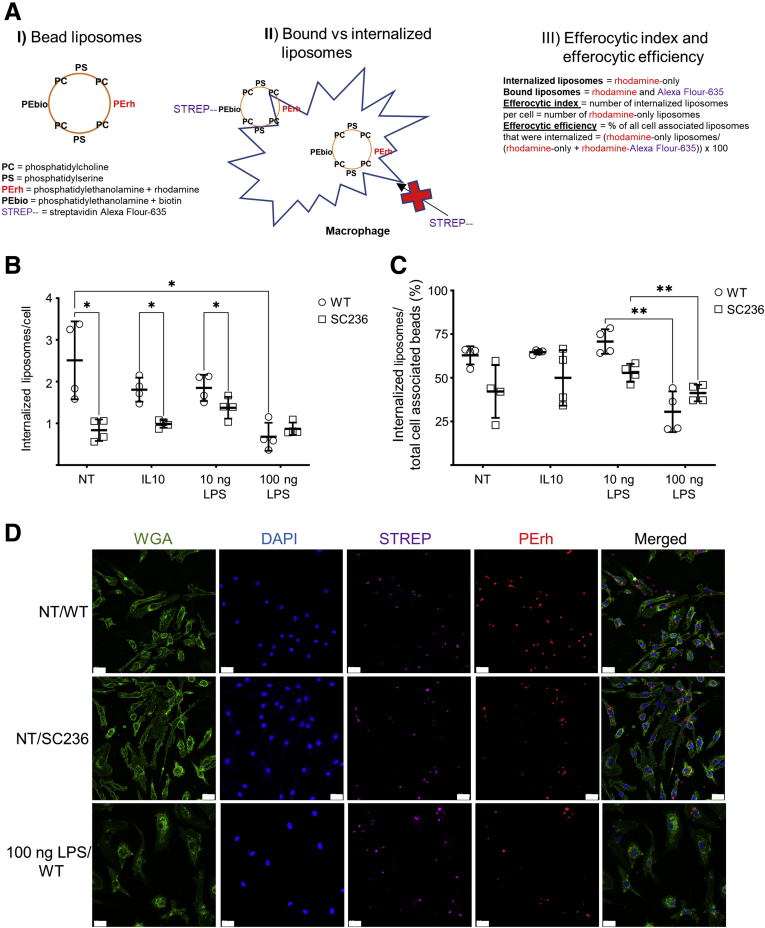
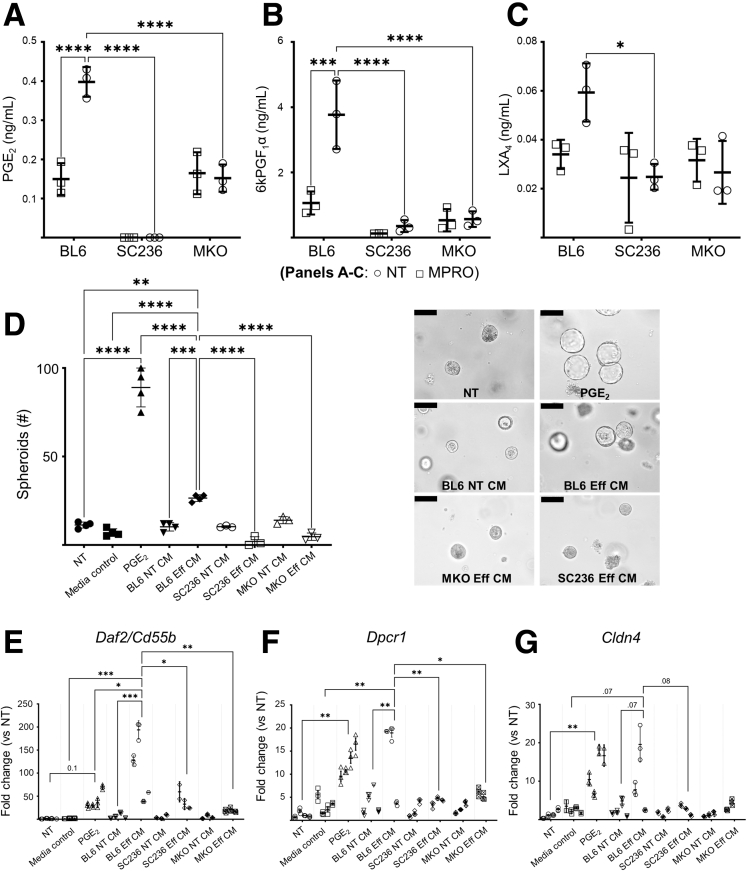
Methods: Using apoptotic neutrophils and synthetic apoptotic targets, we determined the effects of macrophage specific Cox2 knockout and pharmacological COX2 inhibition on the efferocytosis capacity of mouse primary macrophages. COX2-mediated efferocytosis-dependent eicosanoid lipidomics was determined by liquid chromatography tandem mass spectrometry. Small intestinal epithelial organoids were employed to assay the effects of COX2 on efferocytosis-dependent intestinal epithelial repair.

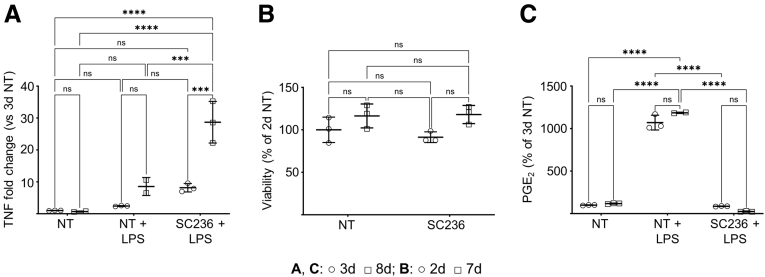
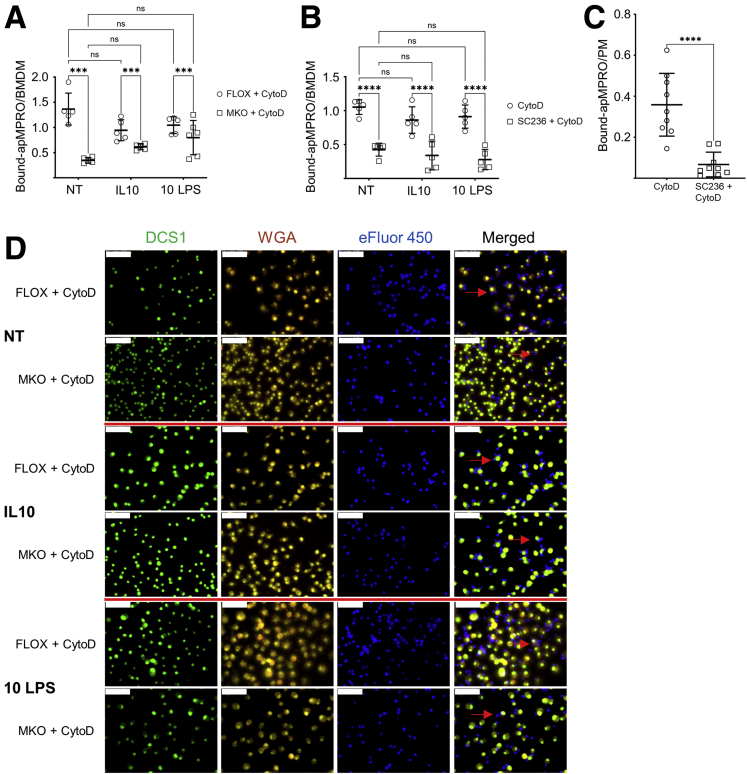
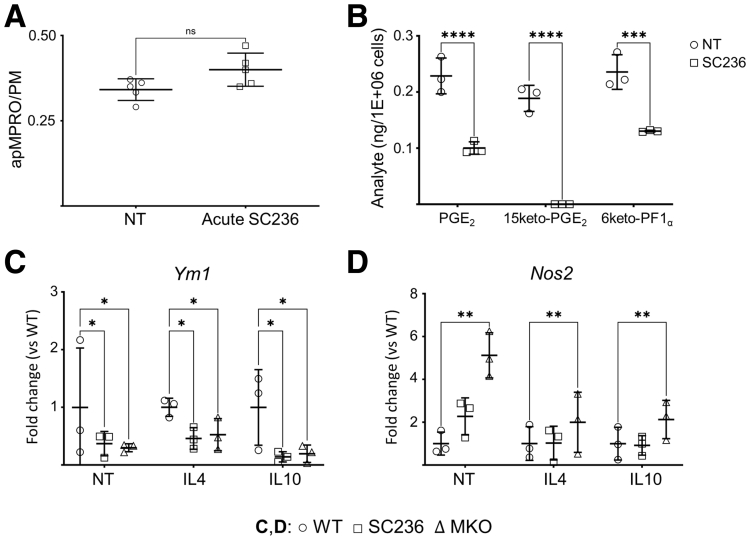
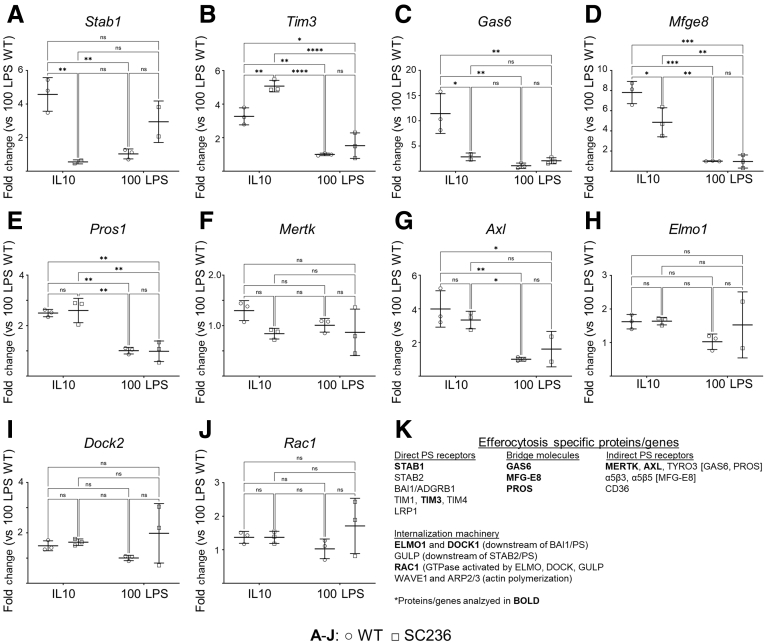
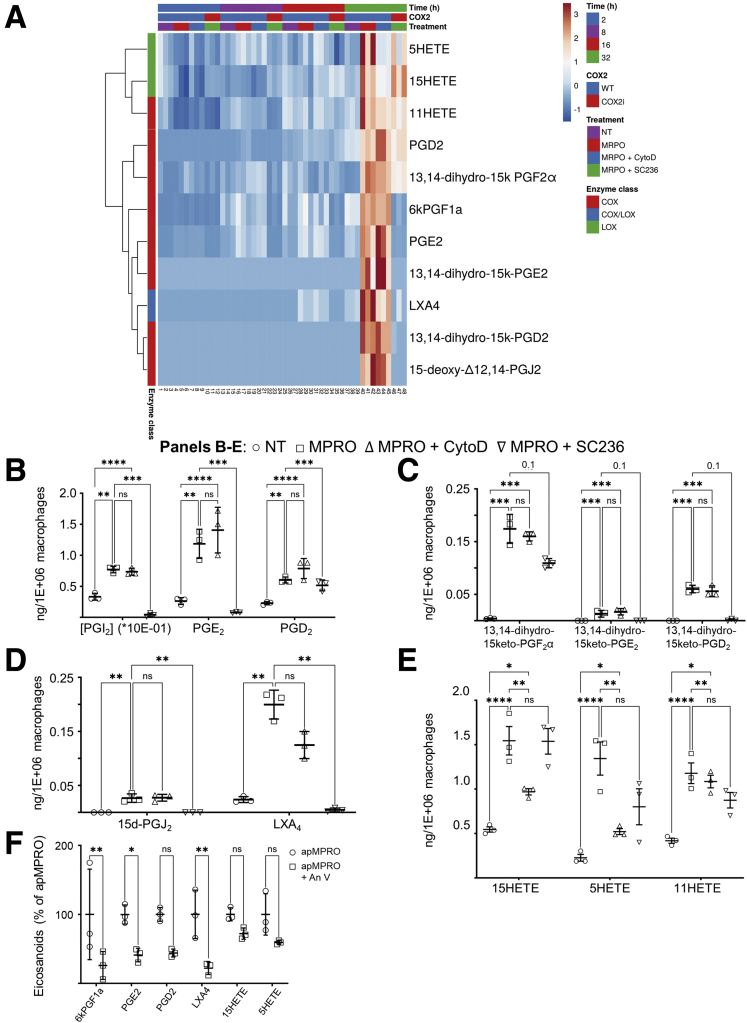
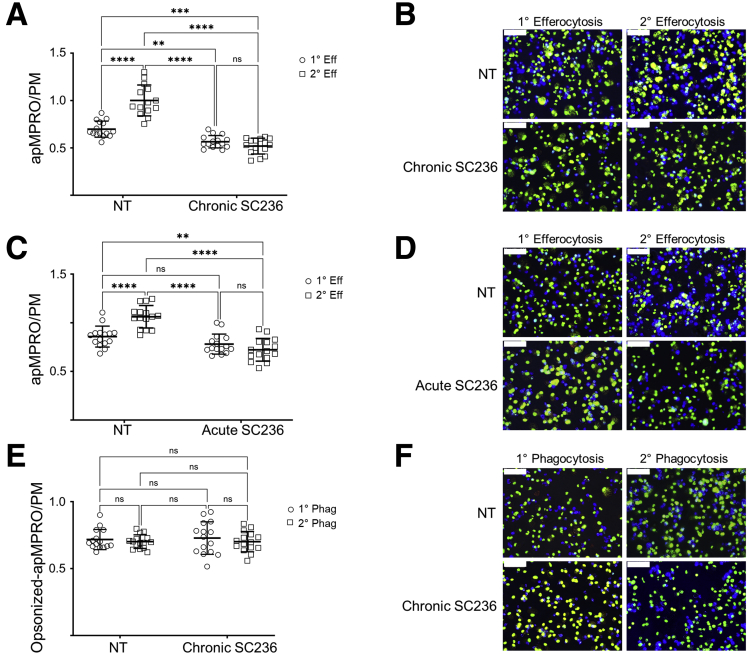
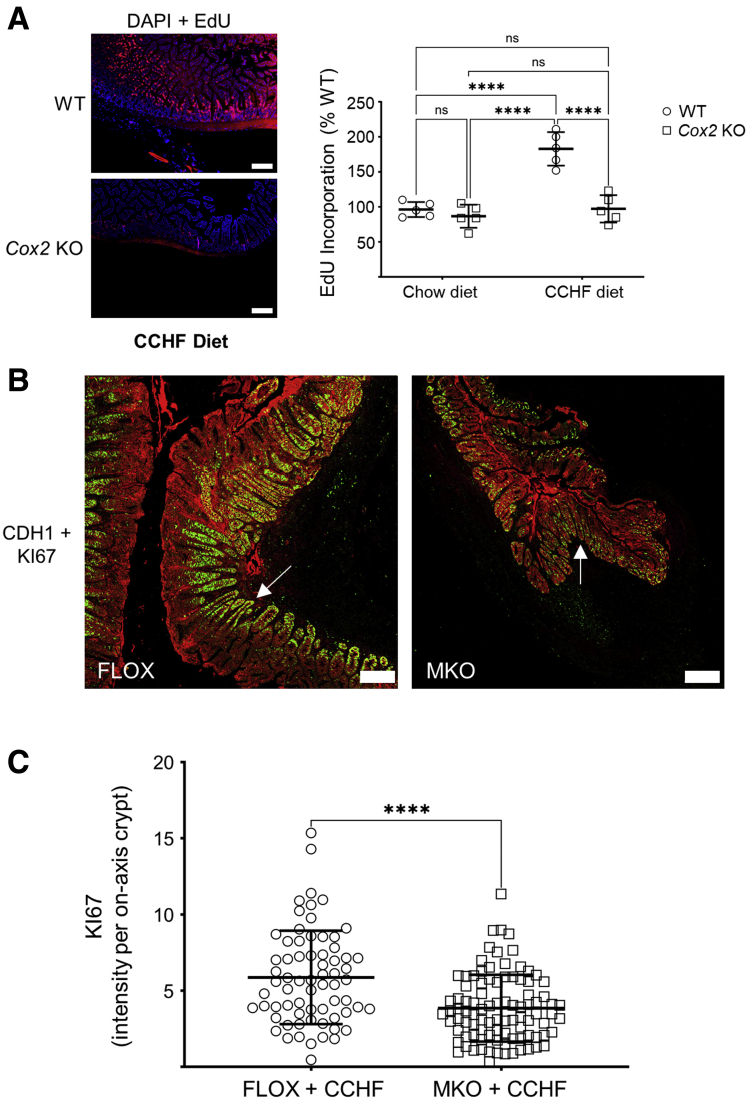
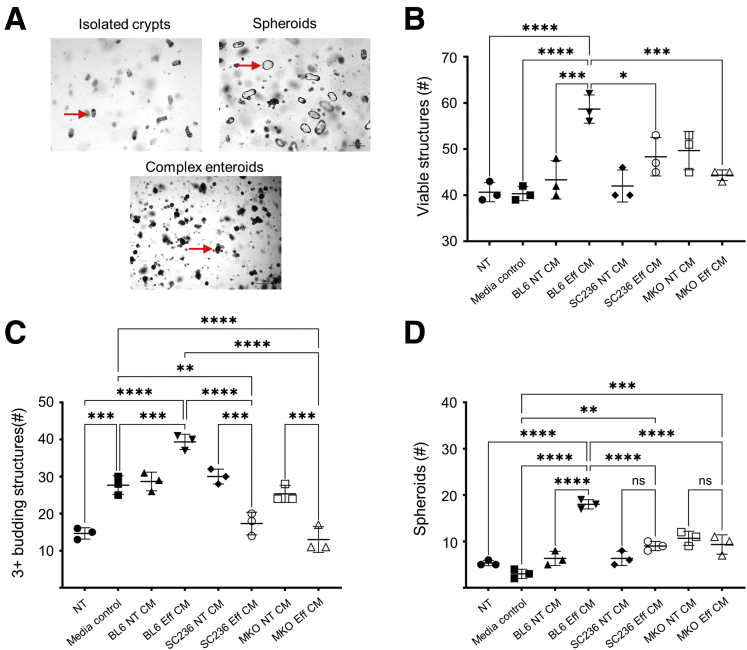
Results: Loss of COX2 impaired efferocytosis in mouse primary macrophages, in part, by affecting the binding capacity of macrophages for apoptotic cells. This effect was comparable to that of high-dose lipopolysaccharide and was accompanied by both dysregulation of macrophage polarization and the inhibited expression of genes involved in apoptotic cell binding. COX2 modulated the production of efferocytosis-dependent lipid inflammatory mediators that include the eicosanoids prostaglandin I2, prostaglandin E2, lipoxin A4, and 15d-PGJ2; and further affected secondary efferocytosis. Finally, macrophage efferocytosis induced, in a macrophage COX2-dependent manner, a tissue restitution and repair phenotype in intestinal epithelial organoids.

Conclusions: Macrophage COX2 potentiates efferocytosis capacity and efferocytosis-dependent reprogramming, facilitating macrophage intestinal epithelial repair capacity.

Keywords: Eicosanoids; Inflammation Resolution; Inflammatory Bowel Disease; Lipidomics; Macrophage.


Figures

Figure 1
Figure 1
Absence of myeloid COX2 modulates the degree and character of ileo-ceco-colic inflammation in mice fed a CCHF diet. Four-to-6 month old Cox2 MKO and Cox2 FLOX control mice were fed a CCHF diet for 10 weeks (n = 3–4/group). The ileo-ceco-colic regions were fixed in formaldehyde, and paraffin-embedded cross sections were prepared for histological analysis. (A) Left panels show cross-sections from each ileo-ceco-colic region stained with hematoxylin and eosin, and tiled micrographs were generated. Representative images from FLOX and MKO mice are shown. Red scale bars = 1 mm. Black scale bars = 250 μm. Black boxes = areas of magnification. The right panel shows the % total tissue area of intestinal inflammation within each cross-section determined in FIJI. (B) Cross-sections were probed with antibodies against the epithelial marker CDH1, the neutrophil marker LY6G, and the macrophage marker F4/80; tiled confocal micrographs were generated. Representative micrographs taken of comparable F4/80-positive regions in both MKO and FLOX cross-sections are shown. White scale bar = 200 μm. Imaging was performed on a Zeiss LSM 900 confocal microscope as described in the Materials and Methods. (C) Tiled micrographs of comparable F4/80-positive regions within each MKO and FLOX cross-section were analyzed in FIJI. The % area ratio of LY6G to F4/80-positive fluorescence was determined in 15–20 (200 μm)2 regions of interest (ROIs) within each micrograph. ∗∗∗P < .001; ∗∗∗∗P < .0001. Unpaired Student’s t tests.
Figure 2
Figure 2
Chronic COX2 inhibition across 7 days, but not 2 days, increases the LPS-dependent inflammatory response of murine PMs;while seven days of culturedoes not otherwise affect PM viability or PM function. (A) PMs from BL6 mice were treated with vehicle (NT) or the COX2 inhibitor SC236 for 2 or 7 days. LPS (100 ng/mL) or vehicle was then added. Treatment was otherwise maintained, and 24 hours later, TNFα (TNF) gene expression was determined by qPCR on day 3 and day 8. Three biological replicates per condition. (B) Cell viability of 2-day and 7-day PMs with and without chronic COX2 inhibition was determined by DAPI exclusion via fluorescence-activated cell sorting. 3 biological replicates per condition. (C) LPS-dependent PGE2 levels in the media of the experiment represented in panel A were determined by LC-MS/MS. ∗∗∗P < .001; ∗∗∗∗P < .0001. Two-way analysis of variance with Tukey’s multiple comparisons test and adjusted P values. d, day; ns, not significant.
Figure 3
Figure 3
COX2 modulates the efferocytosis of apoptotic neutrophils by murine PMs. (A) Thioglycolate-elicited PMs isolated from Cox2 MKO and control FLOX mice were cultured for 7 days. To assess the efferocytosis capacity of the PMs, murine MPRO neutrophils were first treated with staurosporine to induce apoptosis, then labeled with Cell Proliferation Dye eFluor 450. Labeled apMPRO cells were added to the macrophages, and the numbers of cell-associated apMPRO per PM were determined at 30, 60, and 90 minutes. (B) PMs isolated from BL6 mice were either treated with vehicle (NT) or the COX2 inhibitor SC236 for 7 days, then treated with labeled apMPRO cells. The numbers of cell-associated neutrophils per PM were determined after 60 minutes. (C): For all analyses in panels A and B, up to 12 fields of approximately 100 macrophages each were analyzed from 3 separate biological replicates per condition. Data are shown for the experiment in panel B. PM cell numbers were determined by staining with nuclear green DCS1 and wheat germ agglutinin (WGA) Texas Red-X conjugate. apMPRO cell numbers were determined by prestaining with Cell Proliferation Dye eFluor 450. ×40 magnification; representative images are shown. Scale bar = 50 μm. ∗P < .05; ∗∗P < .01; ∗∗∗P < .001; ∗∗∗∗P < .0001. (A) One-way analysis of variance with Tukey’s multiple comparisons test and adjusted P values. (B) Unpaired Student’s t tests. m, minutes.
Figure 4
Figure 4
COX2 modulates the efferocytosis of apoptotic neutrophils by murine BMDMs. (A) BMDMs were derived from Cox2 FLOX and Cox2 MKO mice. Cells were either left unpolarized (NT) or treated for 48 hours with 20 ng/mL IL-10 (IL-10) or 10 ng/mL LPS (10 LPS). Labeled apMPRO cells were added for 60 minutes, and the number of neutrophils per macrophage was determined. (B) Chronically COX2 inhibited (SC236) or uninhibited (WT) BMDMs derived from BL6 mice were treated and assessed comparably. (C) Representative data for NT or IL-10– and LPS-treated cells from the experiment presented in panel A. BMDMs were stained with nuclear green DCS1 and WGA Texas Red-X conjugate, while MPRO cells were prestained with Cell Proliferation Dye eFluor 450. ×40 magnification; representative images. Scale bar = 50 um. For panels A and B, six to 8 fields of approximately 100 macrophages each were analyzed from 3 separate biological replicates per condition. ∗P < .05; ∗∗P < .01; ∗∗∗P < .001; ∗∗∗∗P < .0001. Two-way analysis of variance with Tukey’s multiple comparisons test and adjusted P values.
Figure 5
Figure 5
COX2 modulates efferocytosis by BMDMs and PMs in part by affecting the binding capacity for apoptotic neutrophils. For all panels, cytochalasin D (CytoD) was added 30 minutes prior to the addition of apMPRO neutrophils, to prevent the internalization of cell surface bound apoptotic cells. (A) FLOX and Cox2 MKO BMDMs were either left unpolarized (NT) or polarized for 48 hours with IL-10 or low-dose LPS (10 LPS). Binding of apMPRO cells to the surface of CytoD-treated FLOX and Cox2 MKO macrophages was determined as bound apMPRO per BMDM. (B) BMDMs isolated from BL6 mice were treated and assessed as described for panel A, with the exception that COX2 was chronically inhibited with SC236. (C) Thioglycolate-elicited PMs from BL6 mice were treated with vehicle or SC236 for 7 days, and the PM binding capacity for apMPRO was determined as in panel A. (D) Representative data from the experiment presented in panel A. BMDMs were stained with nuclear green DCS1 as well as with the cell membrane dye WGA Texas Red-X conjugate; MPRO cells were stained with Cell Proliferation Dye eFluor 450. ×40 magnification. Red arrows point to apMPRO cells bound to the macrophage cell membrane, but not internalized. Scale bar = 50 um. For panels A–C, 5–9 fields were analyzed from 3 biological replicates per condition. ∗P < .05; ∗∗P < .01; ∗∗∗P < .001; ∗∗∗∗P < .0001. (A, B) Two-way analysis of variance with Tukey’s multiple comparisons test and adjusted P values. (C) Student’s unpaired t test.
Figure 6
Figure 6
BMDM COX2 inhibition suppresses efferocytic index in a manner comparable to M1 polarization. BMDMs derived from BL6 mice were chronically inhibited with SC236 from isolation or left uninhibited (WT). BMDMs were left unpolarized (NT) or polarized with IL-10, low-dose LPS (10 ng LPS), or high-dose LPS as an M1 control (100 ng LPS). After 48 hours, synthetic apoptotic targets (silica beads coated with PC, PS, PE conjugated to rhodamine, and PE conjugated to biotin) were added to the macrophages. After 45 minutes, streptavidin Alexa Fluor-635 together with DAPI to stain nuclei and WGA Alexa Fluor-488 conjugate to stain cell membranes were added; and the cells were fixed with paraformaldehyde. (A) Schematic for the determination of efferocytic index (the number of internalized liposomes per cell) and efferocytic efficiency (% of all cell associated liposomes that were internalized) using the 2-color liposomal bead assay. (B, C) Both efferocytic index and efferocytic efficiency were determined from confocal micrographs by independently averaging the scores of 4–6 micrographs from each of 4 biological replicates. (D) Representative fluorescent images for data in panels B and C. Imaging was performed on a Zeiss LSM 900 confocal microscope as described in the Materials and Methods. Image analysis was performed using ImageJ. Scale bar = 20 um. ∗P < .05; ∗∗P < .01; ∗∗∗P < .001; ∗∗∗∗P < .0001. Two-way analysis of variance with Tukey’s multiple comparisons test and adjusted P values.
Figure 7
Figure 7
Acute COX2 inhibition does not affect efferocytosis, but chronic or constitutive loss of COX2 activity suppresses prostanoids otherwise present across the differentiation of monocytes into BMDMs while biasing the polarization state of BMDMs toward an inflammatory phenotype. (A) BL6 PMs were culture for 7 days and then pretreated with vehicle (NT) or SC236 for 60 minutes prior to addition of labeled apMPRO cells. Numbers of apMPRO cells per PM were determined by assessing multiple micrographic fields of at least 200 PMs for 3 biological replicates. (B) Bone marrow–derived monocytes were isolated from BL6 mice and treated with vehicle (NT) or the COX2 inhibitor SC236 from time 0. Media collected on day 4 were analyzed by LC-MS/MS for eicosanoids including PGE2, the PGE2 degradation product 15keto PGE2, and the PGI2 degradation product 6ketoPGF1α. Data from 3 biological replicates. (C, D) Bone marrow–derived monocytes from BL6 and Cox2 MKO mice were treated with vehicle or SC236 from time 0 (WT = BL6 BMDM + vehicle; SC236 = BL6 BMDM + SC236; MKO = Cox2 MKO BMDM + vehicle). On day 8, BMDMs were further treated with vehicle, IL-4 (20 ng/mL), or IL-10 (20 ng/mL). On day 10, gene expression levels of the activation markers Ym1 (M2/M2a marker) and Nos2 (M1 marker) were determined by qPCR. Data are expressed as fold differences from the corresponding intragroup COX2 WT and uninhibited control (WT). ∗P < .05; ∗∗P < .01; ∗∗∗P < .001; ∗∗∗∗P < .0001. (A) Unpaired Student’s t test. (B–D) 2-way analysis of variance with Tukey's multiple comparisons test and adjusted P values. ns, not significant.
Figure 8
Figure 8
Chronic COX2 inhibition reduces macrophage expression of efferocytosis-specific genes. BL6 BMDMs were treated with vehicle (WT) or the COX2 inhibitor SC236 from isolation. On day 8, BMDMs were polarized with either 20 ng/mL IL-10 (IL-10) or 100 ng/mL LPS (100 LPS). (A–J) Expression of efferocytosis-specific genes on day 10 of culture was determined by qPCR. Data are presented as fold change compared with WT COX2 + 100 ng/mL LPS. (K) Summary of efferocytosis specific proteins whose associated gene expression was investigated by qPCR. ∗P < .05; ∗∗P < .01; ∗∗∗P < .001; ∗∗∗∗P < .0001. Two-way analysis of variance with Tukey's multiple comparisons test and adjusted P values. ns, not significant.
Figure 9
Figure 9
Efferocytosis triggers production of COX- and lipoxygenase-dependent lipid signaling mediators in macrophages. (A) Mouse PMs were treated with apoptotic mouse neutrophils (MPRO cells), together with the inhibitors CytoD and SC236; eicosanoid levels in media were determined by LC-MS/MS across 32 hours (3 biological replicates per time point per condition). Rows were clustered using correlation distance and average linkage. (B–E) Efferocytosis triggered the production of (B) COX-dependent prostanoids including PGI2 (measured as its degradation product 6ketoPGF1α), PGE2, and PGD2; (C) additional prostanoid degradation products; (D) anti-inflammatory and inflammation resolving eicosanoids 15dPGJ2 and LXA4; and (E) 15HETE, 5HETE, and 11HETE. ∗P < .05; ∗∗P < .01; ∗∗∗P < .001; ∗∗∗∗P < .0001. The Benjamini-Hochberg procedure was applied to 1-way analysis of variance for each lipidomic analyte with false discovery rate at level α = 0.05, followed by 2-way analysis of variance with Tukey’s multiple comparisons test and adjusted P values.
Figure 10
Figure 10
Both chronic and acute COX2 inhibition inhibit primary efferocytosis-dependent increase in efferocytosis capacity without affecting opsonin-dependent phagocytosis. (A) Thioglycolate-elicited PMs isolated from BL6 mice were treated from isolation with vehicle (NT) or SC236 (chronic SC236). On day 7, the media were changed to serum free OptiMEM + 0.2% BSA, and PMs were pretreated with vehicle or unlabeled apMPRO cells. After 24 hours, labeled apMPRO cells were added to all cultures, and the numbers of labelled neutrophils per PM at 60 minutes were determined as measures of primary (1° Eff) and secondary efferocytosis (2° Eff) capacity. Five fields of approximately 100 macrophages each were analyzed from each of 3 separate biological replicates per condition. (B) Representative data for the assessment presented in panel A. PMs were stained with nuclear green DCS1 as well as the cell membrane dye WGA Texas Red-X conjugate, while MPRO cells were stained with Cell Proliferation Dye eFluor 450. ×40 magnification; scale bar = 50 um. (C) The prior experiment and analysis were repeated, with the exception that COX2 was acutely inhibited (acute SC236) by addition of SC236 1 hour prior to the addition of the unlabeled or labeled apMPRO cells (for assessment of 2° Eff and 1° Eff, respectively). (D) Representative data for the assessment presented in Panel C, with staining and microscopy as in panel B. (E) The experiment and analysis presented in panel A was repeated, except that apMPRO cells were opsonized in mouse serum for 30 minutes prior to their addition to PMs. Determination in apMPRO to PMs resulted in measures of primary phagocytosis (1° Phag) and secondary phagocytosis (2° Phag). (F) Representative data for the assessment presented in Panel E, with staining and microscopy as in panels B and D. ∗∗P < .01; ∗∗∗P < .001; ∗∗∗∗P < .0001. Two-way analysis of variance with Tukey’s multiple comparisons test and adjusted P values.
Figure 11
Figure 11
Absence of COX2 modulates intestinal epithelial proliferation in mice fed a CCHF diet. (A) Cox2 KO and BL6 (WT) mice were fed either chow or CCHF diet for 14 days (n = 5/group). EdU was administered 24 hours prior to sacrifice, and longitudinal cross-sections of the terminal ilea from these mice were prepared for histological analysis. Left panel shows representative fluorescent micrographs of these cross-sections. Scale bar = 200 μm. Right panel shows EdU intensity within each cross-section expressed as a percent of WT mean intensity. (B, C) The ileo-ceco-colic cross-sections from the MKO and FLOX mice in the experiment detailed in Figure 1 were probed with antibodies against the epithelial marker CDH1 (red) and the proliferation marker KI67 (green). Tiled confocal micrographs of comparable inflammation-adjacent epithelial regions were produced. (B) Composites of representative KI67 and CDH1 micrographs of FLOX and MKO ileo-ceco-colic cross-sections are shown. Scale bar = 200 μm. White arrows point to crypts sectioned longitudinally on axis. Imaging was performed on a Zeiss LSM 900 confocal microscope as described in the Materials and Methods. (C) For every tiled micrograph and each crypt that was longitudinally sectioned on axis, the intensity of KI67-positive fluorescent signal was determined in FIJI. ∗∗∗∗P < .0001. (A) Two-way analysis of variance with Tukey’s multiple comparisons test and adjusted P values. (B) Unpaired Student’s t test.
Figure 12
Figure 12
COX2-dependent products present in macrophage efferocytosis CM modulate induction of a tissue repair phenotype in small intestinal enteroids. (A) Crypts isolated from small intestinal epithelium and grown in Matrigel can form spheroids and complex multibudding enteroids (representative images). (B–D) Thioglycolate-elicited PMs were isolated from BL6 mice and cultured without (BL6) or with chronic COX2 inhibition (SC236). Thioglycolate-elicited PMs were also isolated from Cox2 MKO mice. Each of the 3 types of PMs were then treated with apMPRO cells or vehicle; CM was collected from both apMPRO (Eff CM) and vehicle-treated (NT CM) PMs after 24 hours. The various CM were added to passaged enteroids derived from BL6 mice from time 0 hours following passage. The numbers of (B) viable structures at 72 hours, (C) complex 3+ budding enteroids and 72 hours, and (D) spheroids at 24 hours were determined as measures of epithelial restitution and repair. ∗P < .05; ∗∗P < .01; ∗∗∗P < .001; ∗∗∗∗P < .0001. One-way analysis of variance with Tukey's multiple comparisons test and adjusted P values. media control = macrophage media only; ns, not significant.
Figure 13
Figure 13
COX2 modulates the restitution signature induced in small intestinal enteroids by macrophage efferocytosis. (A–C) Thioglycolate-elicited PMs were isolated from BL6 mice and cultured without (BL6) or with chronic pharmacologic COX2 inhibition with SC236 (SC236). Thioglycolate-elicited PMs were also isolated from Cox2 MKO. Each of the 3 types of PMs was treated with apMPRO cells (MPRO) or vehicle (NT), and CM was collected after 24 hours. Eicosanoid levels in the macrophage conditioned medias were determined by LC-MS/MS. All eicosanoids differentially increased by efferocytosis are represented, including PGE2, the PGI2 metabolite 6ketoPGF1α, and the inflammation resolving mediator LXA4. (D) Freshly isolated small intestinal crypts were grown in Matrigel as untreated control samples (NT) or treated with either 10 nM (approximately 3 ng/mL) PGE2 or macrophage media–only control (media control). Crypts were also treated with each of the 6 macrophage CMs associated with panels AC. Eff CM indicates CM from macrophages treated with apMPRO cells; NT CM indicates CM from macrophages treated with vehicle. The induction of 24-hour spheroids was determined as a measure of restitution. Representative ×40 images with ×10 insets. Scale bars = 100 um. (EG) Gene expression of the restitution-associated WAE markers Daf2/Cd55b, Dpcr1, and Cld4 was determined for every group by qPCR. Three to 4 independent biological replicates were analyzed per condition. ∗P < .05; ∗∗P < .01; ∗∗∗P < .001; ∗∗∗∗P < .0001. (A–C) Two-way analysis of variance (ANOVA) with Sidak's multiple comparisons test and adjusted P values. (D) One-way ANOVA with Tukey’s multiple comparisons test and adjusted P values. (E–G) Nested 1-way ANOVA with Holm-Sidak’s multiple comparisons test and adjusted P values.
Figure 14
Figure 14
The pathogenic mechanism by which absence of myeloid COX2 produces CD-like inflammation in mice whose diet impairs their barrier function. A CCHF diet impairs barrier function and results in an influx of microbe-associated molecular patterns (MAMPs) into the lamina propria. Macrophages that lack COX2 overproduce inflammatory mediators including TNFα (Figure 2). TNFα recruits neutrophils, which undergo apoptosis. Macrophages that lack COX2 are unable to adequately clear apoptotic neutrophils (apNeutrophils) (Figure 2, Figure 3, Figure 4, Figure 5 and 7), which can undergo necrosis. Necrotic neutrophils damage intestinal epithelium. In the absence of COX2, macrophages that undergo efferocytosis fail to secrete anti-inflammatory and inflammation-resolving lipid mediators (Figure 6), and they are inadequate in promoting epithelial restitution and repair (Figures 9 and 10). The subsequent necrotic neutrophil-damaged epithelium results in even more influx of MAMPs, amplifying the cycle. Red symbols indicate the effects of loss of macrophage COX2.

References

    1. Xavier R.J., Podolsky D.K. Unravelling the pathogenesis of inflammatory bowel disease. Nature. 2007;448:427–434. - PubMed
    1. Liu J.Z., van Sommeren S., Huang H., Ng S.C., Alberts R., Takahashi A., Ripke S., Lee J.C., Jostins L., Shah T., Abedian S., Cheon J.H., Cho J., Daryani N.E., Franke L., Fuyuno Y., Hart A., Juyal R.C., Juyal G., Kim W.H., Morris A.P., Poustchi H., Newman W.G., Midha V., Orchard T.R., Vahedi H., Sood A., Sung J.J.Y., Malekzadeh R., Westra H.-J., Yamazaki K., Yang S-Koll, International Multiple Sclerosis Genetics Consortium. International IBD Genetics Consortium. Barrett J.C., Franke A., Alizadeh B.Z., Parkes M., B K T, Daly M.J., Kubo M., Anderson C.A. Weersma RK. Association analyses identify 38 susceptibility loci for inflammatory bowel disease and highlight shared genetic risk across populations. Nat Genet. 2015;47:979. - PMC - PubMed
    1. Lee J.C., Biasci D., Roberts R., Gearry R.B., Mansfield J.C., Ahmad T., Prescott N.J., Satsangi J., Wilson D.C., Jostins L., Anderson C.A., Consortium U.I.G., Traherne J.A., Lyons P.A., Parkes M., Smith K.G.C. Genome-wide association study identifies distinct genetic contributions to prognosis and susceptibility in Crohn’s disease. Nat Genet. 2017;49:262. - PMC - PubMed
    1. Rouzer CA, Marnett LJ. Cyclooxygenases: structural and functional insights. J Lipid Res 2009;50 Suppl(Suppl):S29–S34. - PMC - PubMed
    1. Meriwether D., Sulaiman D., Volpe C., Dorfman A., Grijalva V., Dorreh N., Solorzano-Vargas R.S., Wang J., O'Connor E., Papesh J., Larauche M., Trost H., Palgunachari M.N., Anantharamaiah G.M., Herschman H.R., Martin M.G., Fogelman A.M., Reddy S.T. Apolipoprotein A-I mimetics mitigate intestinal inflammation in COX2-dependent inflammatory bowel disease model. J Clin Invest. 2019;130:3670–3685. - PMC - PubMed

Publication types