. 2022 Jan;10(1):e003735.
doi: 10.1136/jitc-2021-003735.

Fc-null anti-PD-1 monoclonal antibodies deliver optimal checkpoint blockade in diverse immune environments

Affiliations

Fc-null anti-PD-1 monoclonal antibodies deliver optimal checkpoint blockade in diverse immune environments

Julia Moreno-Vicente et al. J Immunother Cancer. 2022 Jan.

Abstract

Background: Despite extensive clinical use, the mechanisms that lead to therapeutic resistance to anti-programmed cell-death (PD)-1 monoclonal antibodies (mAbs) remain elusive. Here, we sought to determine how interactions between the Fc region of anti-PD-1 mAbs and Fcγ receptors (FcγRs) affect therapeutic activity and how these are impacted by the immune environment.

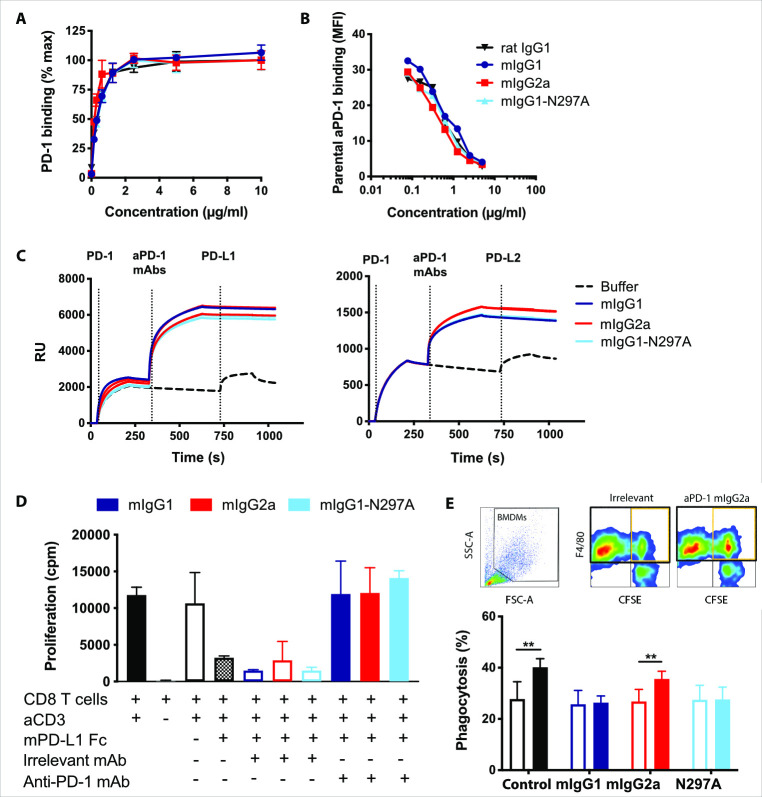
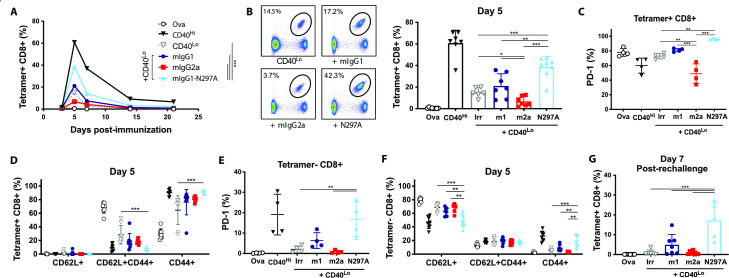
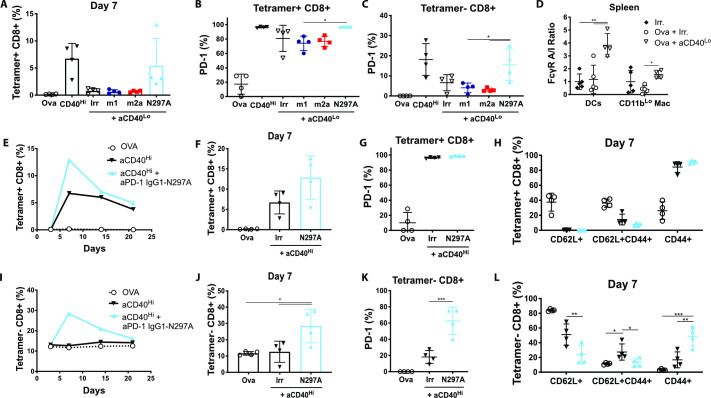
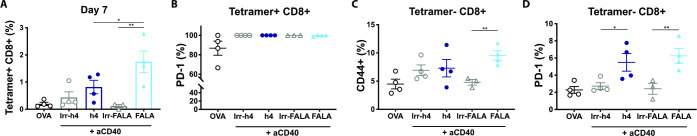
Methods: Mouse and human anti-PD-1 mAbs with different Fc binding profiles were generated and characterized in vitro. The ability of these mAbs to elicit T-cell responses in vivo was first assessed in a vaccination setting using the model antigen ovalbumin. The antitumor activity of anti-PD-1 mAbs was investigated in the context of immune 'hot' MC38 versus 'cold' neuroblastoma tumor models, and flow cytometry performed to assess immune infiltration.

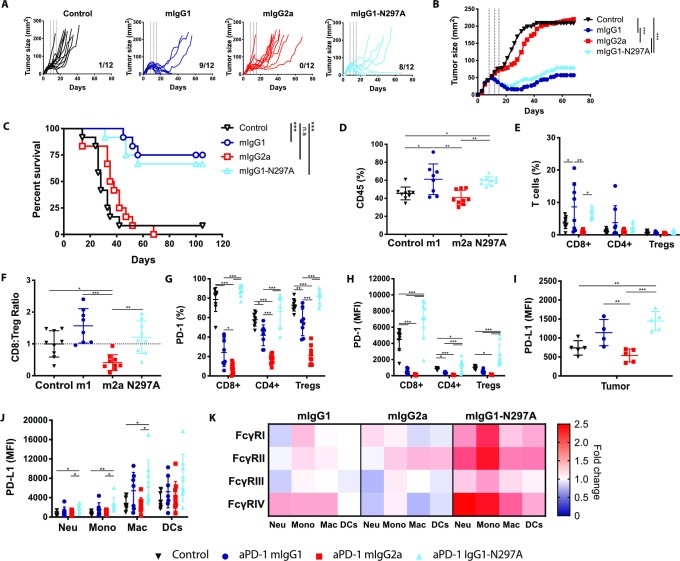
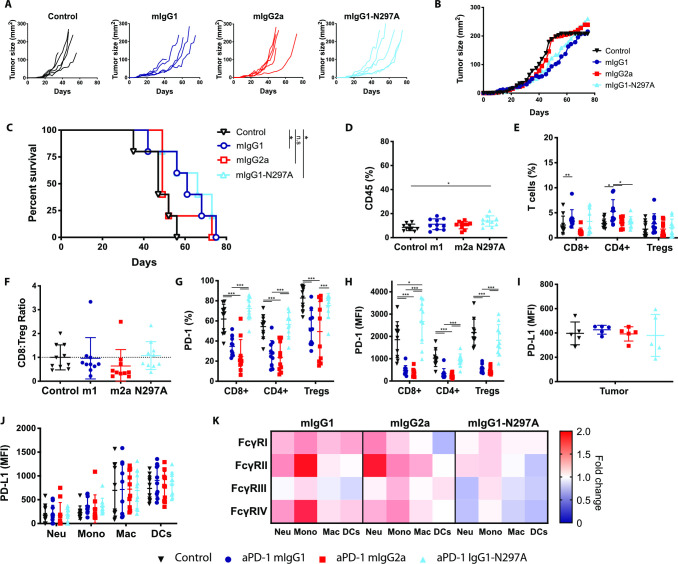
Results: Engagement of activating FcγRs by anti-PD-1 mAbs led to depletion of activated CD8 T cells in vitro and in vivo, abrogating therapeutic activity. Importantly, the extent of this Fc-mediated modulation was determined by the surrounding immune environment. Low FcγR-engaging mouse anti-PD-1 isotypes, which are frequently used as surrogates for human mAbs, were unable to expand ovalbumin-reactive CD8 T cells, in contrast to Fc-null mAbs. These results were recapitulated in mice expressing human FcγRs, in which clinically relevant hIgG4 anti-PD-1 led to reduced endogenous expansion of CD8 T cells compared with its engineered Fc-null counterpart. In the context of an immunologically 'hot' tumor however, both low-engaging and Fc-null mAbs induced long-term antitumor immunity in MC38-bearing mice. Finally, a similar anti-PD-1 isotype hierarchy was demonstrated in the less responsive 'cold' 9464D neuroblastoma model, where the most effective mAbs were able to delay tumor growth but could not induce long-term protection.

Conclusions: Our data collectively support a critical role for Fc:FcγR interactions in inhibiting immune responses to both mouse and human anti-PD-1 mAbs, and highlight the context-dependent effect that anti-PD-1 mAb isotypes can have on T-cell responses. We propose that engineering of Fc-null anti-PD-1 mAbs would prevent FcγR-mediated resistance in vivo and allow maximal T-cell stimulation independent of the immunological environment.

Keywords: antibodies; immunotherapy; neoplasm; programmed cell death 1 receptor.


Conflict of interest statement

Competing interests: MC acts as a consultant to BioInvent and has received institutional support from BioInvent for grants and patents. JCG and SAB have received institutional support from BioInvent for grants.

Figures

Figure 1
Figure 1
Engineered mouse anti-PD-1 mAbs retain equivalent in vitro binding properties and function. (A) Mouse PD-1-transfected HEK293F cells were incubated with the indicated anti-PD-1 mAb isotypes at a range of concentrations prior to staining with a PE- or APC-labeled secondary antibodies. Data show mean fluorescence intensity (MFI) as a percentage of maximum. (B) Cells were incubated with anti-PD-1 mAb as in (A) in the presence of 1 µg/mL AF488-conjugated rat anti-PD-1 mAb. Data are presented as MFI of the rat anti-PD-1 relative to the concentration of competitive mouse mAb. Data in (A) and (B) show one representative experiment of two. Bars represent mean±SEM of triplicates. (C) Surface plasmon resonance analysis illustrating anti-PD-1 mAb binding to mouse PD-1 and blockade of PD-L1/2. Mouse anti-PD-1 mAbs (100 µg/mL) were passed over His-tagged PD-1 captured with an anti-His mAb. Recombinant PD-L1 or PD-L2-Fc were passed over (25 µg/mL) to demonstrate PD-1 binding or blockade. (D) Purified CD8 T cells from C57BL/6 mice were incubated with 1 µg/mL plate-bound anti-CD3, 5 µg/mL plate-bound PD-L1-Fc or irrelevant controls, and 5 µg/mL soluble mouse anti-PD-1 mAbs or irrelevant isotypes. Proliferation was assessed by [3H]-thymidine incorporation. Data show combined means from two independent experiments. Bars represent mean±SD. (E) Activated CFSE-labeled murine splenic T cells were opsonized with anti-PD-1 isotypes (filled bars) or irrelevant controls (open bars) prior to coculture with BMDMs. Experiment performed twice in triplicates. Bars show mean±SD. Student T-test, **p<0.01. BMDM, bone marrow-derived macrophages; CFSE, carboxyfluorescein succinimidyl ester; mAb, monoclonal antibodies; PD-1, programmed cell-death.
Figure 2
Figure 2
Expansion of OT-I cells is enhanced by mIgG1-N297A but impaired with mIgG2a anti-PD-1 mAbs. (A–F) Groups of C57BL/6 mice received OT-I cell transfer prior to intraperitoneal injection with 5 mg OVA alone or plus the indicated treatments on day 0. (A) Kinetics of SIINFEKL-specific CD8 T-cell expansion (shown as % of lymphocytes) after treatment with 100 µg anti-CD40 (CD40Hi), 10 µg anti-CD40 plus irrelevant mAbs (CD40Lo) or CD40Lo plus anti-PD-1 isotypes. (B) Example plots and percentage of SIINFEKL-specific CD8 T cells at day 5. (C–D) Expression of PD-1 (C) and frequency of CD62L+, CD44+ and double positive cells (D) in SIINFEKL-specific CD8 T cells at day 5. (E, F) Expression of PD-1 (E) and frequency of CD62L+, CD44+ and double positive cells (F) in tetramer negative CD8 T cells at day 5. (G) Percentage of SIINFEKL-specific CD8 T cells (as % of lymphocytes) at day seven following rechallenge with SIINFEKL peptide. Experiment performed twice, n=6–8 mice per group. Data in (C, E) show one representative experiment of two. Bars represent mean±SD. *P<0.05, **p<0.01, ***p<0.001 (one-way ANOVA). ANOVA, analysis of variance; mAbs, monoclonal antibodies; PD-1, programmed cell-death; OVA, ovalbumin.
Figure 3
Figure 3
Mouse anti-PD-1 IgG1-N297A but not mIgG1 or mIgG2a enhances endogenous CD8 T-cell responses to OVA. (A–C) C57BL/6 mice received 5 mg OVA alone or in combination with 100 µg anti-CD40 (CD40Hi), 10 µg anti-CD40 plus irrelevant mAbs (CD40Lo) or CD40Lo plus anti-PD-1 isotypes. (A, B) Percentage of (A) and PD-1 expression in (B) SIINFEKL-specific CD8 T cells at day 7. (C) Expression of PD-1 in tetramer negative CD8 T cells at day 7. (D) Mice received the indicated treatments and spleens were harvested 3 days later to assess expression of FcγRs in DCs and tissue-resident macrophages (CD11bLo Mac). A:I ratios were calculated by dividing the sum of MFI from FcγRI, III and IV by that of FcγRII. E-L) C57BL/6 mice received 5 mg OVA alone or in combination with 100 µg anti-CD40 plus irrelevant mAbs (CD40Hi) or plus anti-PD-1 mIgG1-N297A mAb. (E) Kinetics of SIINFEKL-specific CD8 T-cell expansion (shown as % of CD8 cells). (F) Percentage of SIINFEKL-specific CD8 T cells at day 7. (G–H) Expression of PD-1 (G) and frequency of CD62L+, CD44+ and double positive cells (H) in SIINFEKL-specific CD8 T cells at day 7. (I) Kinetics of tetramer negative CD8 T-cell expansion (shown as % of lymphocytes). (J) Percentage of tetramer negative CD8 T cells at day 7. (K–L) Expression of PD-1 (K) and frequency of CD62L+, CD44+ and double positive cells (L) in tetramer negative CD8 T cells at day 7. Experiment performed once, N=4 mice per group. Bars represent mean±SD, **p<0.05, **p<0.01, ***p<0.001 (One-way ANOVA). A/I Ratio, activating to inhibitory FcγR-binding ratio; ANOVA, analysis of variance; DCs, dendritic cells; FcγRs, Fcγ receptors; mAbs, monoclonal antibodies; MFI, mean fluorescence intensity; PD-1, programmed cell-death; OVA, ovalbumin.
Figure 4
Figure 4
Human anti-PD-1 IgG4-FALA enhances endogenous CD8 T-cell responses to OVA in hFcγR-expressing mice. Human FcγR-expressing mice received (i.p) 5 mg OVA alone or in combination with 200 µg anti-CD40 (mIgG1), 200 µg anti-CD40 plus 250 µg irrelevant mAbs (AT171-2 hIgG4 or AT171-2 hIgG4-FALA; in-house) or 200 µg anti-CD40 plus 250 µg anti-PD-1 mAbs (EW1-9 hIgG4 or hIgG4-FALA). (A, B) Percentage of (A) and PD-1 expression in (B) SIINFEKL-specific CD8 T cells at day 7. (C, D) Expression of PD-1 (C) and frequency of CD44+ cells in tetramer negative CD8 T cells at day 7. Representative of two independent experiments, N=4 mice per group. Bars represent mean±SD, *p<0.05, **p<0.01, (One-way ANOVA). ANOVA, analysis of variance; FALA, F234A-L235A mutation; FcγR, Fcγ receptors; PD-1, programmed cell-death.
Figure 5
Figure 5
Anti-PD-1 mIgG1 and mIgG1-N297A augment antitumor immunity against MC38 tumors while mIgG2a abrogates therapeutic activity. C57BL/6 mice received 5×10⁵ MC38 cells s.c. on day 0. On days 8, 12, and 15 mice received 200 µg (i.p) anti-PD-1 isotypes or irrelevant mAbs. Tumor growth was monitored and mice culled when mean tumor area exceeded 225 mm2. Data are presented as tumor area (mm2) for each individual mouse (A) or the mean of the group (B). C) Kaplan-Meier curves showing percentage survival to humane end point on days after tumor inoculation. Experiment performed twice, N=12 mice per group. Log-rank (Mantel-Cox) Test, ***p<0.001. (D–K) Mice were sacrificed on day 16 and spleen and tumor analyzed by flow cytometry. (D, E) Frequency of CD45+ immune infiltrates (D) and T lymphocyte populations (expressed as % of CD45+ cells) (E). (F) CD8:Treg ratios expressed as fold change compared with control mice. (G, H) Expression of PD-1 on T lymphocyte populations as % (G) or MFI (H). (I, J) Expression of PD-L1 on tumor cells (I) or myeloid infiltrating subpopulations (J) presented as MFI. (K) Heat map indicating relative expression of FcγRs in treatment groups compared with controls. Colors represent the mean ratio of a group, where 1=no change; 1<downregulation; and 1>upregulation relative to controls. Experiment performed twice, N=7–9 mice per group. Bars represent mean±SD.D, *p<0.05, **p<0.01, ***p<0.001 (one-way ANOVA). ANOVA, analysis of variance; FcγRs, Fcγ receptors; MFI, mean fluorescence intensity; PD-1, programmed cell-death; s.c., subcutaneously.
Figure 6
Figure 6
Similar Fc requirements for anti-PD-1 mAb therapy in cold tumors are not accompanied by improved long-term survival. C57BL/6 mice received 5×10⁵ 9464D cells s.c. on day 0. (A–C) When tumors became 5×5 mm mice received weekly doses of 200 µg (i.p) anti-PD-1 isotypes or irrelevant mAbs. Tumor growth was monitored and mice culled when mean tumor area exceeded 225 mm2. Data are presented as tumor area (mm2) for each individual mouse (A) or the mean of the group (B). (C) Kaplan-Meier curves showing percentage survival to humane end point on days after tumor inoculation. Experiment performed once, N=5 mice per group. Log-rank (Mantel-Cox) Test, *p<0.05. (D–K) When tumors became 7×7 mm, mice received three doses of 200 µg (i.p) anti-PD-1 mIgG1, mIgG2a, mIgG1-N297A or irrelevant mAbs on days 1, 5 and 8. Mice were sacrificed on day 9 and spleen and tumor analyzed by flow cytometry. (D, E) Frequency of CD45+ immune infiltrates (D) and T lymphocyte populations (expressed as % of CD45+ cells) (E). F) CD8:Treg ratios expressed as fold change compared with control mice. (G, H) Expression of PD-1 on T lymphocyte populations as % (G) or MFI (H). I–J) Expression of PD-L1 on tumor cells (I) or myeloid infiltrating subpopulations (J) presented as MFI. (K) Heat map indicating relative expression of FcγRs in treatment groups compared with controls. Colors represent the mean ratio of a group, where 1=no change; 1<downregulation; and 1>upregulation relative to controls. Experiment performed twice, n=10 mice per group. Bars represent mean±SD, *p<0.05, **p<0.01, ***p<0.001 (One-way ANOVA). ANOVA, analysis of variance; i.p, intraperitoneally; mAb, monoclonal antibodie; MFI, mean fluorescence intensity; ns, not significant; PD-1, programmed cell-death; s.c., subcutaneously.

References

    1. Topalian SL, Drake CG, Pardoll DM. Targeting the PD-1/B7-H1(PD-L1) pathway to activate anti-tumor immunity. Curr Opin Immunol 2012;24:207–12. 10.1016/j.coi.2011.12.009 - DOI - PMC - PubMed
    1. Topalian SL, Hodi FS, Brahmer JR, et al. Safety, activity, and immune correlates of anti-PD-1 antibody in cancer. N Engl J Med 2012;366:2443–54. 10.1056/NEJMoa1200690 - DOI - PMC - PubMed
    1. Hamid O, Robert C, Daud A, et al. Safety and tumor responses with lambrolizumab (anti-PD-1) in melanoma. N Engl J Med 2013;369:134–44. 10.1056/NEJMoa1305133 - DOI - PMC - PubMed
    1. Dahal LN, Roghanian A, Beers SA, et al. FcgammaR requirements leading to successful immunotherapy. Immunol Rev 2015;268:104–22. 10.1111/imr.12342 - DOI - PubMed
    1. Nimmerjahn F, Ravetch JV. Fcγ receptors as regulators of immune responses. Nat Rev Immunol 2008;8:34–47. 10.1038/nri2206 - DOI - PubMed

Publication types

MeSH terms

Substances