. 2022 Dec;71(12):2463-2480.
doi: 10.1136/gutjnl-2021-325753. Epub 2022 Jan 11.

Impairment of gut microbial biotin metabolism and host biotin status in severe obesity: effect of biotin and prebiotic supplementation on improved metabolism

Eugeni Belda #  1   2 Lise Voland #  1 Valentina Tremaroli #  3 Gwen Falony #  4   5 Solia Adriouch #  1 Karen E Assmann #  1 Edi Prifti  6 Judith Aron-Wisnewsky  1   7 Jean Debédat  1 Tiphaine Le Roy  1 Trine Nielsen  8 Chloé Amouyal  1 Sébastien André  1 Fabrizio Andreelli  1 Matthias Blüher  9 Rima Chakaroun  9 Julien Chilloux  10 Luis Pedro Coelho  11   12 Maria Carlota Dao  1 Promi Das  13 Soraya Fellahi  14   15 Sofia Forslund  16 Nathalie Galleron  17 Tue H Hansen  8 Bridget Holmes  18 Boyang Ji  13 Helle Krogh Pedersen  8 Phuong Le  1 Emmanuelle Le Chatelier  17 Christian Lewinter  19 Louise Mannerås-Holm  3 Florian Marquet  1 Antonis Myridakis  20 Veronique Pelloux  1 Nicolas Pons  17 Benoit Quinquis  17 Christine Rouault  1 Hugo Roume  17 Joe-Elie Salem  21 Nataliya Sokolovska  1 Nadja B Søndertoft  8 Sothea Touch  1 Sara Vieira-Silva  4   5 MetaCardis ConsortiumPilar Galan  22 Jens Holst  8 Jens Peter Gøtze  23 Lars Køber  19 Henrik Vestergaard  8   24 Torben Hansen  8   25 Serge Hercberg  22 Jean-Michel Oppert  7 Jens Nielsen  13 Ivica Letunic  26 Marc-Emmanuel Dumas  27   28 Michael Stumvoll  29 Oluf Borbye Pedersen  8 Peer Bork  11   12 Stanislav Dusko Ehrlich  17   30 Jean-Daniel Zucker  1   6 Fredrik Bäckhed  3 Jeroen Raes #  4   5 Karine Clément #  31   7
Collaborators, Affiliations

Impairment of gut microbial biotin metabolism and host biotin status in severe obesity: effect of biotin and prebiotic supplementation on improved metabolism

Eugeni Belda et al. Gut. 2022 Dec.

Abstract

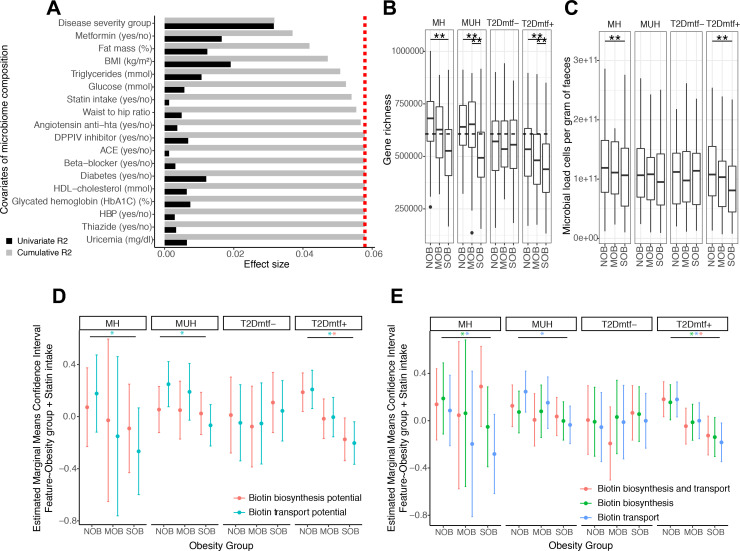
Objectives: Gut microbiota is a key component in obesity and type 2 diabetes, yet mechanisms and metabolites central to this interaction remain unclear. We examined the human gut microbiome's functional composition in healthy metabolic state and the most severe states of obesity and type 2 diabetes within the MetaCardis cohort. We focused on the role of B vitamins and B7/B8 biotin for regulation of host metabolic state, as these vitamins influence both microbial function and host metabolism and inflammation.

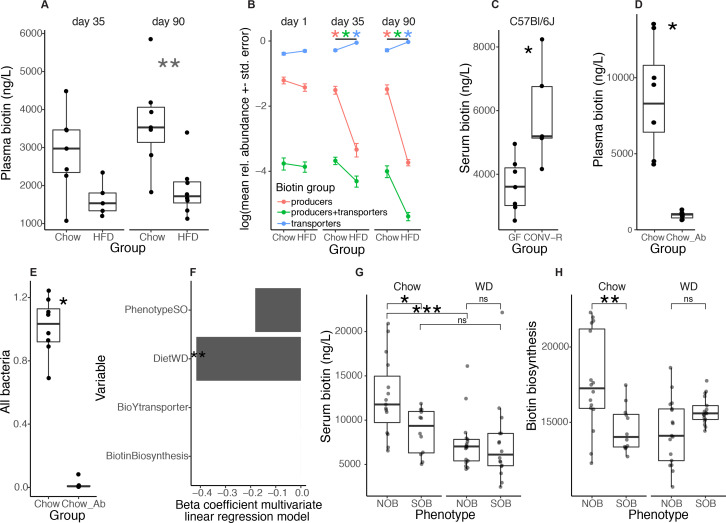
Design: We performed metagenomic analyses in 1545 subjects from the MetaCardis cohorts and different murine experiments, including germ-free and antibiotic treated animals, faecal microbiota transfer, bariatric surgery and supplementation with biotin and prebiotics in mice.

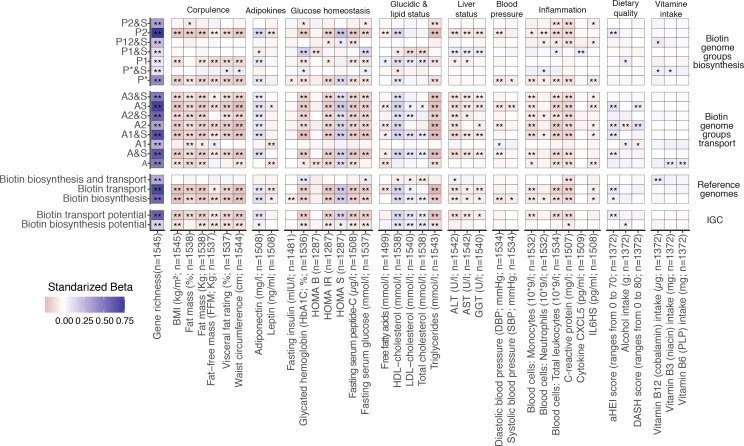
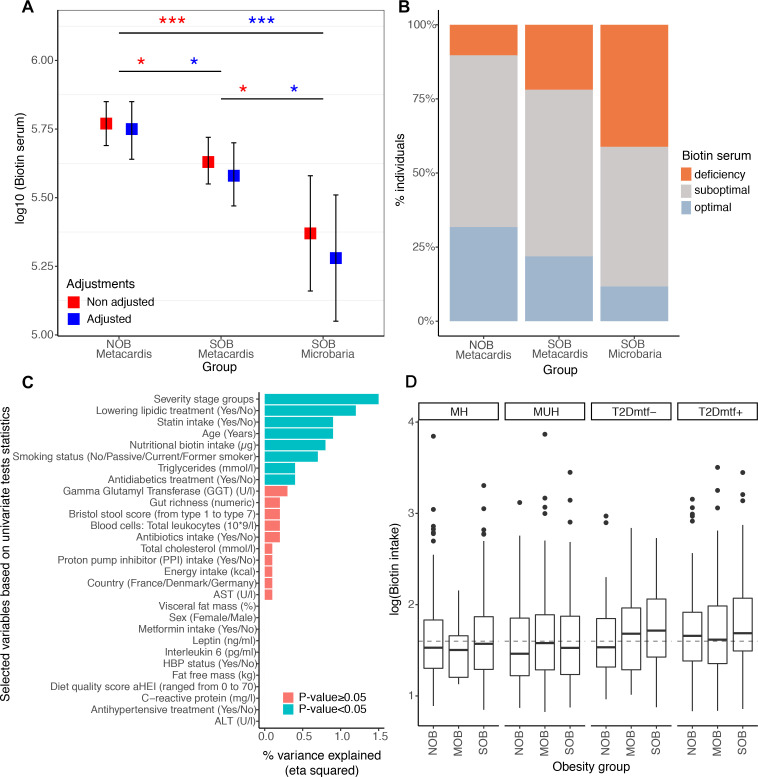
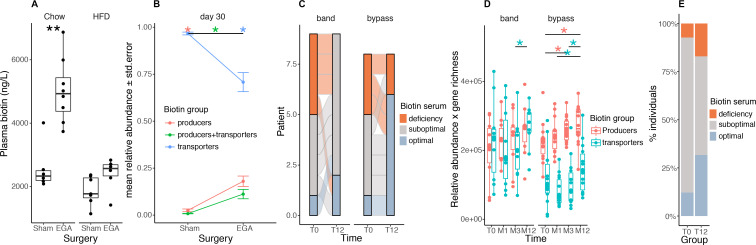
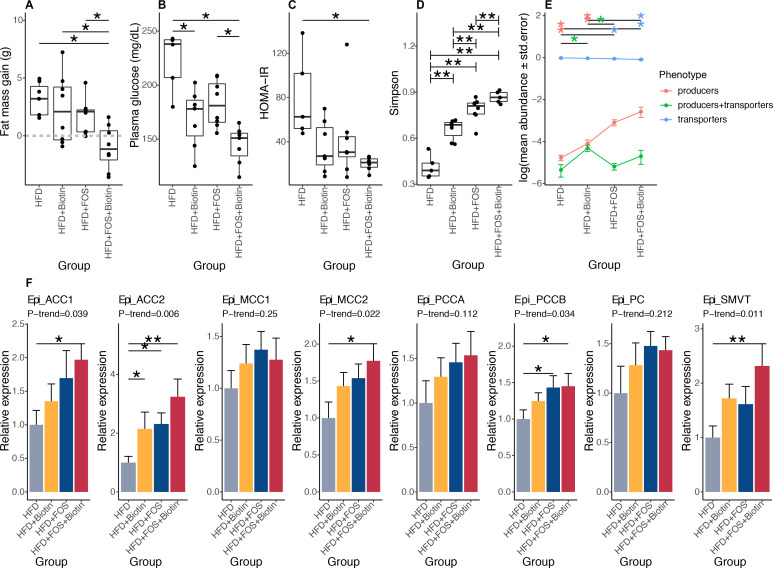
Results: Severe obesity is associated with an absolute deficiency in bacterial biotin producers and transporters, whose abundances correlate with host metabolic and inflammatory phenotypes. We found suboptimal circulating biotin levels in severe obesity and altered expression of biotin-associated genes in human adipose tissue. In mice, the absence or depletion of gut microbiota by antibiotics confirmed the microbial contribution to host biotin levels. Bariatric surgery, which improves metabolism and inflammation, associates with increased bacterial biotin producers and improved host systemic biotin in humans and mice. Finally, supplementing high-fat diet-fed mice with fructo-oligosaccharides and biotin improves not only the microbiome diversity, but also the potential of bacterial production of biotin and B vitamins, while limiting weight gain and glycaemic deterioration.

Conclusion: Strategies combining biotin and prebiotic supplementation could help prevent the deterioration of metabolic states in severe obesity.

Trial registration number: NCT02059538.

Keywords: diabetes mellitus; intestinal bacteria; micronutrients; nutrition; obesity.


Conflict of interest statement

Competing interests: KC is a consultant for Danone Research, Ysopia and CONFO therapeutics for work not associated with this study. KC held a collaborative research contract with Danone Research in the context of MetaCardis project. FB is a shareholder of Implexion pharma AB. MB received lecture and/or consultancy fees from AstraZeneca, Boehringer-Ingelheim, Lilly, Novo Nordisk, Novartis and Sanofi.

Figures

Figure 1
Figure 1
Functional features associated with the severity of obesity in metabolic health groups: effect of bacterial cell load. (A) Major variables explaining the microbiome compositional variation in the MetaCardis cohort subset (distance-based redundancy analyses, dbRDA; genus-level Bray-Curtis dissimilarity), either independently (univariate effect sizes in black) or in a multivariate model (cumulative effect sizes in grey). The cut-off for significant non redundant contribution to the multivariate model is represented by the red line. (B) Gene richness distribution across obesity groups stratified by metabolic health status. (**P value<0.05 in Kruskal- Wallis test controlled for country of recruitment and age, FDR<0.05 pairwise Wilcoxon rank-sum tests controlled for country of recruitment and age). The dash line represents the threshold that stratifies individuals as High vs. Low gene count (HGC/LGC) based on the median of gene richness in healthy German population (n=91) which exhibit gene richness bimodality. (C) Microbial cell counts distribution across obesity groups stratified by metabolic health status. (**P value<0.05 in Kruskal-Wallis test controlled for country of recruitment, FDR<0.05 pairwise Wilcoxon rank-sum tests controlled for country of recruitment). (D) Estimated marginal means and confidence intervals of log-transformed absolute abundances of microbiome biotin biosynthesis and consumption potential across obesity groups adjusted by statin intake and stratified by the metabolic health status. (E) Estimated marginal means and confidence intervals of log-transformed absolute abundances of biotin producers (eg, prokaryotic organisms harboring all biotin biosynthesis genes from pimelate precursor and no biotin biosynthesis transport genes), biotin transporters (prokaryotic organisms with no biotin biosynthesis genes) and biotin producers and transporters (prokaryotic organisms with all biotin biosynthesis genes from pimelate and biotin transport genes) across obesity groups adjusted by statin intake and stratified by the metabolic health status (*FDR<0.05 on linear regression models of feature abundance by obesity status adjusted by statin intake, P-adj<0.05 on pairwise Tukey tests between obesity states). BMI, body mass index; HbA1c, haemoglobin A1c; HDL, high-density lipoprotein; MH, metabolically healthy; MUH, metabolically unhealthy; T2D, type 2 diabetes.
Figure 2
Figure 2
Association between microbiome biotin status and host metabolic and inflammation markers in the MetaCardis subcohort. Heatmap indicating adjusted associations between log-10 transformed QMP abundance profiles of metagenomic signatures regarding biotin production and transport with clinical and lifestyle factors. The y-axis represents independent variables and the variables in the x-axis are the dependent variable (n=1545 individuals). These models were adjusted for the country of recruitment and age. (*P value<0.05; **FDR<0.05. Clinical and lifestyle variables for which no association with FDR<0.05 was found are not included in the heatmap). The color tones correspond to effect sizes represented by standardized beta coefficients from the adjusted linear regression models. Biosynthesis and transport genome groups were defined according to the nomenclature defined in Rodionov et al. Briefly, these included 3 groups of strict biotin producers (P1, P2, P* groups) harboring all 4 genes common to the different pathway variants of biotin biosynthesis from pimelate (P2) or pimeloyl-ACP (P1, P*). This also included 8 groups of strict biotin auxotrophs A&S/A groups; microorganisms not capable of biotin production 45 and with (A&S groups) or without (A groups) genes involved in biotin transport) with different levels of incompletion in the 4 core biotin biosynthesis genes (harboring from 1 to 3 biosynthetic genes at most), and 4 groups of biotin producers that also harbors genes coding for biotin transport (P&S groups). ALT, alanine aminotransferase; AST, aspartate aminotransferase; BMI, body mass index; CXCL5, C-X-C motif chemokine ligand 5; GGT, γ-glutamyltransferase; HDL, high-density lipoprotein. LDL, low-density lipoprotein.
Figure 3
Figure 3
Systemic and nutritional biotin profiles across obesity groups in MetaCardis subcohort. (A) Differences of biotin serum levels between obesity groups in 212 individuals from the MetaCardis subcohort (n=107 (NOB), n=105 (SOB)) and 17 more severely obese individuals of the Microbaria study (*P value<0.05; ***P value<0.001). Significant differences were observed with non-adjusted and adjusted (for diabetes status, metformin, statin and biotin intakes) Generalized Linear Models and lsmeans function, with P-value adjustment for multiple comparisons with Benjamini-Hochberg method. Biotin serum was log10 transformed to enable a normal distribution of the biotin variable (NOB vs. SOB (MetaCardis and Microbaria) Cohen’s D effect size=0.91. NOB vs. SOB MetaCardis Cohen’s effect size D =0.18). (B) Distribution of biotin deficiency status between obesity groups according to the following thresholds: deficiency (<200 ng/l), suboptimal levels (200-400 ng/l), optimal levels (>400 ng/l). Significant differences were observed with Chi-2 tests (P-value=1.0x10⁻²). (C) Association between clinical covariates and biotin status defined by the urinary metabolite 3-hydroxyisovaleric acid. Horizontal bars correspond to the variance in 3-hydroxyisovaleric acid explained by each clinical covariate (measured by the eta squared statistic derived from a multivariate ANCOVA model, n=1545). Statistical significance is indicated for a global model containing all the variables. ALT: Alanine Aminotransferase, AST: Aspartate Aminotransferase, GGT: Gamma-Glutyl Transferase, HBP: high-blood pressure. (D) Differences in log10 transformed nutritional biotin intake (μg/day) across obesity groups stratified by metabolic health status (n=284 (NOB-MH), n=130 (NOB MUH), n=51 (NOB-T2Dmtf-), n=173 (NOB-T2Dmtf+), n=13 (MOB-MH), n=81 (MOB-MUH), n=41 (MOB-T2Dmtf-), n=164 (MOB-T2Dmtf+), n=161 (SOB-MH), n=219 (SOB-MUH), n=85 (SOB T2Dmtf-), n=143 (SOB-T2Dmtf+)). No significant differences in biotin intake were observed across study groups (FDR>0.05; non-parametric pairwise univariate tests controlled by country or statin intake). Dashed line represents the recommended daily biotin intake according to the European Food Safety Authority (40μg/day).; MH, metabolically healthy; MUH, metabolically unhealthy; T2D, type 2 diabetes.
Figure 4
Figure 4
HFD-induced obesity in mice leads to depletion of biotin serum levels together with depletion of bacterial biotin production lineages. (A) Plasma biotin concentration of age-matched Chow-fed and HFD-fed C57BL6/J mice after 4 (left panel) and 13 weeks (right panel) (**P value<0.01; Chow n=7 for day 35 and day 90, HFD n=5 for d35 and n=8 for d90, Wilcoxon rank-sum test) (B) Relative abundance profiles of biotin producers (bacteria with all biotin biosynthesis genes from pimelate and no biotin transport gene), biotin transporters (bacteria with no gene involved in biotin biosynthesis) and biotin producers+transporters (bacteria harboring biotin biosynthesis and transport genes) in these same mice at baseline (day 1), day 35 and day 90 (*P value and FDR<0.05 pairwise Wilcoxon rank-sum test). (C) Serum biotin concentration of germ-free (GF) and conventionally raised (CONV-R) C57BL6/J mice (*P value<0.05, C57BL6/J GF n=7 and CONV-R n=5; Wilcoxon rank-sum tests). (D) Plasma biotin concentration and (E) total bacterial 16S rRNA gene load measured by qPCR in chow-fed mice with (n=7) and without (n=8) large spectrum antibiotics (100mg/kg of vancomycin and 200 mg/kg of ampicillin, neomycin and metronidazole) diluted in water for 14 days (*P value<0.05; Wilcoxon rank-sum test). (F) Beta-coefficients obtained with multivariate linear regression models between diet, phenotype and the abundances of biotin production and transport inferred from 16S data and serum biotin in a same global model with all covariates (*P value<0.05) from fecal transfer experiments in mice from panels g and h. (G) Serum biotin levels of Swiss Webster mice colonized with faecal slurries of 4 subjects from the MetaCardis subcohort (2 NOB; 2 SOB). Mice were colonized for 28 days and were fed either chow (NOB, n=16; SOB, n=12) or western diet (NOB, n=17; SOB, n=17) (*P value and FDR<0.05; ***P value<0.001 and FDR<0.05; Wilcoxon rank-sum test). (h) Abundance of biotin production module inferred from PICRUSt functional profiles of 16S rRNA gene amplicon data of mice from panel F (**P value<0.05; Wilcoxon rank-sum test). CONV-R, conventionally raised; GF, germ-free; HFD, high-fat diet; ns, not significant; WD, Western diet.
Figure 5
Figure 5
Biotin metabolism after bariatric surgery in mouse and human experiments. (A) Plasma biotin concentration of chow- or high-fat diet (HFD)-fed C57BL/6J mice with sham intervention (Sham) or bariatric surgery (Entero-gastro anastomosis, EGA). Blood was collected 1 month after surgery for the HFD group and 3 months after surgery for the Chow group (**P value<0.01 Wilcoxon rank-sum test; Chow-Sham n=6, Chow-EGA n=8, HFD-Sham n=7, HFD-EGA n=6). (B) Mean abundances of biotin producers (bacteria with all biotin biosynthesis genes from pimelate and no biotin transport gene), biotin transporters (bacteria with no gene involved in biotin biosynthesis) and biotin producers+transporters (bacteria harbouring biotin biosynthesis and transport genes) in sham and EGA mice of the HFD group 30 days after surgery (*FDR<0.05 pairwise Wilcoxon rank-sum test). (C) Distribution of biotin deficiency groups between baseline and month 12 in 17 individuals of the Microbaria study stratified by surgery group (n=9, gastric banding; n=8, Roux-en-Y gastric bypass) according to the following thresholds: deficiency (<200 ng/l), suboptimal levels (200-400 ng/l), optimal levels (>400 ng/l). P value=2.4x10⁻² (bypass), P-value=1.1x10⁻¹ (band); Fisher’s test. (D) Change of biotin producer and biotin transporter abundances (relative abundances multiplied by gene richness as a surrogate of microbial cell count to simulate QMP data) in 24 individuals of the Microbaria study stratified by surgery type (adjustable gastric banding, n=10; Roux-en-Y gastric, n=14) with metagenomics data at baseline, 1, 3, and 12 months after bariatric surgery (*P value<0.05; Wilcoxon signed-rank test). (E) Distribution of biotin deficiency groups at baseline (T0) and 12 months (T12) after bypass surgery in the BARICAN cohort (n=41; P value=2.0x10⁻², Chi2 test). EGA, entero-gastro anastomosis; HFD, high-fat diet.
Figure 6
Figure 6
Effects of biotin and FOS supplementation on host metabolism, biotin status and microbiome composition in established obesity in mouse experiments. (A) Fat mass gain of mice with established obesity, between day 82 (after twelve weeks of HFD and before treatments) and day 135 (after eight weeks of treatment by FOS and/or biotin) (A: HFD+FOS (n=10) vs. HFD (n=5); B: HFD+FOS vs. HFD+Biotin (n=9); C: HFD+Biotin vs. HFD; D: HFD+FOS+Biotin (n=5) vs. HFD; *P value<0.05, Kruskal-Wallis rank test with Dunn’s multiple comparison test) (B) Fasting glycaemia of these same animals measured after 6 weeks of treatment by FOS and/or biotin (*P value<0.05, Kruskal Wallis rank test with Dunn’s multiple comparison test). (C) HOMA-IR index calculated after 6 weeks of treatment by FOS and/or biotin (*P value<0.05, Kruskal Wallis rank test with Dunn’s multiple comparison test). (D) Simpson diversity distribution in different groups of mice with long-term established obesity (**P value<0.01 and FDR<0.05; pairwise Wilcoxon rank-sum test). (E) Mean abundances of biotin producers (bacteria with all biotin biosynthesis genes from pimelate and no biotin transport gene), biotin transporters (bacteria with no gene involved in biotin biosynthesis) and biotin producers+transporters (bacteria harbouring biotin biosynthesis and transport genes) in different groups of mice with long-term established obesity (*P value and FDR<0.05 pairwise Wilcoxon rank-sum test). (F) mRNA expression of biotin carboxylases (ACCA, ACCB, MCC1, MCC2, PCCA, PCCB, PC) and biotin transporter SMVT in epididymal adipose tissue of mice with long term established obesity supplemented with FOS and/or biotin after 20 weeks of total follow-up (Kruskal-Wallis rank test, with Dunn’s multiple comparison; *P value and FDR<0.05, **P value and FDR<0.01, pairwise comparisons and P-trend were calculated using linear contrast tests). HFD, high-fat diet; SMVT, sodium multi vitamin transporter.

Comment in

References

    1. NCD Risk Factor Collaboration (NCD-RisC) . Trends in adult body-mass index in 200 countries from 1975 to 2014: a pooled analysis of 1698 population-based measurement studies with 19·2 million participants. Lancet 2016;387:1377–96. 10.1016/S0140-6736(16)30054-X - DOI - PMC - PubMed
    1. GBD 2015 Obesity Collaborators, Afshin A, Forouzanfar MH, et al. . Health effects of overweight and obesity in 195 countries over 25 years. N Engl J Med 2017;377:13–27. 10.1056/NEJMoa1614362 - DOI - PMC - PubMed
    1. Cotillard A, Kennedy SP, Kong LC, et al. . Dietary intervention impact on gut microbial gene richness. Nature 2013;500:585–8. 10.1038/nature12480 - DOI - PubMed
    1. Aron-Wisnewsky J, Prifti E, Belda E, et al. . Major microbiota dysbiosis in severe obesity: fate after bariatric surgery. Gut 2019;68:70–82. 10.1136/gutjnl-2018-316103 - DOI - PMC - PubMed
    1. Vieira-Silva S, Falony G, Belda E, et al. . Statin therapy is associated with lower prevalence of gut microbiota dysbiosis. Nature 2020;581:310–5. 10.1038/s41586-020-2269-x - DOI - PubMed

Publication types

Associated data