. 2022 Nov;71(11):2233-2252.
doi: 10.1136/gutjnl-2021-326269. Epub 2022 Jan 11.

Gut microbiota regulate Alzheimer's disease pathologies and cognitive disorders via PUFA-associated neuroinflammation

Affiliations

Gut microbiota regulate Alzheimer's disease pathologies and cognitive disorders via PUFA-associated neuroinflammation

Chun Chen et al. Gut. 2022 Nov.

Abstract

Objective: This study is to investigate the role of gut dysbiosis in triggering inflammation in the brain and its contribution to Alzheimer's disease (AD) pathogenesis.

Design: We analysed the gut microbiota composition of 3×Tg mice in an age-dependent manner. We generated germ-free 3×Tg mice and recolonisation of germ-free 3×Tg mice with fecal samples from both patients with AD and age-matched healthy donors.

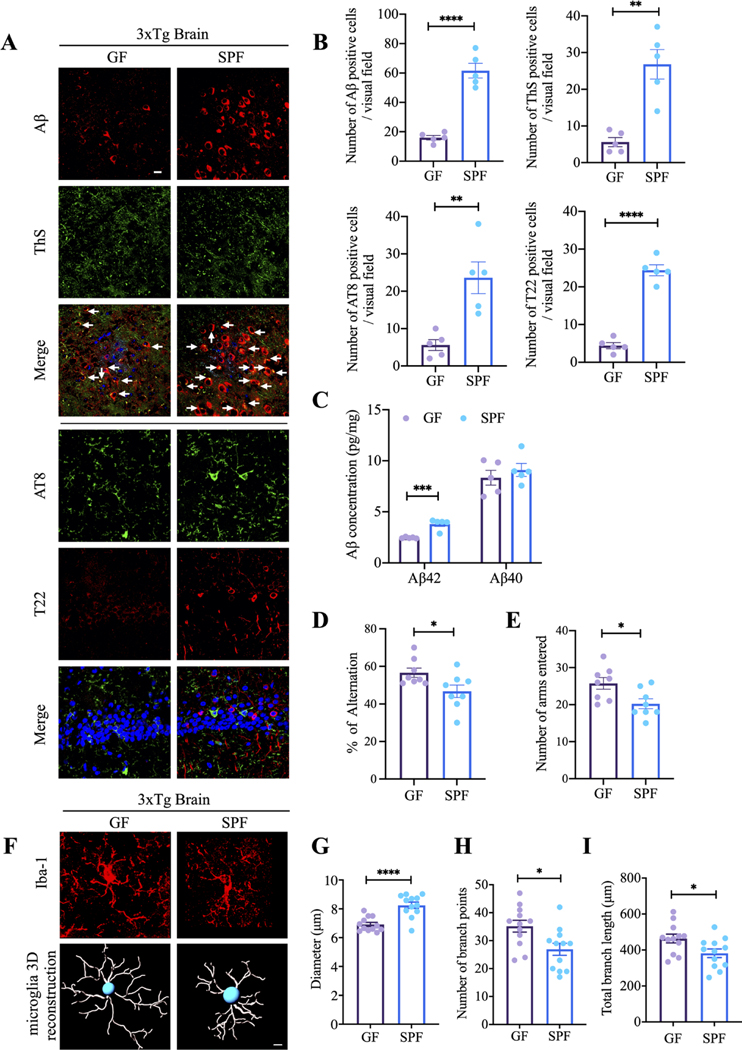
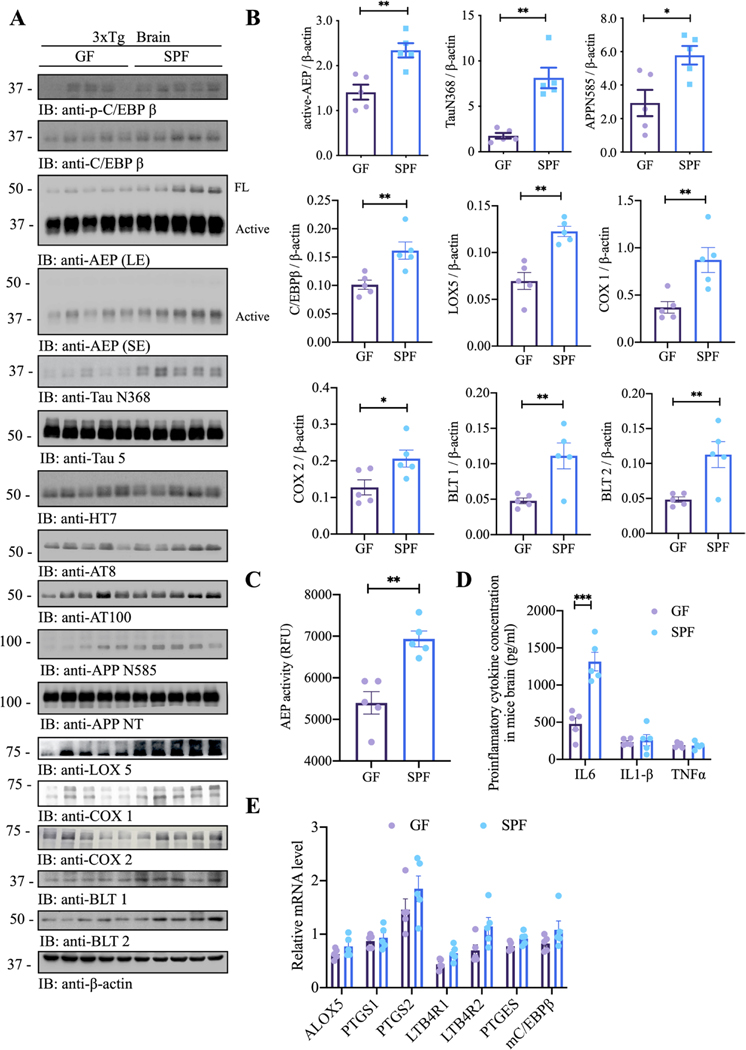
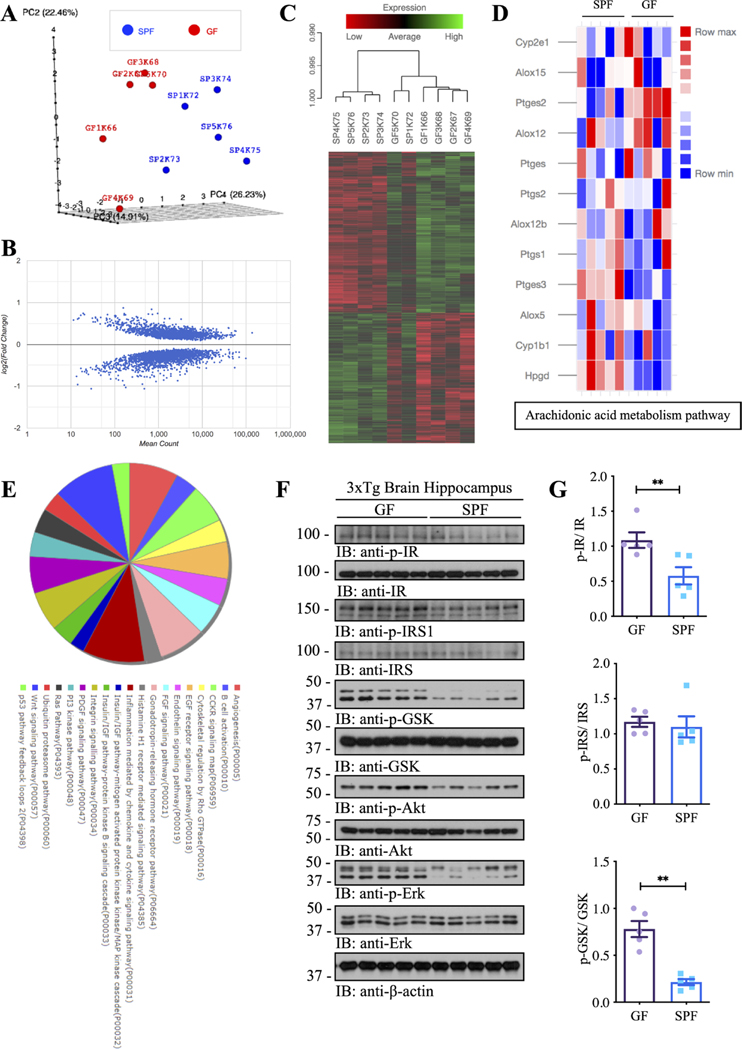
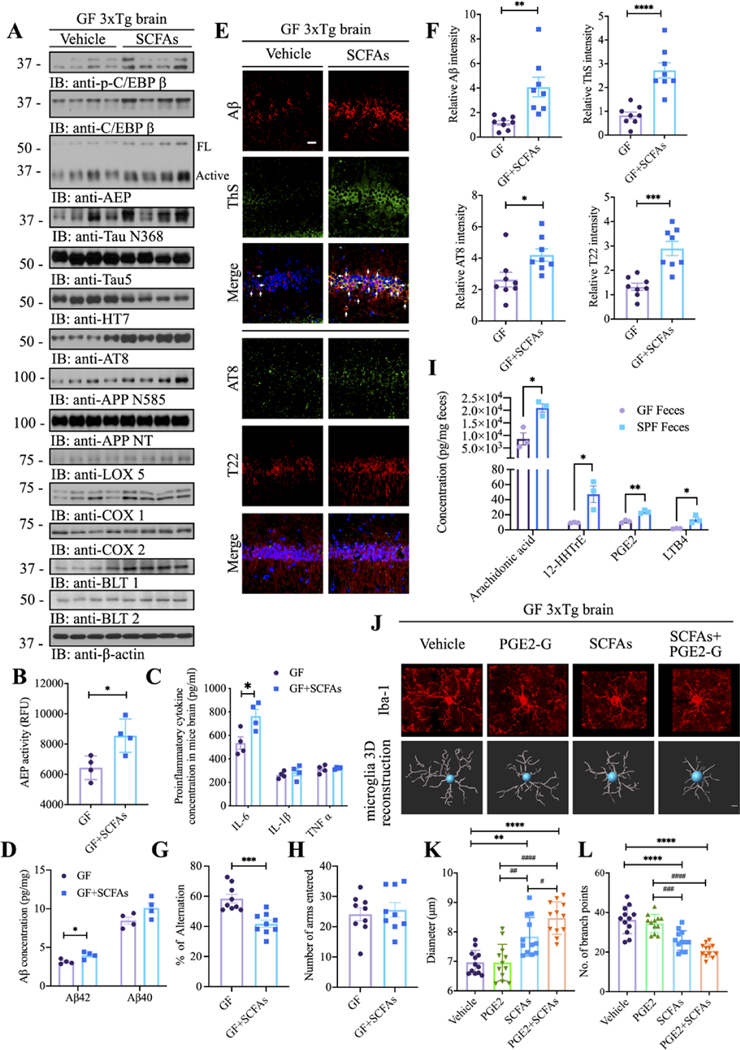
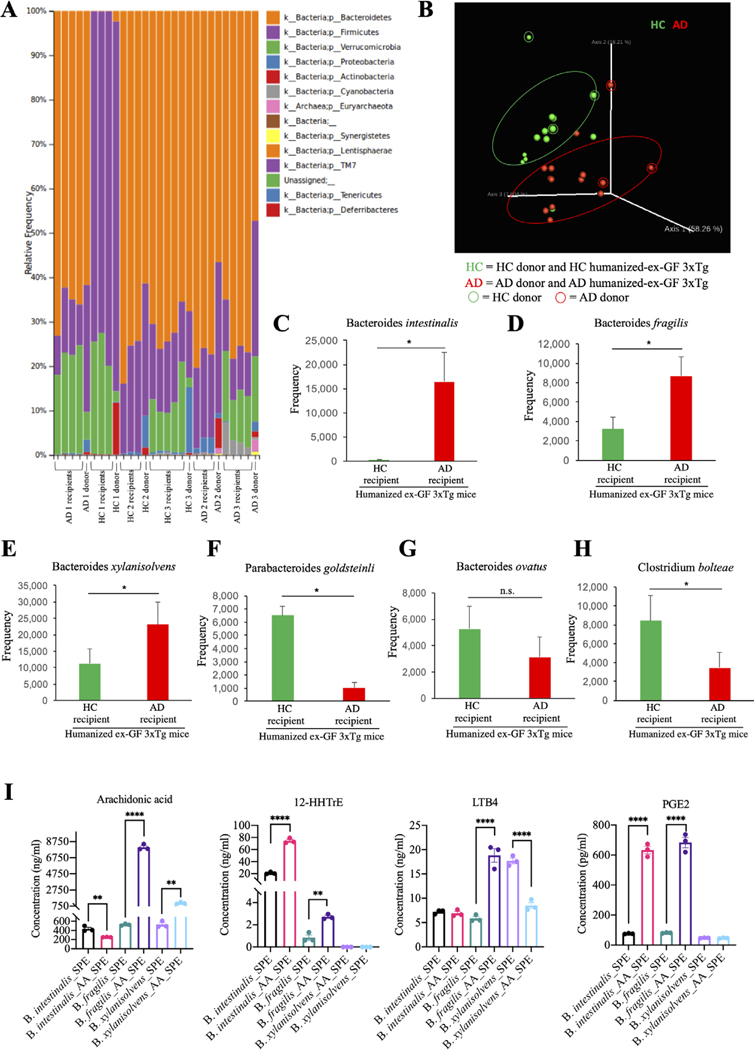
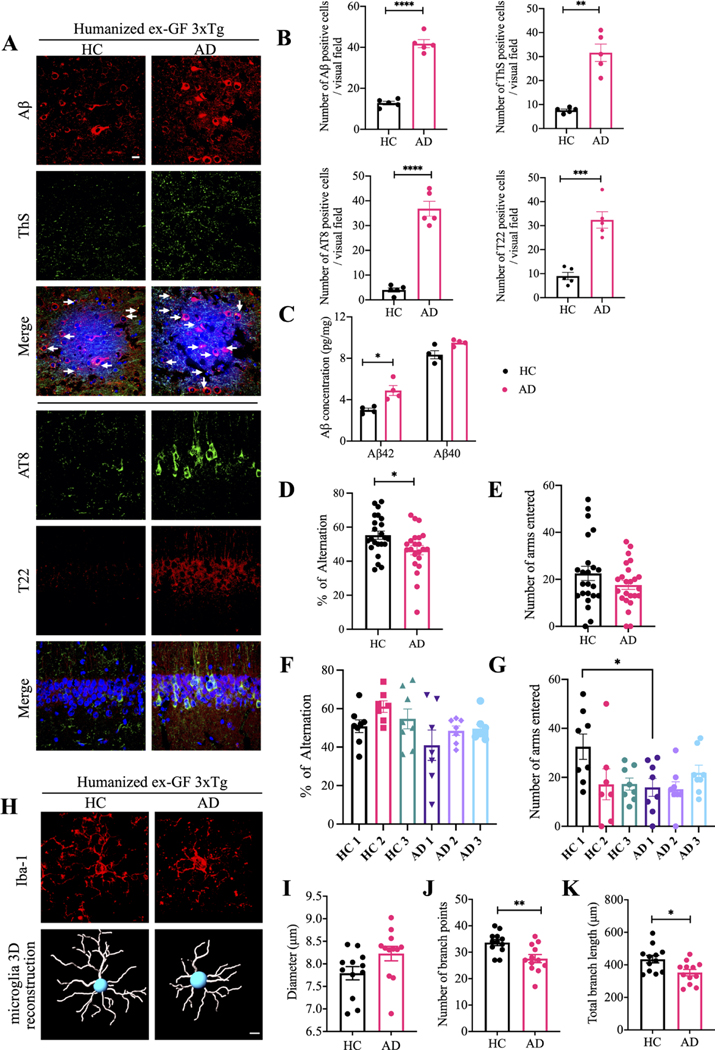
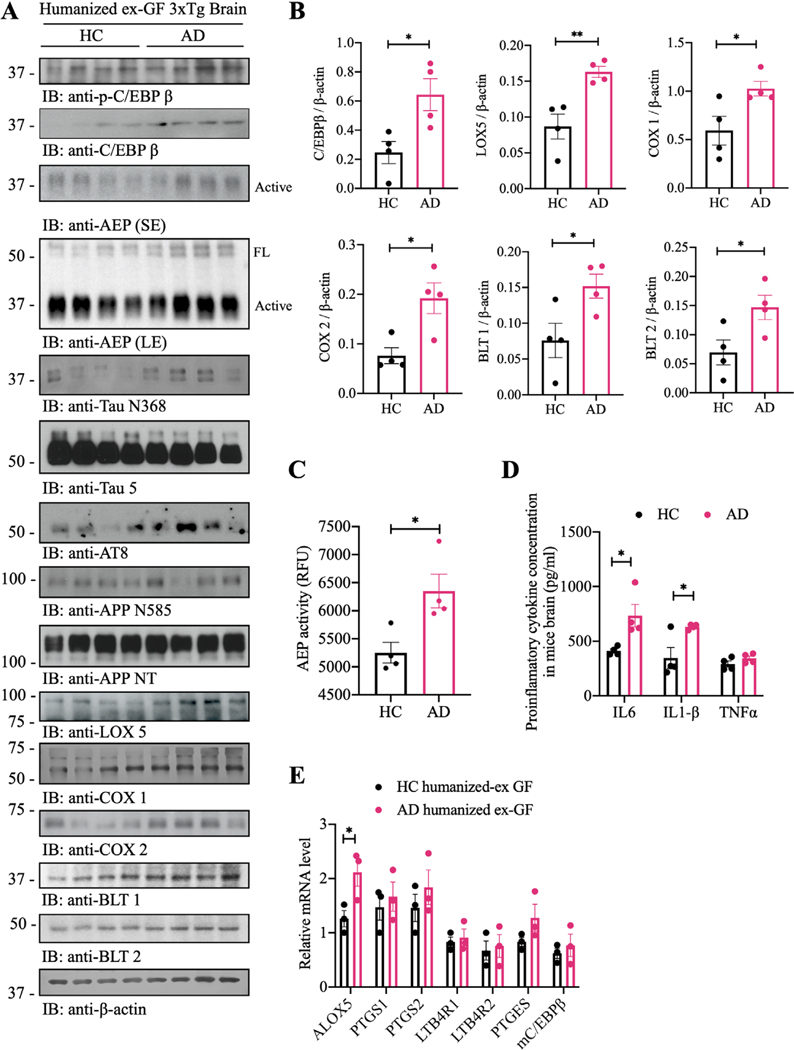
Results: Microbial 16S rRNA sequencing revealed Bacteroides enrichment. We found a prominent reduction of cerebral amyloid-β plaques and neurofibrillary tangles pathology in germ-free 3×Tg mice as compared with specific-pathogen-free mice. And hippocampal RNAseq showed that inflammatory pathway and insulin/IGF-1 signalling in 3×Tg mice brain are aberrantly altered in the absence of gut microbiota. Poly-unsaturated fatty acid metabolites identified by metabolomic analysis, and their oxidative enzymes were selectively elevated, corresponding with microglia activation and inflammation. AD patients' gut microbiome exacerbated AD pathologies in 3×Tg mice, associated with C/EBPβ/asparagine endopeptidase pathway activation and cognitive dysfunctions compared with healthy donors' microbiota transplants.

Conclusions: These findings support that a complex gut microbiome is required for behavioural defects, microglia activation and AD pathologies, the gut microbiome contributes to pathologies in an AD mouse model and that dysbiosis of the human microbiome might be a risk factor for AD.

Keywords: brain/gut interaction.


Conflict of interest statement

Competing interests: None declared.

Figures

Figure 1
Figure 1
Germ-free 3xTg mice display reduced AD pathologies and improved cognitive functions compared with SPF 3xTg mice. (A) Immunofluorescent staining of Aβ (red) and ThS (green) in frontal cortex region of brains, AT8 (green) and T22 (red) in hippocampus CA1 region of brains from germ-free 3xTg mice and SPF mice. Scale bar: 20 μm (B) quantitative analysis of Aβ positive cells, ThS positive cells, AT8 positive cells and T22 positive cells, respectively. The density of Aβ, ThS, AT8 and T22 positive cells were significantly increased in spf mice brain. (n=5 in each group, data are shown as mean±SEM. **P<0.01, ****p<0.0001 compared with control, unpaired t-tests.). (C) Aβ40 and Aβ42 concentrations in the cortex of germ-free 3xTg mice and SPF 3xTg mice were measured using human aβ40 and Aβ42 ELISA kit. the concentration of Aβ42 not aβ40 was significantly increased in spf 3xTg mice cortex compared with germ-free 3xTg mice cortex. (n=5 in each group, data are shown as mean±SEM ***p<0.001 compared with control, multiple unpaired T tests). (D, E) Y-maze behavioural tests. Spontaneous alternation (%) (D), number of arms entered (E); n=8 in each group, data are shown as mean±SEM. *P<0.05 compared with control, unpaired T tests. (F) Representative images of immunofluorescent staining of Iba-1 (red) in cortex (upper panel) and 3D reconstruction of Iba-1-stained microglia (lower panel) residing in the cortex of germ-free 3xTg mice and SPF 3xTg mice. (G–I) Quantitative analysis of diameter, number of branch points, and total branch length of microglia residing in the cortex. Data represent the mean±SEM; representative data of 12 samples; *p<0.05, ****p<0.0001 compared with control, unpaired t-tests. Aβ, amyloid-β; GF, germ-free; SPF, specific-pathogen-free.
Figure 2
Figure 2
Germ-free (GF) 3xTg mice demonstrate attenuated C/EBPβ/AEP pathway and AA-associated inflammation. (A) immunoblot showing p-C/EBPβ, C/EBPβ, AEP, APP and tau expression and processing, as well as arachidonic acid metabolism in mouse brains of germ-free 3xTg mice and SPF 3xTg mice. (B) Quantitative analysis of immunoblot. The bands of active-AEP, TauN368, APPN585, C/EBPβ, LOX5, Cox1, COX2, BLT1 and BLT2 were measured with image J and normalised with β-actin. n=5 in each group, data are shown as mean±SEM, *p<0.05, **p<0.01 compared with control, unpaired t-tests. (C) AEP activity assay in the brain lysates from germ-free 3xTg mice and SPF 3xTg mice. SPF 3xTg mice showed escalation in AEP activities compared with germ-free 3xTg mice. Data represent the mean±SEM; representative data of five samples; **p<0.01 compared with control, unpaired t-tests. (D) proinflammatory cytokine IL1-β, IL-6 and TNFα concentrations in the brain lysates from germ-free 3xTg mice and SPF 3xTg mice, respectively. Data represent the mean±SEM; representative data of five samples; ***p<0.001 compared with control, multiple unpaired t-tests. (E) Quantitative RT-PCR analysis of the brain samples from GF mice versus spf mice comparing C/EBPb targeted AA pathway genes. AA, arachidonic acid; AEP, asparagine endopeptidase; COX, cyclooxygenases; SPF, specific-pathogen-free.
Figure 3
Figure 3
Gutmicrobiota impacts the transcriptome atlas of mRNA expression in the hippocampal regions of germ-free and SPF 3xTg mouse model of AD. (A) Plot showing sample-to-sample distances in a principal components analysis (PCA). (B) Scatter plot showing log2 (fold change) against normalised mean gene count. (C) Cluster analysis of functional mRNAs in GF and SPF, and data are presented as a heat MAP (p<0.05). Each row represents the relative levels of expression of a single gene across all mice; each column represents the expression levels for a single mouse. The colours red and green denote low and high expression, respectively. (D) Heatmap showing differential genes of Arachidonic acid metabolism pathways between GF and SPF. (E) KEGG and Panther pathway analysis of differential genes. (F) Immunoblot blot showing insulin/IGF-1 signalling pathways in the hippocampus of germ-free 3xTg mice and SPF 3xTg mice. (G) Quantitative analysis of immunoblot. The bands of p-IR, p-IRS and p-GSK were measured with image J and normalised with IR, IRS and GSK, respectively. N=5 in each group, data are shown as mean±SEM, **p<0.01 compared with control, unpaired t-tests. AD, Alzheimer’s disease; GF, germ-free; IR, insulin receptors; SPF, specific-pathogen-free.
Figure 4
Figure 4
SCFAs trigger C/EBPβ/AEP activation and cognitive deficits in GF 3xTg mice and inflammation, exacerbated by PGE2-G. (A) Immunoblot showing p-C/EBPβ, C/EBPβ, AEP, APP and tau expression and processing, as well as arachidonic acid metabolism in the brains of GF mice with or without SCFAs administration. (B) AEP activity assay in the brain lysates from GF 3xTg mice with or without SCFAs administration. SCFAs treatment elevates AEP activity in the brains of GF 3xTg mice. Data represent the mean±SEM; representative data of four samples; *p<0.05 compared with control, unpaired t-tests. (C) Proinflammatory cytokine IL1-β, IL-6 and TNFα concentrations in the brain lysates from GF 3xTg mice and SPF 3xTg mice, respectively. Data represent the mean±SEM; representative data of four samples; *p<0.05 compared with control, multiple unpaired T tests. (D) Aβ40 and Aβ42 concentrations in the cortex of GF 3xTg mice with or without SCFAs administration were measured using human aβ40 and Aβ42 ELISA kit. The concentrations of Aβ42 not aβ40 were significantly increased in the cortex regions of the brains from SCFAs-treated GF 3xTg mice compared with vehicle-treated GF 3xTg mice. (N=4 in each group, data are shown as mean±SEM *p<0.05 compared with control, multiple unpaired T tests). (E) Immunofluorescent staining of Aβ (red) and ThS (green), AT8 (green) and T22 (red) in the hippocampus CA1 region of brains from GF 3xTg mice with or without SCFAs administration. Scale bar: 20 μm (F) quantitative analysis of Aβ positive cells, ThS positive cells, AT8 positive cells and T22 positive cells, respectively. The density of Aβ, ThS, AT8 and T22 positive cells was significantly increased in SCFAs-treated GF 3xTg mice brains. (n=8 in each group, data are shown as mean±SEM. *P<0.05, **p<0.01, ***p<0.001, ****p<0.0001 compared with control, unpaired T tests.). (G, H) Y-maze behavioural tests. spontaneous alternation (%) (G), number of arms entered (H); (N=9 in each group, data are shown as mean±SEM. ***P<0.001 compared with control, unpaired T tests). (I) Arachidonic acids and its metabolites concentrations in the faeces of GF mice and SPF mice. (N=3 in each group, data are shown as mean±SEM, *p<0.05, **p<0.01 compared with control, multiple unpaired T tests). (J) Representative images of immunofluorescent staining of Iba-1 (red) in the cortex (upper panel) and 3D reconstruction of Iba-1-stained microglia (lower panel) residing in the cortex of GF 3xTg mice, GF 3xTg mice treated with either PGE2-G or SCFAs, GF 3xTg mice treated with both SCFAs and PGE2-G. (K, L) Quantitative analysis of diameter, number of branch points of microglia residing in the cortex. data represent the mean±SEM; representative data of twelve samples; **p<0.01, ***p<0.001, ****p<0.0001 compared with control, multiple unpaired T tests; #P<0.05, ##P < 0.01, ###P < 0.001, #### P < 0.0001 compared with control, multiple unpaired t tests. Aβ, amyloid-β; AEP, asparagine endopeptidase; GF, germ-free; PGE2-G, prostaglandin E2–1-glyceryl ester; SCFA, short chain fatty acids.
Figure 5
Figure 5
Microbiome analysis in humanised ex-germ-free 3xTg mouse stool, revealing bacteroides elevation in the faeces from human AD faecal inoculated germ-free mice. (A) relative abundance of bacterial phyla determined by high throughput sequencing analysis. (B) principal coordinate plot (PcoA) of microbial community structure. (C–H) Mean frequency of bacterial species. Data represent the means±SEM; *p<0.05 compared with control, one-way ANOVA. (I) Concentrations of arachidonic acid (AA) and its metabolites in culture medium from in vitro culture of Bacteroides intestinalis, Bacteroides fragilis and Bacteroides xylanisolvens. Data represent the means±SEM; representative data of three samples; **p<0.01, ****p<0.0001 compared with control, one-way ANOVA. AD, Alzheimer’s disease; ANOVA, analysis of variance.
Figure 6
Figure 6
AD faecal humanised ex-germ-free (GF) mice exhibit augmented AD pathologies and cognitive deficits. (A) immunofluorescent staining of Aβ (red) and ThS (green) in the frontal cortex region of brains, AT8 (green) and T22 (red) in the hippocampus CA1 region of the brains from HC humanised ex-GF 3xTg mice and AD humanised ex-GF 3xTg mice. HC, GF mice colonised with faecal microbiomes from HC; AD, GF mice colonised with faecal microbiomes from AD patients. Scale bar: 20 μm (B) quantitative analysis of Aβ positive cells, ThS positive cells, AT8 positive cells and T22 positive cells, respectively. The density of Aβ, ThS, AT8 and T22 positive cells was significantly increased in AD humanised ex-GF 3xTg mice brain. (N=5 in each group, data are shown as mean±SEM **p<0.01, ***p<0.001, ****p<0.0001 compared with control, unpaired T tests). (C) aβ40 and Aβ42 concentrations in the cortex of HC humanised ex-GF 3xTg mice and AD humanised ex-GF 3xTg mice were measured using human aβ40 and Aβ42 ELISA kit. The concentrations of Aβ42 not aβ40 were significantly increased in AD humanised ex-GF 3xTg mice cortex compared with HC humanised ex-GF 3xTg mice cortex. (N=5 in each group, data are shown as mean±SEM ***p<0.001 compared with control, multiple unpaired T tests). (D–G) Y-maze behavioural tests. (D–E) compilation of all independent cohorts in each Y-maze test: spontaneous alternation (%), number of arms entered, grouped by healthy status of faecal donor (n=23–24 in each group, data are shown as mean±SEM. *P<0.05 compared with control, unpaired t-tests); (F–G) spontaneous alternation (%), number of arms entered of mice humanised with microbiota from either AD patients or matched HCs. (N=7–8 in each group, data are shown as mean±SEM, *p<0.05 compared with control, unpaired t-tests). (H) Representative images of immunofluorescent staining of Iba-1 (red) in the cortex (upper panel) and 3D reconstruction of Iba-1-stained microglia (lower panel) residing in the cortex of HC humanised ex-GF 3xTg mice and AD humanised ex-GF 3xTg mice. (I–K) quantitative analysis of diameter, number of branch points, and total branch length of microglia residing in the cortex. data represent the mean±SEM; representative data of 12 samples; *p<0.05, **p<0.01 compared with control, unpaired t-tests. Aβ, amyloid-β; AD, Alzheimer’s disease; HC, healthy control.
Figure 7
Figure 7
AD faecal humanised ex-GF mice demonstrate elevated C/EBPβ/AEP activation, associated with elevated inflammation. (A) Immunoblot showing p-C/EBP β, C/EBP β, AEP, APP and tau expression and processing, as well as arachidonic acid metabolism in mouse brains of HC humanised ex-GF 3xTg mice and AD humanised ex-GF 3xTg mice. Four samples in each group are from two separated donors (2 samples per donor). (B) Quantitative analysis of immunoblot. The bands of C/EBPβ, LOX5, COX1, COX2, BLT1 and BLT2 were measured with Image J and normalised with β-actin. (N=4 in each group, Data are shown as mean±SEM, *p<0.05, **p<0.01 compared with control, unpaired t tests). (C) AEP activity assay in the brain lysates from HC humanised ex-GF 3xTg mice and AD humanised ex-GF 3xTg mice. AD humanised ex-GF 3xTg mice showed escalation in AEP activity compared with that in HC humanised ex-GF 3xTg mice. Data represent the mean±SEM; representative data of five samples; *p<0.05 compared with control, unpaired t-tests. (D) Proinflammatory cytokine IL1-β, IL-6 and TNFα concentrations in the brain lysates from HC humanised ex-GF 3xTg mice and AD humanised ex-GF 3xTg mice, respectively. Data represent the mean±SEM; representative data of five samples; *p<0.05 compared with control, multiple unpaired t-tests. (E) Relative mRNA levels of genes involving arachidonic acid metabolism in the brain from HC humanised ex-GF 3xTg mice and AD humanised ex-GF 3xTg mice. Data represent the mean±SEM; representative data of three samples, *p<0.05 compared with control, two-way ANOVA. AD, Alzheimer’s disease; AEP, asparagine endopeptidase; ANOVA, analysis of variance; COX, cyclooxygenases; GF, germ-free; HC, healthy control.

References

    1. Heneka MT, Carson MJ, El Khoury J, et al. Neuroinflammation in Alzheimer’s disease. Lancet Neurol 2015;14:388–405. - PMC - PubMed
    1. Wendeln A-C, Degenhardt K, Kaurani L, et al. Innate immune memory in the brain shapes neurological disease hallmarks. Nature 2018;556:332–8. - PMC - PubMed
    1. Cagnin A, Brooks DJ, Kennedy AM, et al. In-Vivo measurement of activated microglia in dementia. Lancet 2001;358:461–7. - PubMed
    1. Griciuc A, Serrano-Pozo A, Parrado AR, et al. Alzheimer’s disease risk gene CD33 inhibits microglial uptake of amyloid beta. Neuron 2013;78:631–43. - PMC - PubMed
    1. Diaz Heijtz R, Wang S, Anuar F, et al. Normal gut microbiota modulates brain development and behavior. Proc Natl Acad Sci U S A 2011;108:3047–52. - PMC - PubMed

Publication types