. 2022 Sep;71(9):1812-1820.
doi: 10.1136/gutjnl-2021-326298. Epub 2022 Jan 11.

Mapping the human gut mycobiome in middle-aged and elderly adults: multiomics insights and implications for host metabolic health

Affiliations

Mapping the human gut mycobiome in middle-aged and elderly adults: multiomics insights and implications for host metabolic health

Menglei Shuai et al. Gut. 2022 Sep.

Abstract

Objective: The human gut fungal community, known as the mycobiome, plays a fundamental role in the gut ecosystem and health. Here we aimed to investigate the determinants and long-term stability of gut mycobiome among middle-aged and elderly adults. We further explored the interplay between gut fungi and bacteria on metabolic health.

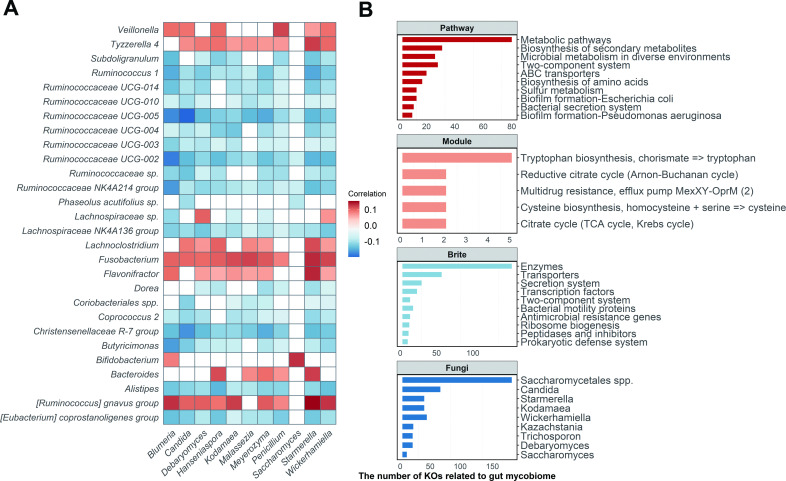
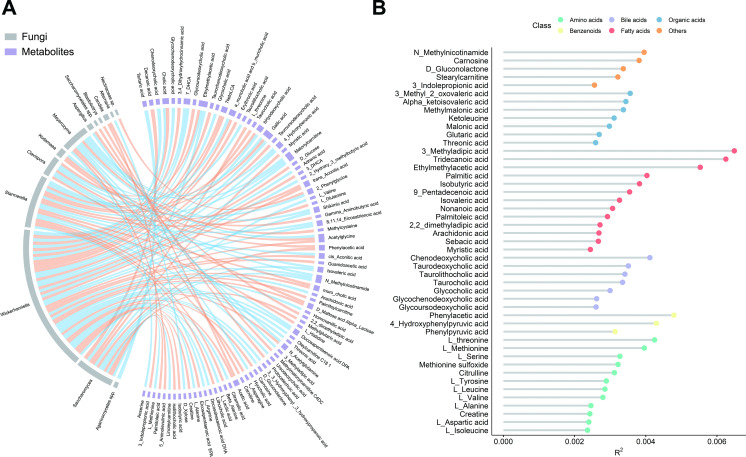
Design: The present study included 1244 participants from the Guangzhou Nutrition and Health Study. We characterised the long-term stability and determinants of the human gut mycobiome, especially long-term habitual dietary consumption. The comprehensive multiomics analyses were performed to investigate the ecological links between gut bacteria, fungi and faecal metabolome. Finally, we examined whether the interaction between gut bacteria and fungi could modulate the metabolic risk.

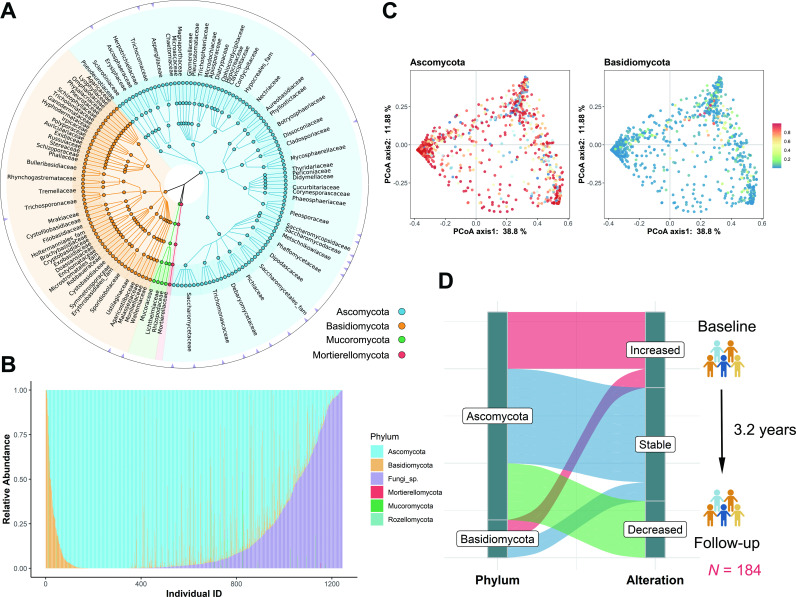
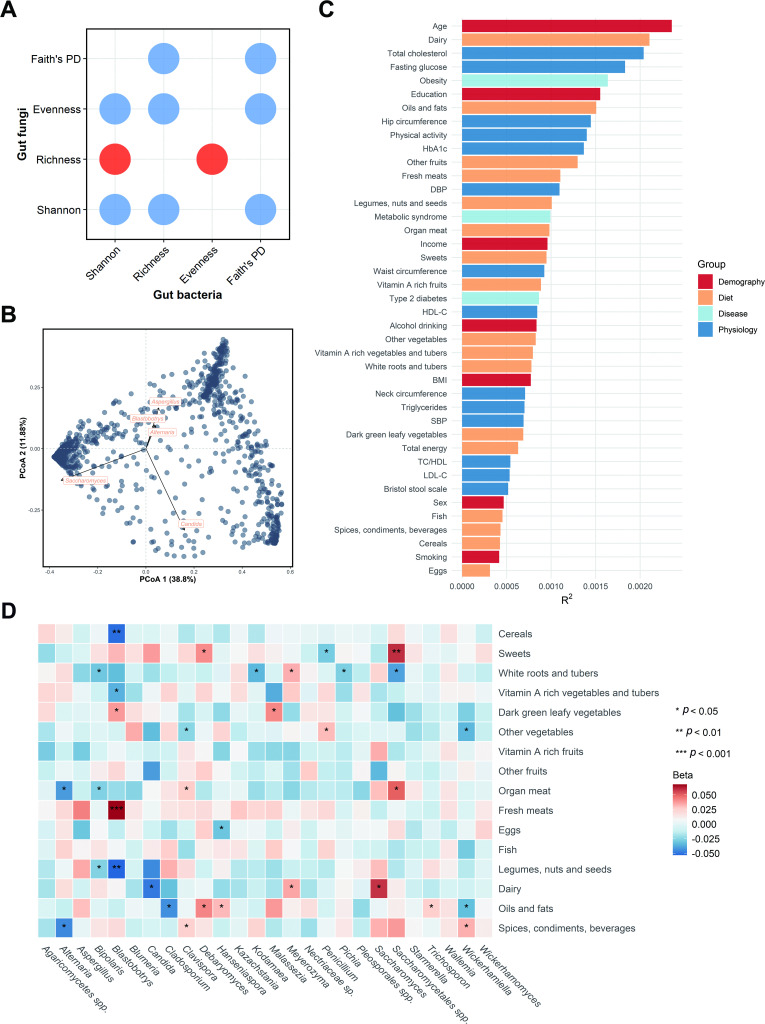
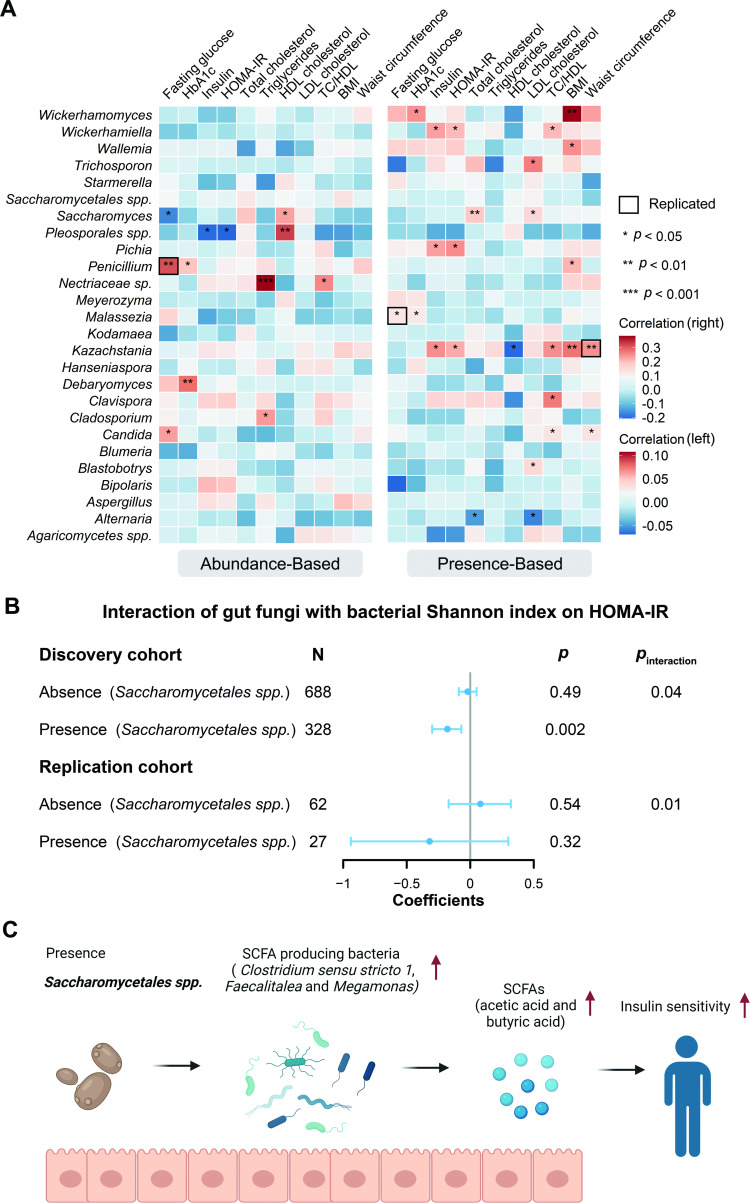
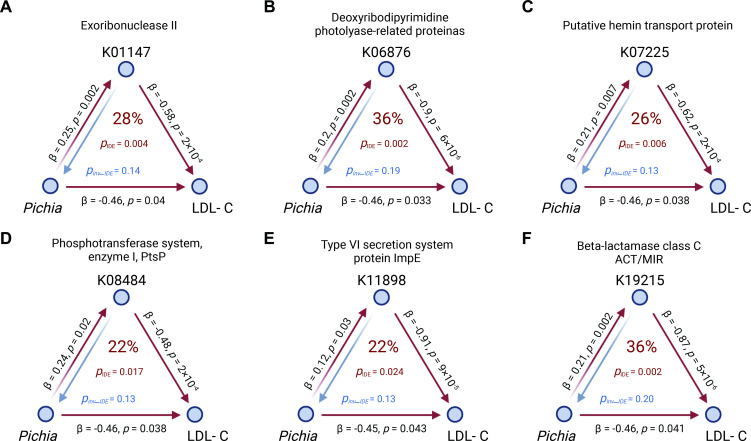
Results: The gut fungal composition was temporally stable and mainly determined by age, long-term habitual diet and host physiological states. Specifically, compared with middle-aged individuals, Blastobotrys and Agaricomycetes spp were depleted, while Malassezia was enriched in the elderly. Dairy consumption was positively associated with Saccharomyces but inversely associated with Candida. Notably, Saccharomycetales spp interacted with gut bacterial diversity to influence insulin resistance. Bidirectional mediation analyses indicated that bacterial function or faecal histidine might causally mediate an impact of Pichia on blood cholesterol.

Conclusion: We depict the sociodemographic and dietary determinants of human gut mycobiome in middle-aged and elderly individuals, and further reveal that the gut mycobiome may be closely associated with the host metabolic health through regulating gut bacterial functions and metabolites.

Keywords: intestinal microbiology; molecular epidemiology.


Conflict of interest statement

Competing interests: None declared.

Figures

Figure 1
Figure 1
Composition and variation of human gut mycobiome. (A) Taxonomic tree based on ITS2 sequencing data (n=1244, baseline) showing the main fungal representatives. The colour of each node is consistent with the colour of the corresponding fungal phylum node located in the lower left corner of the graph. The nodes from the inner to the outer circles represent the fungal taxa from the phylum to the species level. The triangles on the outermost ring represent the core genera of the study. (B) The relative abundance of fungal phyla among individuals. The X axis represents the individual ID number.’Fungi sp.’ here represents unidentified fungal phylum. (C) PCoA plots of Bray-Curtis distance of gut mycobiome composition from ITS2 sequences. Each dot represents an individual. The heatmap colour indicates the relative abundance of each phylum, where red indicates high abundance and blue indicates low abundance. (D) Long-term alterations of the gut mycobiome in the population from baseline to follow-up (n=184). Sankey plots displayed the proportions of gut fungal genera with significant (q<0.05) increased or decreased abundance or no significant alteration (stable). The median follow-up time was 3.2 years. The q values (false discovery rate adjusted p value) were calculated using the Benjamini-Hochberg method. PCoA, principal coordinate analysis.
Figure 2
Figure 2
Determinants of gut fungal structural variation. (A) Dot plot shows the associations between gut fungal and bacterial α-diversity indices. The red indicates a positive association, while blue indicates a negative association. (B) Top five contributors to fungal community variation was determined by envfit analysis (p<0.001), plotted on the two first PCoA dimensions. (C) The effect sizes of host factors on human gut mycobiome were evaluated by permutational multivariate analysis of variance (Adonis, permutations=999, n=1188, baseline). The bars were coloured according to metadata categories. (D) Associations between long-term dietary habits and gut mycobiome (n=1239). Beta and p values were calculated in a linear regression model adjusted for age, gender, BMI, total energy, smoking status, drinking status, income level, education, physical activity and Bristol stool scale. The quartiles of dietary variables were z-score transformed. ‘sp‘ or ‘spp‘ here represents unidentified fungal genus. BMI, body mass index; DBP, diastolic blood pressure; HbA1c, glycated haemoglobin; HDL-C, high-density lipoprotein cholesterol; LDL-C, low-density lipoprotein cholesterol; PCoA, principal coordinate analysis; PD, phylogenetic diversity; SBP, systolic blood pressure; TC:HDL, total cholesterol:high-density lipoprotein cholesterol ratio.
Figure 3
Figure 3
Ecological connections between gut fungi and bacteria. (A) Significant taxonomic associations between gut fungi and bacteria (|SparCC coefficient| >0.2, q<0.05; n=1244, baseline). The colour indicates the correlation coefficients estimated by the SparCC algorithm. The white spaces represent the non-significant associations (q>0.05). (B) Summary of the gut mycobiome-related bacterial KOs (n=1009, baseline). The top three bar plots show the number of gut mycobiome-related bacterial KOs enriched in the KEGG pathway, module (reaction) and brite (functional hierarchies), respectively. The bottom bar plot shows the number of bacterial KOs related to the specific fungal genus. Detailed statistics about the associations between specific gut fungi and bacterial KOs are listed in online supplemental table S11. The q values were calculated using the Benjamini-Hochberg method. ABC transporter, ATP-binding cassette transporter; KEGG, Kyoto Encyclopaedia of Genes and Genomes; KO, KEGG orthologue; TCA cycle, tricarboxylic acid cycle.
Figure 4
Figure 4
Gut mycobiomic associations with faecal metabolome. (A) the significant (q<0.05) associations between gut fungi and faecal metabolites (n=913, baseline; orange, positive; blue, negative). (B) Proportion of variation in gut mycobiome explained by the faecal metabolites (PERMANOVA, q<0.2). The colours of dots indicate the different classes of the metabolites. The q values were calculated using the Benjamini-Hochberg method.
Figure 5
Figure 5
Associations between gut mycobiome and metabolic traits. (A) Heatmap of cross-sectional associations between gut fungi abundance and presence (left: continuous variable, right: binary variable) and metabolic traits. Linear regression models were adjusted by age and gender. The total number of participants in each analysis was 1211 for HDL cholesterol, LDL cholesterol, triglycerides, TC and TC:HDL, 1244 for BMI, 1210 for fasting glucose, 1212 for HbA1c and HOMA-IR, 1016 for insulin and 1235 for waist circumference. Triglycerides, fasting glucose, TC:HDL and insulin were log-transformed. The bold square represents the significant associations replicated. (B) Forest plot shows the interaction of gut fungi with bacterial Shannon index on HOMA-IR. Associations were expressed as the difference in metabolic traits (in SD unit) per 1 SD of bacterial richness. Linear regression models were adjusted for age and gender. Insulin was log-transformed. Associations were stratified by the presence of gut fungi. The error bars represent CIs. (C) Hypothesised potential mechanisms linking the gut fungi, bacteria and insulin sensitivity. Based on the various associations in the present study, we showed that the presence of Saccharomycetales spp may increase the abundance of SCFA-producing bacteria, sush as Clostridium sensu stricto 1, Faecalitalea and Megamonas, which leads to the production of more SCFAs (acetic acid and butyric acid) in human gut. These changes may lead to the improvement of insulin sensitivity. This figure was created with BioRender.com. HbA1c, glycated haemoglobin; HDL, high-density lipoprotein; HOMA-IR, homeostatic model assessment of insulin resistance; LDL, low-density lipoprotein; SCFA, short-chain fatty acid; TC:HDL, total cholesterol:high-density lipoprotein cholesterol ratio.
Figure 6
Figure 6
Mediation linkages among the gut mycobiome, KEGG orthology and metabolic traits. pIDE and pinv-IDE were estimated by the bidirectional mediation analysis. The metabolic traits were the longitudinal change between the baseline and follow-up visits, while the gut mycobiome and bacterial gene were from the baseline (n=284). The red arrowed lines indicate the gut fungal effects on the changes of phenotype mediated by bacterial gene function with corresponding mediation pIDE. Inverse mediation was performed to check whether gut bacterial gene function can influence the human phenotype through gut mycobiome. The percentage number in the centre of each figure are effect ratios reflecting the proportion of the total effect of the independent variable on the dependent variable that is explained by the mediator, that is, 28%. The figure was created with BioRender.com. IDE, indirect effect; inv-IDE, inverse indirect effect; LDL-C, low-density lipoprotein cholesterol.

References

    1. James TY, Kauff F, Schoch CL, et al. . Reconstructing the early evolution of fungi using a six-gene phylogeny. Nature 2006;443:818–22. 10.1038/nature05110 - DOI - PubMed
    1. Blackwell M, Evolution BM. Evolution. Terrestrial life--fungal from the start? Science 2000;289:1884–5. 10.1126/science.289.5486.1884 - DOI - PubMed
    1. Zheng J-S, Wahlqvist ML. Regulobiosis: a regulatory and food system-sensitive role for fungal symbionts in human evolution and ecobiology. Asia Pac J Clin Nutr 2020;29:9–15. 10.6133/apjcn.202003_29(1).0002 - DOI - PubMed
    1. Wahlqvist ML. Ecosystem dependence of healthy localities, food and people. Annals of Nutrition and Metabolism 2016;69:75–8. 10.1159/000449143 - DOI - PubMed
    1. Mukherjee PK, Sendid B, Hoarau G, et al. . Mycobiota in gastrointestinal diseases. Nat Rev Gastroenterol Hepatol 2015;12:77–87. 10.1038/nrgastro.2014.188 - DOI - PubMed

Publication types