. 2022 Feb 22;9(1):ENEURO.0405-21.2022.
doi: 10.1523/ENEURO.0405-21.2022. Print 2022 Jan-Feb.

Oxytocin Facilitates Allomaternal Behavior under Stress in Laboratory Mice

Affiliations

Oxytocin Facilitates Allomaternal Behavior under Stress in Laboratory Mice

Yousuke Tsuneoka et al. eNeuro. .

Abstract

Oxytocin (Oxt) controls reproductive physiology and various kinds of social behaviors, but the exact contribution of Oxt to different components of parental care still needs to be determined. Here, we illustrate the neuroanatomical relations of the parental nurturing-induced neuronal activation with magnocellular Oxt neurons and fibers in the medial preoptic area (MPOA), the brain region critical for parental and alloparental behaviors. We used genetically-targeted mouse lines for Oxt, Oxt receptor (Oxtr), vasopressin receptor 1a (Avpr1a), vasopressin receptor 1b (Avpr1b), and thyrotropin-releasing hormone (Trh) to systematically examine the role of Oxt-related signaling in pup-directed behaviors. The Oxtr-Avpr1a-Avpr1b triple knock-out (TKO), and Oxt-Trh-Avpr1a-Avpr1b quadruple KO (QKO) mice were grossly healthy and fertile, except for their complete deficiency in milk ejection and modest deficiency in parturition secondary to maternal loss of the Oxt or Oxtr gene. In our minimal stress conditions, pup-directed behaviors in TKO and QKO mothers and fathers, virgin females and males were essentially indistinguishable from those of their littermates with other genotypes. However, Oxtr KO virgin females did show decreased pup retrieval in the pup-exposure assay performed right after restraint stress. This stress vulnerability in the Oxtr KO was abolished by the additional Avpr1b KO. The general stress sensitivity, as measured by plasma cortisol elevation after restraint stress or by the behavioral performance in the open field (OF) and elevated plus maze (EPM), were not altered in the Oxtr KO but were reduced in the Avpr1b KO females, indicating that the balance of neurohypophysial hormones affects the outcome of pup-directed behaviors.

Keywords: Mus musculus; maternal behavior; medial preoptic area; oxytocin; vasopressin.


Figures

Figure 1.
Figure 1.
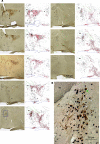
Sagittal view of anatomic distribution of Oxt neurons, fibers, and parenting-induced c-Fos expression. Distribution of NPI (brown)-ir and c-Fos (black)-ir cell in and around of MPOA of virgin females after pup exposure (parasagittal section). A, left and right panels, Representative photographs and their diagrammatic drawings, respectively. These sections were stained by IHC. Black squares and plus (+) symbols, respectively, represent strongly and weakly expressed c-Fos-ir neurons without NPI-ir. Filled and open red circles, respectively, represent strongly and weakly NPI-ir cell bodies without c-Fos signals. Green squares, respectively, represent NPI-ir cell bodies with c-Fos-ir. Red lines represent NPI-ir fibers. Numbers 1–4 show the areas relatively devoid of c-Fos-ir, NPI-ir neurons, and fibers. Arrows indicate Oxt-ir thick dendrites with a corkscrew-like morphology and irregular varicosities. ac, anterior commissure. Panels are arranged in the medial–lateral order, from the left top to left bottom, and the right top to right bottom. B, High-magnification image of the blue squared region in A, containing the AC. The circle-headed arrow indicates double-labeled cells of NPI and c-Fos. White arrowheads indicate single-labeled cells of c-Fos, black arrowheads indicate single-labeled cells of NPI, and small arrows indicate NPI-ir fibers.
Figure 2.
Figure 2.
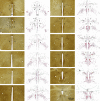
Horizontal view of anatomic distribution of Oxt neurons, fibers, and parenting-induced c-Fos expression. Distribution of NPI (brown)-ir and c-Fos (black)-ir cell in and around of MPOA of virgin females after pup exposure (horizontal section). Left and right panels show representative photographs and their diagrammatic drawings, respectively. These sections were stained by IHC. Black squares and plus symbols, respectively, represent strongly and weakly expressed c-Fos-ir neurons. Filled and open red circles, respectively, represent NPI-ir cell bodies with or without c-Fos signals. Red lines represent NPI-ir fibers. Numbers 1–4 show the areas relatively devoid of c-Fos-ir, NPI-ir neurons, and fibers. 3V, 3rd ventricle; ac, anterior commissure. All panels are arranged in ventral–dorsal order from the left, top to bottom, and then the right, top to bottom.
Figure 3.
Figure 3.
Parental behavior, fertility, and abnormal delivery of the Trh-Oxt double knock-out (DKO) mice. A, Responses to pup exposure in virgin females. B, Fertility ratio of the females after mating. C, Proportion of abnormal deliveries (prolonged for >24 h, and/or maternal distress with remaining pups in uterus, which sometimes caused maternal death in labor). “Abnormal (died)” means maternal death by PPD3, and “abnormal (euthanized)” means maternal health deterioration necessitating euthanasia by PPD3. D, The scores for nest quality, indicated by the use of nest material and nest shape (see Materials and Methods) at PPD 0. E, The placentophagia score (1, all the live pups were cleaned for amniotic membrane, umbilical cord, and placenta; 0.5, partially; 0, none of the pups were cleaned) at PPD 0. F, The spontaneous pup grouping score (1, all the live pups were grouped in the nest; 0.5, the live pups were in the nest except one; 0, all the live pups were outside of the nest.) at PPD 0. G, The pup survival rate (number of live pups at PPD 1 divided by the number of live pups at PPD 0 morning) of each mother. H, Schematic of the experimental timeline and responses to pup exposure in mothers. Only four of them (Oxt+/+-Trh+/−: 1, Oxt−/−-Trh+/−: 2, Oxt−/−Trh−/−: 1) had experienced the pup-exposure assay as a virgin, whose results are included in A. I, Responses to pup exposure in virgin males. J, Responses to pup exposure in males, which were separated from their female mates immediately after copulation. Copulation was assessed by vaginal plugs in females. Only males whose mates were later confirmed as pregnant are shown. K, Fertility ratios of the males after mating (7 d of cohabitation with females). L, Responses to pup exposure in males, which were separated from their female mates after 7 d of cohabitation. For D–H, data from only mothers who had normal delivery are shown. For J–L, data from only males who exhibited infanticide as a virgin are shown. (+/*) means wild-type (+/+) or heterozygous KO (+/−), and (−/−) means homozygous KO for the designated genetic locus. A black vertical bar in schematic of the experimental timelines indicates the day a pup-exposure assay was performed. Error bars represent the mean ± SEM. Different letters denote significant differences (multiple comparisons by Fisher’s exact test for categorical data, and Welch’s t test for continuous data), p <0.05. Numbers of animals used are described in the figure.
Figure 4.
Figure 4.
Pup-directed behaviors of the virgin and postpartum Oxt-Trh-Avpr1a-Avpr1b quadruple knock-out (QKO) female mice in the standard pup-exposure assay. A, Schematic of the experimental timeline. “Posti-solation (PI)”: the mothers tested 13 d after the isolation from pups at PPD1. A black vertical bar indicates the day a pup-exposure assay was performed. B, Gross pup-directed behaviors in each genotype, with the number of mice for each behavioral category in each genotype. C–G, Details of pup-directed behaviors compared between quadruple (−/−) versus all other genotypes (others; C); heterozygous (+/−) versus homozygous KO (−/−) for Avpr1b (D), Avpr1a (E), Trh (F), and Oxt (G), regardless of other genetic loci. The left three variables on the abscissae are latencies, the right three variables are proportions of the time bins in which the indicated behaviors were performed. Error bars represent the mean ± SEM. Fisher’s exact test for categorical data; Welch’s t test for continuous data; **p <0.01, *p <0.05. Numbers of animals used are described in the figure.
Figure 5.
Figure 5.
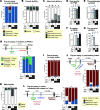
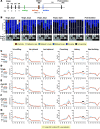
Pup-directed behaviors of the virgin and postpartum Oxtr-Avpr1a-Avpr1b triple knock-out (TKO) female mice. A, Schematic of the experimental timeline. “Post-isolation (PI)”: the mothers tested 13 d after the isolation from pups at PPD1. A black vertical bar indicates the day a pup-exposure assay was performed. B, Gross pup-directed behaviors in each genotype, with the number of mice for each behavioral category in each genotype. C–G, Details of pup-directed behaviors compared between triple (−/−) versus all other genotypes (others; C); triple (−/−) versus Oxtr+/−; Avpr1a+/−; Avpr1b+/− [triple (+/−); D], Avpr1b (E), Avpr1a (F), and Oxtr (G), regardless of other genetic loci. The left three variables on the abscissae are latencies, the right three variables are proportions of the time bins in which the indicated behaviors were performed. Error bars represent the mean ± SEM. Fisher’s exact test for categorical data; Welch’s t test for continuous data; ***p <0.001, **p <0.01, *p <0.05. Numbers of animals used are described in the figure.
Figure 6.
Figure 6.
Oxt (NPI) and AVP expressions in the MPOA were not affected by Oxtr or Avpr genetic targeting. Distribution of NPI and AVP (black)-ir cells in the MPOA of Avpr1a-Oxtr-Avpr1b triple mutant (TKO) female mice; triple (+/−) mean Avpr1a+/−; Oxtr+/−; Avpr1b+/−, triple (−/−) mean Avpr1a−/−; Oxtr−/−; Avpr1b−/− TKO virgin female mice. A, The sections were stained by IHC. AC (B, E), SO (C, F), and PVH (D, G was identified by counterstain using NeuN). All panels are arranged in anterior–posterior order. B–G, High-magnification images of same-colored squares. H–K, The numbers of NPI-ir neurons in the AC (H), SO (I), and PVH (J) and of Avp-ir neurons in the PVH (K) of triple (+/−; N = 4) and (−/−; N = 4) virgin females. Error bars represent the mean ± SEM.
Figure 7.
Figure 7.
Responses to pups in the standard pup-exposure assay with the virgin and copulated Oxtr-Avpr1a-Avpr1b triple knock-out (TKO) male mice. A, Schematics of the experimental timeline. A black vertical bar indicates the day a pup-exposure assay was performed. B–F, Gross pup-directed behaviors in each genotype, with the number of mice for each behavioral category in each genotype. Oxtr−/−; Avpr1a−/−; Avpr1b−/− [triple (−/−)] versus all other genotypes (others; B); triple (−/−) versus Oxtr+/−; Avpr1a+/−; Avpr1b+/− [triple (+/−); C]; heterozygous (+/−) versus homozygous (−/−) KO for each four genetic loci for Avpr1b (D), Avpr1a (E), and Oxtr (F), regardless of other genetic loci. Blue asterisk: Fisher’s exact test between parental (pups retrieved) versus nonparental (infanticide or no pup retrieved); red asterisk: Fisher’s exact test between infanticidal versus noninfanticidal; *p <0.05.
Figure 8.
Figure 8.
Confirmation of the results with HIR strain of Oxtr-Avpr1a-Avpr1b triple knock-out (TKO) mice. A, B, Responses to pups, schematics of the experimental timeline, latencies, and proportion of time of pup-directed behaviors in the standard pup-exposure assay in virgin (A) and postpartum (B) females. The variables in the second rows are latencies, the variables in the third rows are proportion of time bins performed the indicated behavior. C, D, Responses to pups and schematic of the experimental timeline of pup-directed behaviors in the standard pup-exposure assay in virgin males (C) and father mice (D). A black vertical bar in schematic of the experimental timelines indicates the day a pup-exposure assay was performed. Error bars represent the mean ± SEM. Fisher’s exact test for categorical data; Welch’s t test for continuous data; **p <0.01, *p <0.05. Numbers of animals used are described in the figure.
Figure 9.
Figure 9.
Effect of restraint stress on the pup-directed behaviors of the virgin and postpartum Oxtr-Avpr1a-Avpr1b triple knock-out (TKO) female mice. A, Gross pup-directed behaviors in each genotype, with the number of mice for each behavioral category in each genotype. Blue asterisk: Fisher’s exact test between parental (pups retrieved) versus non-parental (infanticide or no pup retrieved), *p <0.05. B–D, Details of pup-directed behaviors compared between heterozygous (+/−) versus homozygous KO (−/−) for Avpr1b (B), Avpr1a (C), and for Oxtr (D), disregarding other genetic loci. The left two variables are latencies, the right two variables are proportion of time bins performed the indicated behavior. Welch’s t test for continuous data; *p <0.05. E, Total amount of pup retrieval behavior, measured by the total time the three pups spent in the nest. Different letters denote significant differences (multiple comparisons by Welch’s t test, p <0.05). See also the Extended Data Figure 9-1 for the results of Kruskal–Wallis rank-sum tests with post hoc multiple comparisons by Nemenyi test. Error bars represent the mean ± SEM.
Figure 10.
Figure 10.
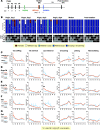
Stress sensitivity of the virgin Oxtr-Avpr1a-Avpr1b triple knock-out (TKO) female and male mice. Behavioral characteristics in the open field (OF) test (A, D) and elevated plus maze (EPM) (B, E), and effect of restraint stress on plasma CORT level (C, F). (+/−) means heterozygous, (−/−) means homozygous, and * means (+/−) or (−/−) KO for the designated genetic locus. Error bars represent the mean ± SEM. Welch’s t test, *p <0.05. Numbers of animals used are described in the figure.

Similar articles

Cited by

References

    1. Acampora D, Postiglione MP, Avantaggiato V, Di Bonito M, Vaccarino FM, Michaud J, Simeone A (1999) Progressive impairment of developing neuroendocrine cell lineages in the hypothalamus of mice lacking the Orthopedia gene. Genes Dev 13:2787–2800. 10.1101/gad.13.21.2787 - DOI - PMC - PubMed
    1. Armstrong WE, Warach S, Hatton GI, McNeill TH (1980) Subnuclei in the rat hypothalamic paraventricular nucleus: a cytoarchitectural, horseradish peroxidase and immunocytochemical analysis. Neuroscience 5:1931–1958. 10.1016/0306-4522(80)90040-8 - DOI - PubMed
    1. Bayer SA, Altman J (2004) Development of the telencephalon: neural stem cells, neurogenesis, and neuronal migration. In: The rat nervous system, Ed 3 (Paxinos G, ed), pp 27–73. San Diego: Elsevier.
    1. Bosch OJ, Neumann ID (2008) Brain vasopressin is an important regulator of maternal behavior independent of dams' trait anxiety. Proc Natl Acad Sci USA 105:17139–17144. 10.1073/pnas.0807412105 - DOI - PMC - PubMed
    1. Brunton PJ, Russell JA (2008) Keeping oxytocin neurons under control during stress in pregnancy. Prog Brain Res 170:365–377. 10.1016/S0079-6123(08)00430-5 - DOI - PubMed

Publication types

LinkOut - more resources