. 2022 Jan 11;13(1):217.
doi: 10.1038/s41467-021-27853-w.

A BAFF ligand-based CAR-T cell targeting three receptors and multiple B cell cancers

Affiliations

A BAFF ligand-based CAR-T cell targeting three receptors and multiple B cell cancers

Derek P Wong et al. Nat Commun. .

Abstract

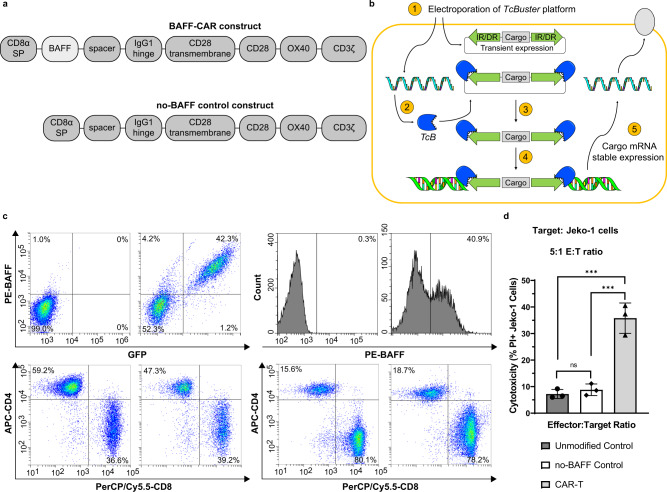
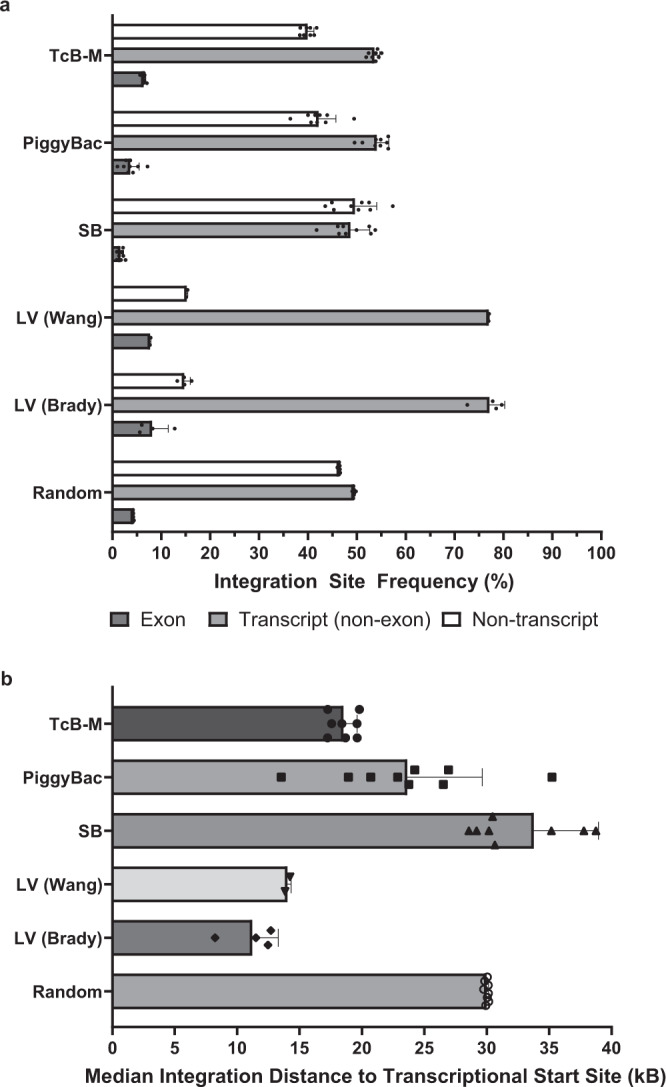
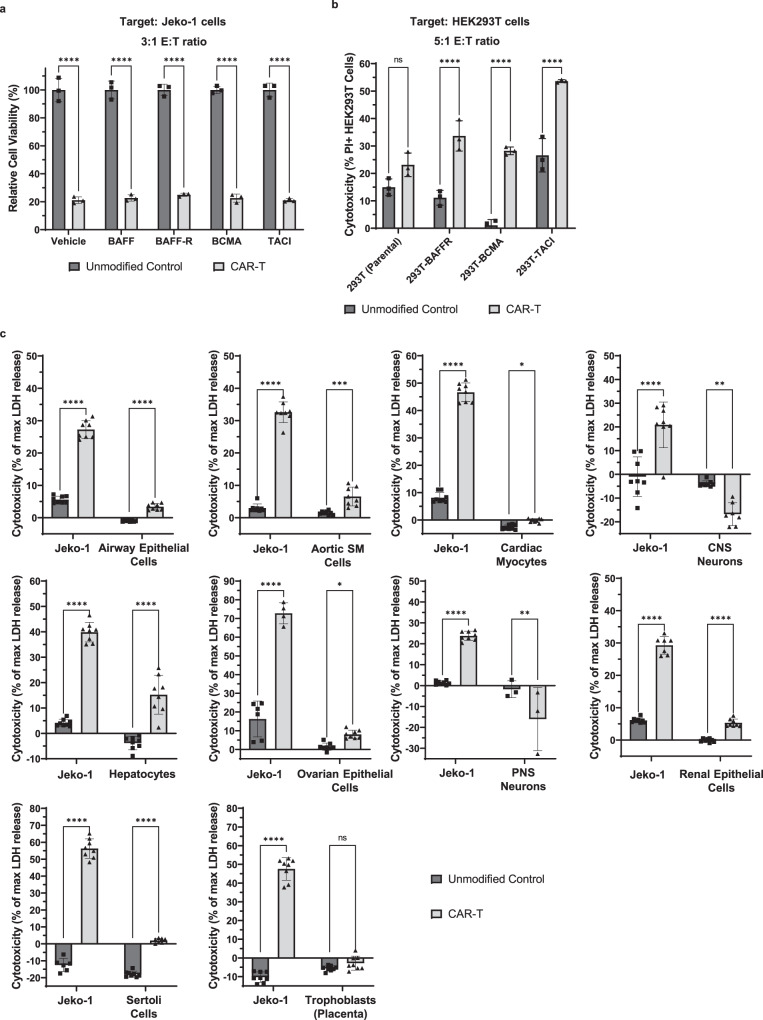
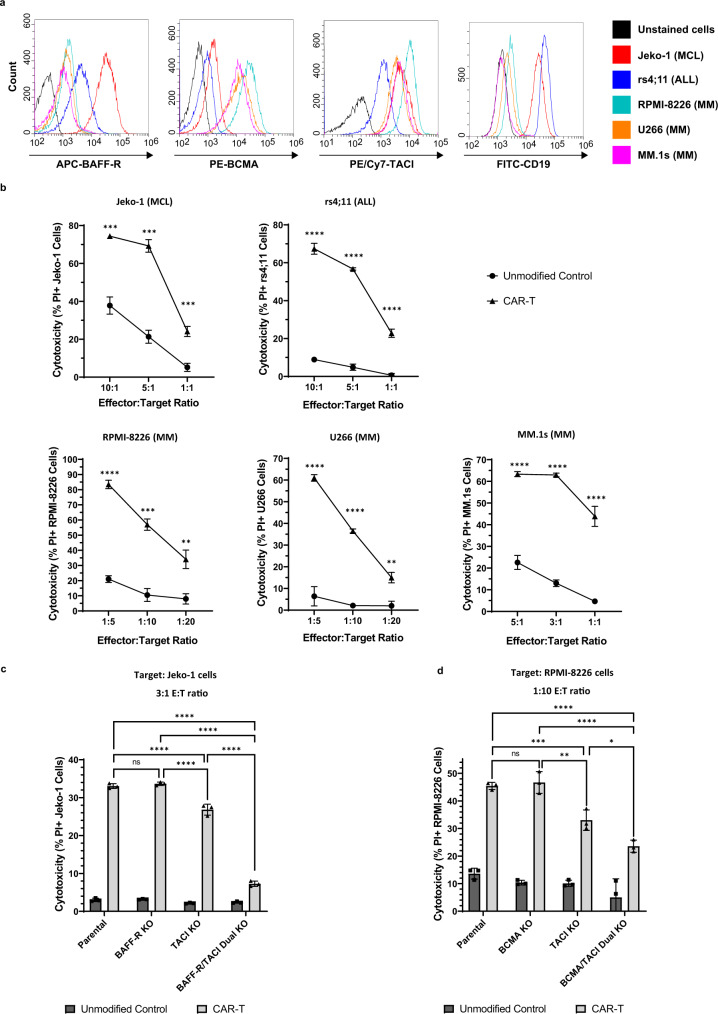
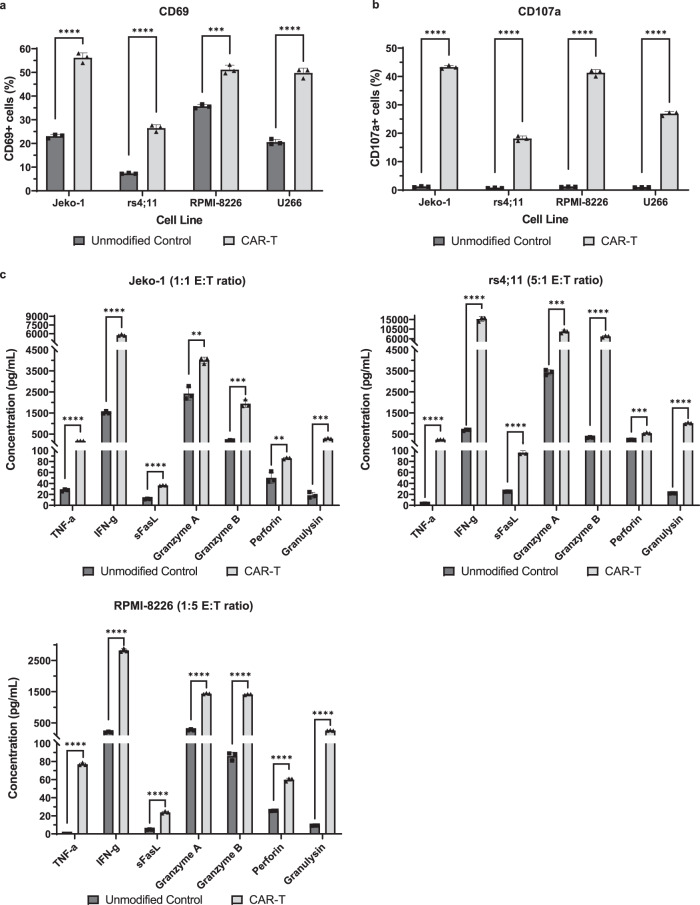
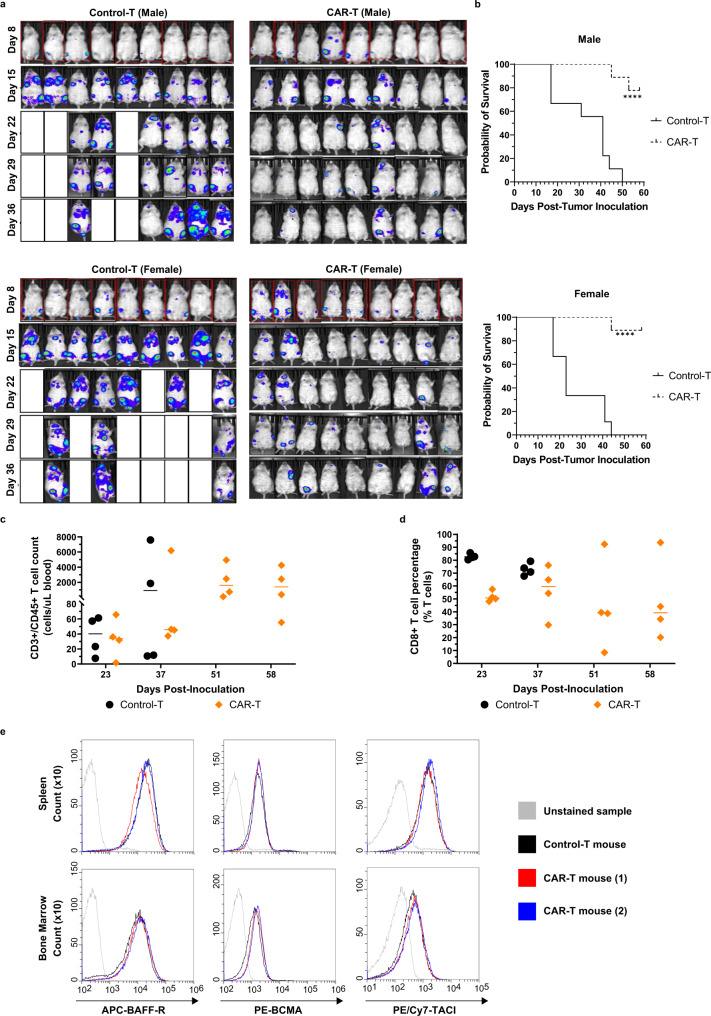
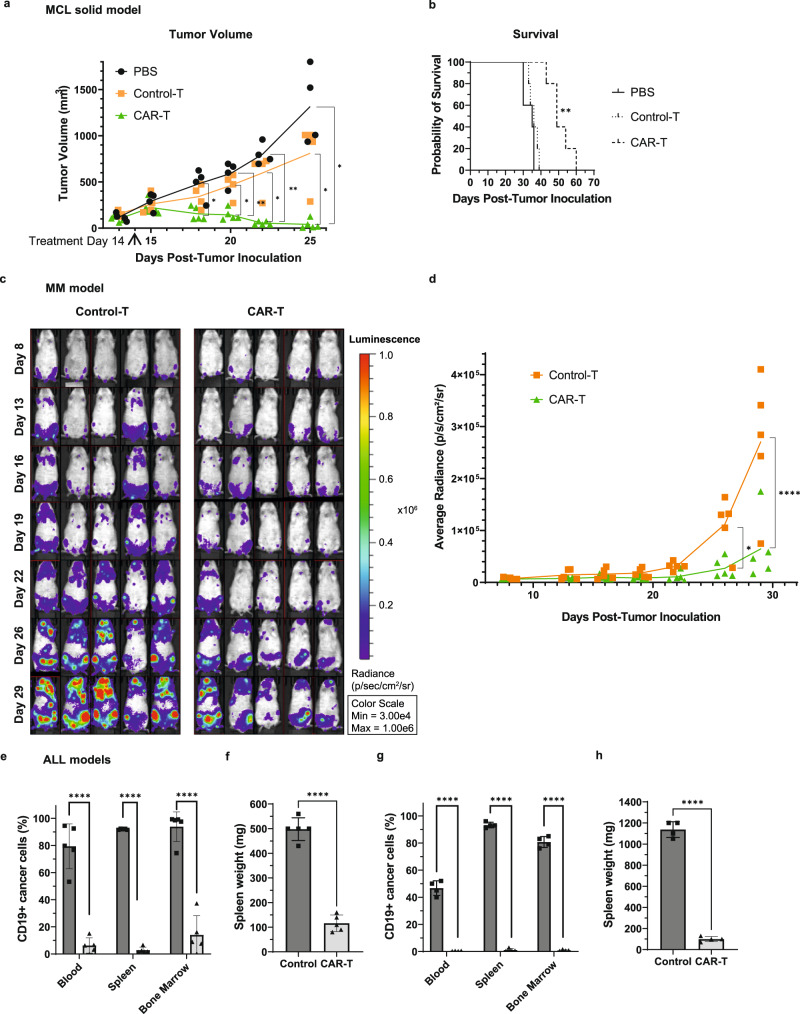
B cell-activating factor (BAFF) binds the three receptors BAFF-R, BCMA, and TACI, predominantly expressed on mature B cells. Almost all B cell cancers are reported to express at least one of these receptors. Here we develop a BAFF ligand-based chimeric antigen receptor (CAR) and generate BAFF CAR-T cells using a non-viral gene delivery method. We show that BAFF CAR-T cells bind specifically to each of the three BAFF receptors and are effective at killing multiple B cell cancers, including mantle cell lymphoma (MCL), multiple myeloma (MM), and acute lymphoblastic leukemia (ALL), in vitro and in vivo using different xenograft models. Co-culture of BAFF CAR-T cells with these tumor cells results in induction of activation marker CD69, degranulation marker CD107a, and multiple proinflammatory cytokines. In summary, we report a ligand-based BAFF CAR-T capable of binding three different receptors, minimizing the potential for antigen escape in the treatment of B cell cancers.


Conflict of interest statement

N.S. and S.D. are employees of Luminary Therapeutics. R.P. is a consultant for Luminary therapeutics. B.J.J. is an employee at Bio-Techne. B.R.W. and B.S.M. are consultants for Bio-Techne and are shareholders of Luminary Therapeutics. P.C. is a member of advisory board of ADC therapeutics and have received honoraria from kite pharma. The remaining authors declare no competing interests.

Figures

Fig. 1
Fig. 1. CAR-T cells were produced using the BAFF-CAR construct via different expression methodologies.
a Schematic of the BAFF-CAR construct, which consists of extracellular BAFF ligand, short spacer, hinge from human IgG1, CD28 transmembrane and signaling domains, OX40, and CD3ζ. A construct lacking extracellular BAFF (no-BAFF) was used as a negative control. b Schematic of the non-viral TcBuster (TcB) transposon system, which enables stable expression of a CAR protein. 1. TcB transposase mRNA and transposon plasmid are introduced into the cell. 2. Protein from TcB mRNA is produced. 3. Transposase cuts the cargo from the transposon plasmid. 4. TcB transposase pastes the transposon cargo into the genomic DNA. 5. Cargo mRNA is stably expressed from genomic DNA. c The BAFF-CAR construct was expressed in primary human T cells via either lentiviral transduction or the TcB transposase system. 5 days after lentiviral transduction, efficiency of transduction was measured based on % GFP expression and correlated exogenous surface expression of BAFF. Efficiency of TcB transposase-mediated expression was measured based solely on % exogenous BAFF expression. CD4+ and CD8+ T cell percentages were also measured. The experiment was repeated with four different T cell donors. d CAR-T cells, no-BAFF control T cells, or unmodified T cells were co-cultured with fluorescently-labeled Jeko-1 MCL cells at 5:1 effector:target (E:T) ratio for 16 h, followed by flow cytometry. Cytotoxicity was measured via propidium iodide (PI) staining and gating on labeled target cells. ns not significant, ***P < 0.001. P = 0.0002 for Unmodified Control vs CAR-T, P = 0.0003 for no-BAFF Control vs CAR-T. Graphs display mean ± SD, n = 3 biologically independent co-cultures, one-way ANOVA with Tukey’s multiple comparisons test. The experiment was repeated with two different T cell donors. Source data are provided as a Source Data file.
Fig. 2
Fig. 2. Integration site analysis reveals reduced transcript integration with TcB.
a Analysis of the frequency of integration events in exon-coding transcript sites, non-exon-coding transcript sites, and non-transcript sites. Samples were collected from primary human T cells transfected with TcBuster (TcB) or historical data sets generated by Wang et al., Brady et al., and Gogol-Döring et al.. Random in silico control sets were also generated and analyzed. SB Sleeping Beauty, LV lentiviral dataset. Graph displays mean ± SD, biologically independent samples. n = 8 for TcB-M, n = 9 for SB, n = 9 for PiggyBac, n = 2 for LV (Wang), n = 4 for LV (Brady), n = 8 for Random. b Median distance measured between transposon integration sites and the transcriptional start site of the nearest gene is presented for transposon and lentiviral integration. SB Sleeping Beauty, LV lentiviral dataset. Graph displays mean ± SD, biologically independent samples. n = 8 for TcB-M, n = 9 for SB, n = 9 for PiggyBac, n = 2 for LV (Wang), n = 4 for LV (Brady), n = 8 for Random. Source data for all graphs are provided as a Source Data file. Sequencing data used to perform integration site analysis are available online (Accession ID: PRJNA779430).
Fig. 3
Fig. 3. BAFF CAR-T cells were characterized and experimentally validated for function and specificity.
a CAR-T cells or unmodified T cells were co-cultured with luciferase-expressing Jeko-1 cells at 3:1 E:T ratio for 24 h with soluble recombinant BAFF/BAFF receptors (sBAFF = 1 ng/mL; sBAFF-R = 500 ng/mL; sBCMA = 2.5 ng/mL; TACI = 20 pg/mL). Vehicle served as a negative control. Luminescence was measured using a plate reader. Viability was calculated using target-only control, then normalized relative to average luminescence from target cells co-cultured with unmodified T cells. ****P < 0.0001. Mean ± SD, n = 3 biologically independent co-cultures, two-way ANOVA with Šídák’s multiple comparison test. The experiment was repeated with three different T cell donors. b CAR-T cells or unmodified T cells were co-cultured with HEK293T cells expressing BAFF-R, BCMA, or TACI at 5:1 E:T ratio for 16 h. Cytotoxicity was measured via PI staining and gating on labeled target cells. ns not significant, ****P < 0.0001. Mean ± SD, n = 3 biologically independent co-cultures, two-way ANOVA with Šídák’s multiple comparisons test. The experiment was repeated with two different T cell donors. c BAFF CAR-T cells or unmodified T cells were co-cultured with different types of primary human cells at 1:1 E:T ratio for 24 h to evaluate the potential for adverse toxicity. Lactate dehydrogenase (LDH) release upon target cell lysis was measured, then compared with LDH release in lysis controls (0.8% Triton X-100) to calculate cytotoxicity. Percent cytotoxicity = [Experimental LDH release – Effector (spontaneous LDH release) – Target (spontaneous LDH release)]/[Target (maximum LDH release) – Target (spontaneous LDH release)] × 100. CNS central nervous system, PNS peripheral nervous system. ns not significant, *P < 0.05, **P < 0.01, ***P < 0.001, ****P < 0.0001. The following p-values correspond to Unmodified Control vs CAR-T: P < 0.0001 for airway epithelial cells, P = 0.0003 for aortic smooth muscle cells, P = 0.0377 for cardiac myocytes, P = 0.0027 for CNS neurons, P < 0.0001 for hepatocytes, P = 0.0401 for ovarian surface epithelial cells, P = 0.0094 for PNS neurons, P < 0.0001 for renal epithelial cells, P < 0.0001 for Sertoli cells, P = not significant for trophoblasts. Mean ± SD, n = 8 biologically independent co-cultures, two-way ANOVA with Šídák’s multiple comparisons test. The experiment was repeated with two different T cell donors. Source data for all graphs are provided as a Source Data file.
Fig. 4
Fig. 4. BAFF CAR-T cells display significant in vitro cytotoxicity towards MCL, ALL, and MM cells.
a Cell lines of different B cell malignancies were stained for BAFF-R, BCMA, TACI, and CD19 expression. Red = Jeko-1 (MCL); blue = rs4;11 (ALL); cyan = RPMI-8226 (MM); orange = U266 (MM); purple = MM.1s (MM); black = unstained cells. b CAR-T cells or unmodified T cells were co-cultured with fluorescently-labeled cancer cells at indicated E:T ratios for 16 h (Jeko-1, rs4;11, MM.1s) or 40 h (RPMI-8226, U266). Cytotoxicity was measured via PI staining and gating on labeled target cells. Circle = Unmodified Control, triangle = CAR-T. **P < 0.01, ***P < 0.001, ****P < 0.0001. Jeko-1: P = 3.34e-4 (10:1), P = 1.92e-4 (5:1), P = 6.72e-4 (1:1). rs4;11: P = 9e-6 (10:1), P = 3e-6 (5:1), P = 8.8e-5 (1:1). RPMI-8226: P = 2.1e-5 (1:5), P = 2.85e-4 (1:10), P = 2.919e-3 (1:20). U266: P = 7.2e-5 (1:5), P = 3e-6 (1:10), P = 2.179e-3 (1:20). MM.1s: P = 6.6e-5 (5:1), P = 3e-6 (3:1), P = 1.29e-4 (1:1). Mean ± SD, n = 3 biologically independent co-cultures, multiple unpaired two-tailed t-tests with Holm-Šídák correction for multiple comparisons. c CRISPR was used to knock out expression of either BAFF-R, TACI, or both BAFF-R and TACI in Jeko-1 cells. Fluorescently-labeled cancer cells were co-cultured with BAFF CAR-T cells or unmodified T cells 16 h at 3:1 E:T ratio. Parental Jeko-1 cells served as negative control. Cytotoxicity was measured as above. ns not significant, ****P < 0.0001. Mean ± SD, n = 3 biologically independent co-cultures, two-way ANOVA with Tukey’s multiple comparisons test. d CRISPR was used to knock out expression of either BCMA, TACI, or both BCMA and TACI in RPMI-8226 cells. Fluorescently-labeled cancer cells were co-cultured with BAFF CAR-T cells or unmodified T cells 36 h at 1:10 E:T ratio. Parental RPMI-8226 cells served as negative control. Cytotoxicity was measured as above. ns not significant, *P < 0.05, **P < 0.01, ***P < 0.001, ****P < 0.0001. P = 0.0015 (Parental vs TACI KO), P < 0.0001 (Parental vs BCMA/TACI Dual KO), P = 0.0006 (BCMA KO vs TACI KO), P < 0.0001 (BCMA KO vs BCMA/TACI Dual KO), P = 0.0137 (TACI KO vs BCMA/TACI Dual KO). Mean ± SD, n = 3 biologically independent co-cultures, two-way ANOVA with Tukey’s multiple comparisons test. Source data for all graphs are provided as a Source Data file. All cytotoxicity experiments were repeated with two different T cell donors.
Fig. 5
Fig. 5. BAFF CAR-T cell activation, degranulation, and cytokine release are stimulated by different B cell cancers.
a T cells were co-cultured with labeled Jeko-1 or rs4;11 cells at 5:1 E:T ratio for 24 h, RPMI-8226 cells at 1:5 E:T ratio for 5 h, or U266 cells at 5:1 E:T ratio for 5 h, then stained for the activation marker CD69. % CD69+ T cells were measured via flow cytometry after gating on live cells and excluding labeled cancer cells; for CAR-T samples, additional gating over GFP+ cells was applied to exclude unmodified cells. ***P < 0.001, ****P < 0.0001. Mean±SD, n = 3 biologically independent co-cultures, unpaired two-tailed t-test for each cell line. Experiment was repeated with 2 different T cell donors. b T cells were co-cultured with Jeko-1, rs4;11, RPMI-8226, or U266 cells at 5:1 E:T ratio for 6 h while staining for the degranulation marker CD107a. % CD107a+ T cells were measured via flow cytometry after gating on CD3+ cells; for CAR-T samples, additional gating over GFP+ cells was applied to exclude unmodified cells. ****P < 0.0001. Mean±SD, n = 3 biologically independent co-cultures, unpaired two-tailed t-test for each cell line. Experiment was repeated with two different T cell donors. c T cell and Jeko-1, rs4;11, or RPMI-8226 co-culture supernatant was collected from cytotoxicity assays to measure T cell release of various pro-inflammatory cytokines and lytic enzymes using a multiplex cytokine release assay. **P < 0.01, ***P < 0.001, ****P < 0.0001. For Jeko-1, Unmodified Control vs CAR-T: TNF-α: P = 1e-6; IFN-γ: P = 7e-6; sFasL: P = 3e-6; Granzyme A: P = 2.751e-3; Granzyme B: P = 2.9e-4; Perforin: P = 3.834e-3; Granulysin: P = 2.9e-4. For rs4;11, Unmodified Control vs CAR-T: TNF-α: P = 9e-6; IFN-γ: P = 5.9e-5; sFasL: P = 2.2e-5; Granzyme A: P = 2.19e-4; Granzyme B: P = 2.9e-5; Perforin: P = 2.19e-4; Granulysin: P = 9e-6. For RPMI-8226: TNF-α: P < 1e-6; IFN-γ: P < 1e-6; sFasL: P = 1.1e-5; Granzyme A: P < 1e-6; Granzyme B: P < 1e-6; Perforin: P = 7e-6; Granulysin: P = 7e-6. Mean±SD, n = 3 biologically independent co-culture samples, multiple unpaired two-tailed t-tests with Holm-Šídák correction for multiple comparisons. Experiment was repeated with two different T cell donors. Source data for all graphs are provided as a Source Data file.
Fig. 6
Fig. 6. BAFF CAR-T cells control the progression of cancer cells in an in vivo, intravenous MCL xenograft model.
a NSG mice were injected i.v. via tail vein with 1.5e6 Jeko-1-luc cells on Day 0. On Day 9, 10e6 BAFF CAR-T cells or Control-T cells were injected i.v. Bioluminescence imaging was performed weekly up to Day 36, with the experiment continuing until Day 58. n = 9 mice per treatment group. b Kaplan–Meier survival curves were generated for male and female mice, with Day 58 post-inoculation serving as the endpoint of the experiment. Solid line = Control-T, dashed line = CAR-T. Statistical analyses of survival between different groups were performed using log-rank (Mantel-Cox) tests. ****P < 0.0001 for the pairwise comparison between Control-T and BAFF CAR-T treatment groups, for both male and female mice. c Blood was collected from four random mice per treatment group via tail vein on days 23, 37, 51, and 58 post-tumor inoculation, in order to measure T cell, counts using flow cytometry, anti-hCD3, and anti-hCD45 antibodies, and counting beads. Graph displays individual and mean values. Black = Control-T, orange = CAR-T. d Human CD8+ T cell percentages over time are graphed as individual and mean values on gated T cells. Black = Control-T, orange = CAR-T. e Spleen and bone marrow were collected from relapsed mice at time of euthanasia to assess possibility of antigen loss of BAFF receptors in CAR-T-treated mice. After red blood cell lysis, cells were simultaneously stained for human CD19, BCMA, TACI, and BAFF-R, after which cells were gated on CD19 using flow cytometry. Black = white blood cells from Control-T-treated mice; blue/red = WBCs from two different CAR-T-treated mice with detected Jeko-1 relapse; gray = unstained WBC sample. Source data for all graphs are provided as a Source Data file. The experiment was repeated with two different T cell donors.
Fig. 7
Fig. 7. BAFF CAR-T cells display significant in vivo cytotoxicity against MCL, MM and ALL xenograft models.
a 10e6 Jeko-1 cells were injected into NSG mice subcutaneously Day 0 (D0). After palpable tumor formation, 4e6 CAR-T cells, unmodified Control-T cells, or PBS alone were injected intratumorally D14. Tumor volume (mm3) = (length × width2)/2. Black = PBS, orange = Control-T, green = CAR-T. *P < 0.05, **P < 0.01. D18: P = 0.0467 PBS/CAR-T; D20: P = 0.0068 PBS/CAR-T, P = 0.0246 Control-T/CAR-T; D22: P = 0.0017 PBS/CAR-T, P = 0.0306 Control-T/CAR-T; D25: P = 0.0168 PBS/CAR-T, P = 0.0421 Control-T/CAR-T. Mean ± SD, n = 5 mice, 2-way ANOVA with Tukey correction for multiple comparisons. b Mouse survival post-inoculation. Solid line = PBS, dotted line = Control-T, dashed line = CAR-T. **P < 0.01. P = 0.0054 Control-T/CAR-T and PBS/CAR-T. Log-rank (Mantel-Cox) tests were applied, followed by Holm-Šídák correction for multiple comparisons. c 5e6 MM.1s-luc cells were injected into NSG mice i.v. D0. 2e6 CAR-T or Control-T cells were injected i.v. D8 and D16. Imaging continued until D29 post-inoculation. Luminescence intensity was measured as radiance (photons/s/cm2/sr). d Average radiance is plotted for individual mice, with a line connecting means. Orange = Control-T, green = CAR-T. *P < 0.05, ****P < 0.0001. D26: P = 0.0128; D29: P < 0.0001. n = 5 mice, 2-way ANOVA with Šídák’s correction for multiple comparisons. e 1e6 rs4;11 cells were injected into NSG mice i.v. D0. 1e6 CAR-T cells or PBS alone (Control) were injected i.v. D6. Mice were killed D45 post-inoculation. Percentage rs4;11 cells remaining were determined using flow cytometry and human anti-CD19 staining. ****P < 0.0001. Blood: P = 1.7e-5; Spleen: P < 1e-6; Bone Marrow: P = 1.7e-5. Mean±SD, n = 5 mice, multiple unpaired two-tailed t-tests with Holm-Šídák correction. f Mouse spleen weight from rs4;11 xenograft model after euthanasia. ****P < 0.0001. Mean±SD, n = 5 mice, unpaired two-tailed t-test. g 2e6 Patient ALL (Pt2) cells were injected into NSG mice i.v. D0. 2e6 CAR-T cells or PBS alone (Control) were injected i.v. D6. Mice were killed D31 post-inoculation. Percentage Pt2 cells remaining were determined. ****P < 0.0001. Blood: P = 2e-6; Spleen: P < 1e-6; Bone Marrow: P < 1e-6. Mean±SD, n = 4 mice, multiple unpaired two-tailed t-tests with Holm-Šídák correction. h Mouse spleen weight from Pt2 xenograft model. ****P < 0.0001. Mean±SD, n = 4 mice, unpaired two-tailed t-test. Source data for all graphs are provided as a Source Data file. Experiments were repeated with two different T cell donors.

References

    1. Brudno JN, Kochenderfer JN. Chimeric antigen receptor T-cell therapies for lymphoma. Nat. Rev. Clin. Oncol. 2018;15:31–46. - PubMed
    1. Park JH, et al. Long-term follow-up of CD19 CAR therapy in acute lymphoblastic leukemia. New Engl. J. Med. 2018;378:449–459. - PMC - PubMed
    1. Maude SL, et al. Chimeric antigen receptor T cells for sustained remissions in leukemia. New Engl. J. Med. 2014;371:1507–1517. - PMC - PubMed
    1. Kochenderfer JN, Rosenberg SA. Treating B-cell cancer with T cells expressing anti-CD19 chimeric antigen receptors. Nat. Rev. Clin. Oncol. 2013;10:267–276. - PMC - PubMed
    1. Novak AJ, et al. Expression of BCMA, TACI, and BAFF-R in multiple myeloma: a mechanism for growth and survival. Blood. 2004;103:689–694. - PubMed

Publication types

MeSH terms

Substances