. 2022 Jan 11;13(1):204.
doi: 10.1038/s41467-021-27868-3.

Canonical WNT signaling-dependent gating of MYC requires a noncanonical CTCF function at a distal binding site

Affiliations

Canonical WNT signaling-dependent gating of MYC requires a noncanonical CTCF function at a distal binding site

Ilyas Chachoua et al. Nat Commun. .

Abstract

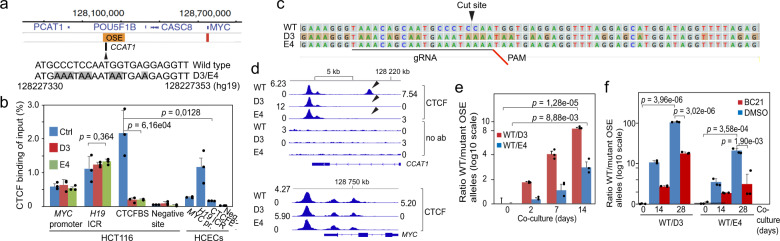
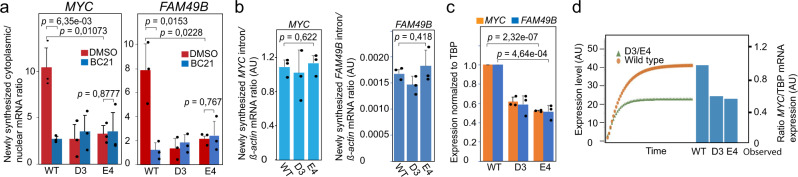
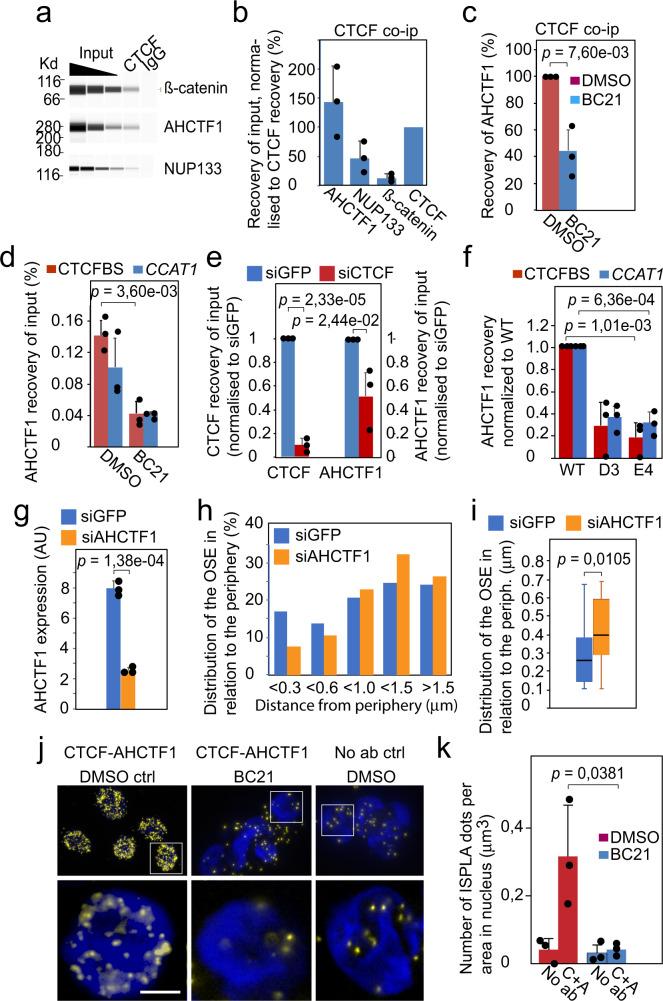
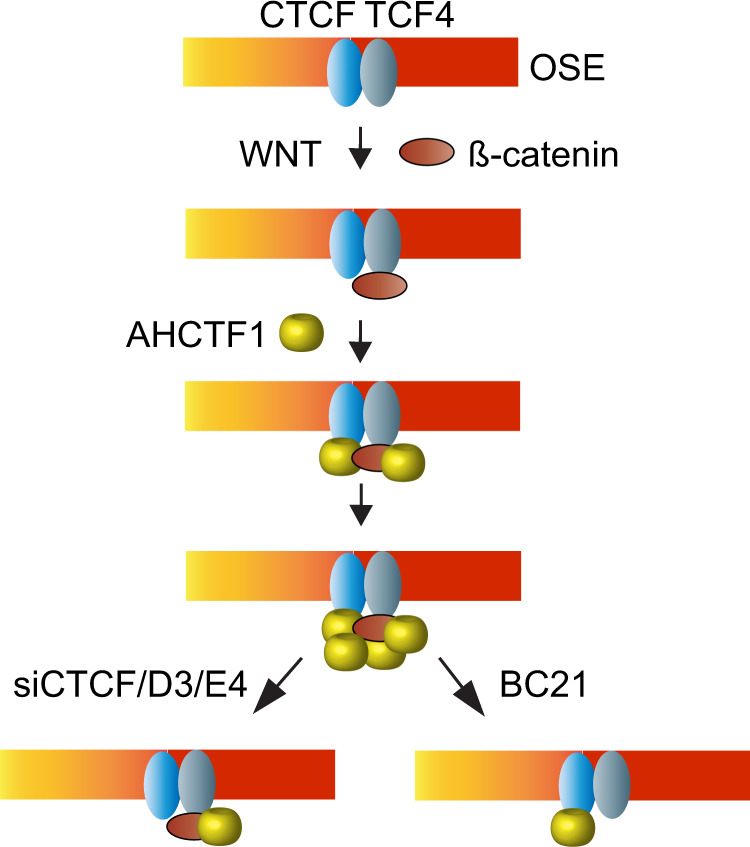
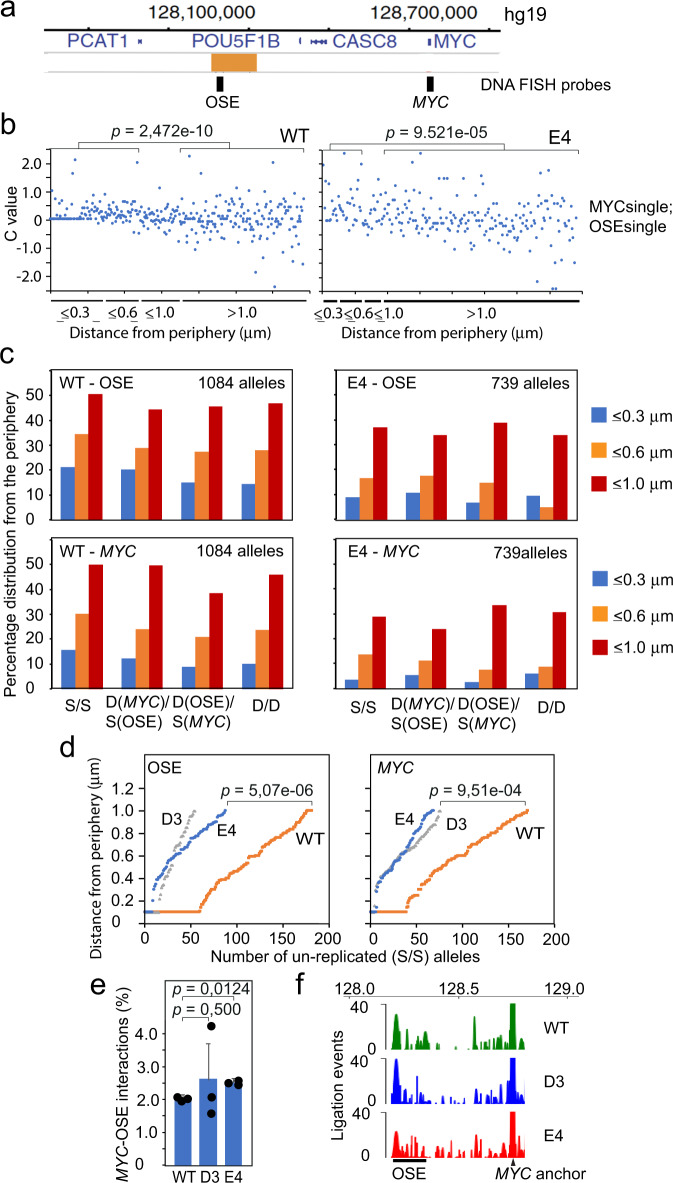
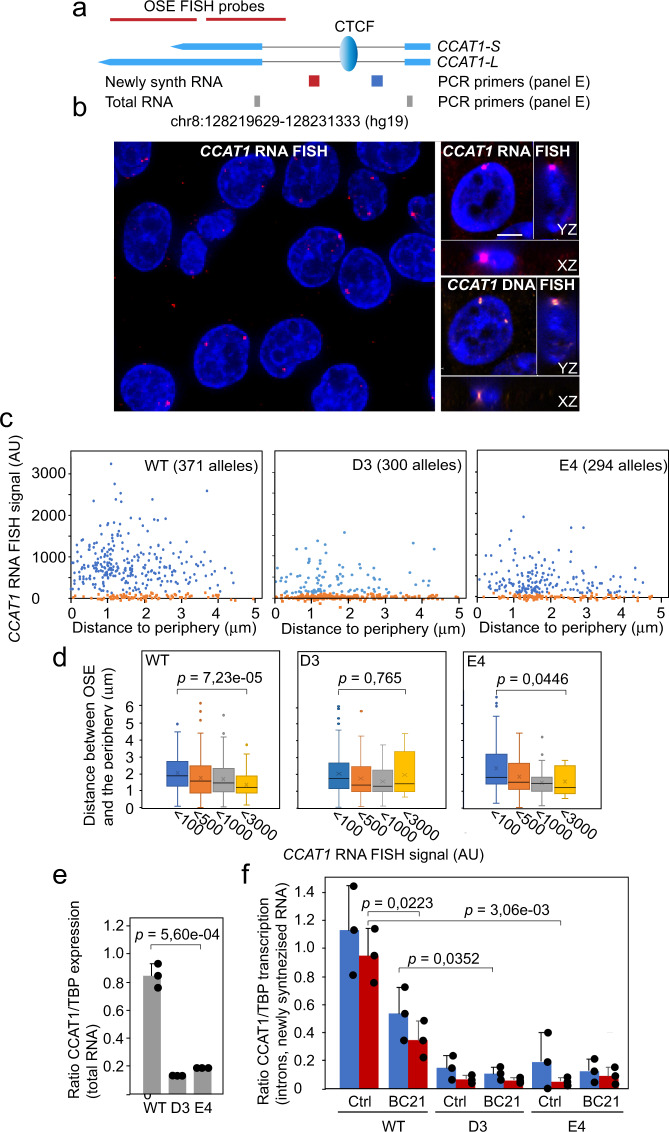
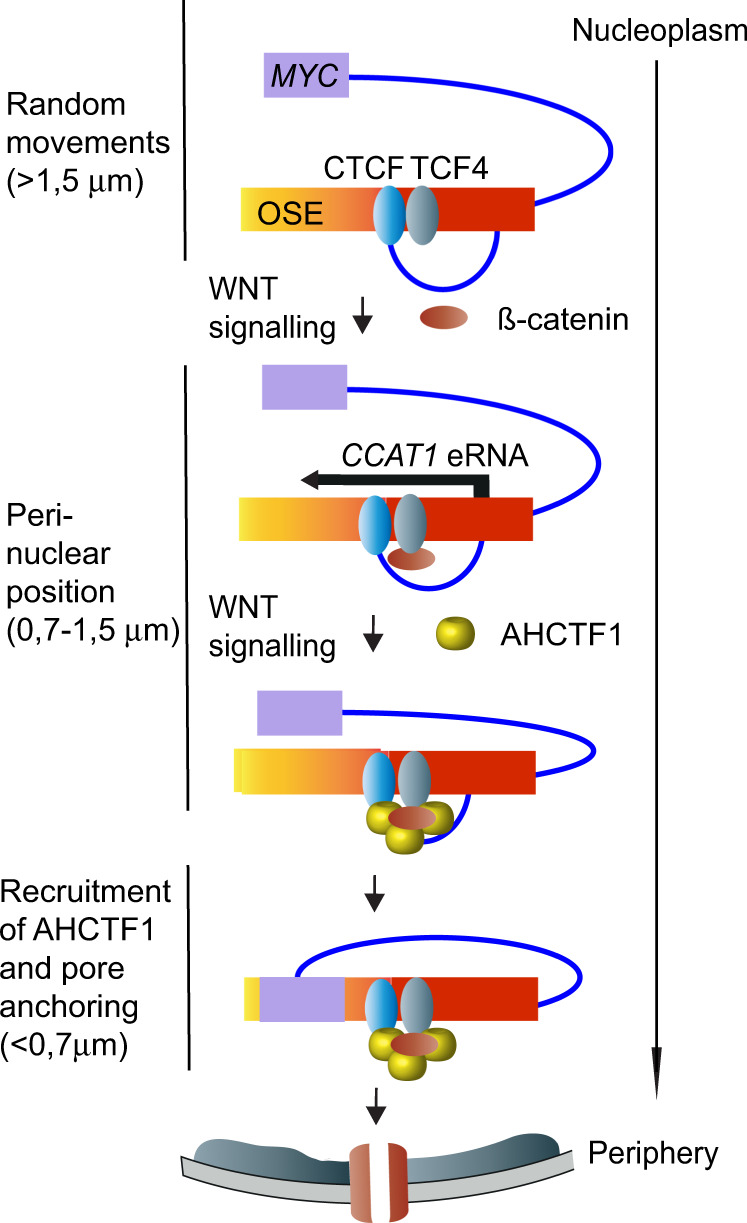
Abnormal WNT signaling increases MYC expression in colon cancer cells in part via oncogenic super-enhancer-(OSE)-mediated gating of the active MYC to the nuclear pore in a poorly understood process. We show here that the principal tenet of the WNT-regulated MYC gating, facilitating nuclear export of the MYC mRNA, is regulated by a CTCF binding site (CTCFBS) within the OSE to confer growth advantage in HCT-116 cells. To achieve this, the CTCFBS directs the WNT-dependent trafficking of the OSE to the nuclear pore from intra-nucleoplasmic positions in a stepwise manner. Once the OSE reaches a peripheral position, which is triggered by a CTCFBS-mediated CCAT1 eRNA activation, its final stretch (≤0.7 μm) to the nuclear pore requires the recruitment of AHCTF1, a key nucleoporin, to the CTCFBS. Thus, a WNT/ß-catenin-AHCTF1-CTCF-eRNA circuit enables the OSE to promote pathological cell growth by coordinating the trafficking of the active MYC gene within the 3D nuclear architecture.


Conflict of interest statement

The authors declare no competing interests.

Figures

Fig. 1
Fig. 1. The CTCFBS within the OSE-specific eRNA gene (CCAT1) confers a proliferative advantage to the HCT-116 cells.
a The position of the CCAT1-specific CTCFBS within the OSE is indicated (black arrow). The core binding sequence was modified at 8 bases, as marked by gray boxes in the panel, by CRISPR editing. Orange boxes depict enhancer regions. b ChIP analyses of the occupancy of the CTCFBS within the OSE. The MYC promoter and the H19 ICR were used as positive controls. Neg. CTCF negative site (see Methods). c DNA sequences in the edited CTCFBS in comparison to WT HCT-116 cells. d ChIP-seq profiles of CTCF binding patterns to a region encompassing the OSE (upper) and MYC (lower) regions. The ChIP-seq data, which is visualized in relation to a genome browser snapshot, was normalized from three independent experiments for WT HCT-116, D3, and E4 cells. The boxed motif, representing the CCAT1 gene region, is enlarged to identify the edited CTCFBS within its intron. The arrows identify the edited CCAT1-specific CTCFBS. e Co-cultures of wild type and mutant HCT-116 cells harvested at the indicated time points, followed by qPCR analyses of the proportion of WT and mutant CTCFBSs, respectively. f The effect of BC21 on the relative growth rate of the WT, D3, and E4 cells. All the genomic coordinates use hg19 as a reference genome. The data represent in all instances the average of three independent experiments with indicated standard deviation. The p values were calculated by the two-tailed Student’s t test.
Fig. 2
Fig. 2. The CCAT1-specific CTCFBS increases MYC and FAM49B expression by facilitating the nuclear export of MYC and FAM49B mRNAs in a WNT-dependent manner.
a The rate of nuclear export of newly synthesized MYC and FAM49B mRNAs in WT and mutant HCT-116 cells in the absence or presence of BC21 (see Methods). b The transcriptional rate of the MYC and FAM49B genes. The data were generated by qRT-PCR analyses of MYC/FAM49B transcription using newly synthesized (30 min ethynyl-uridine pulse) RNA as template and normalized to ACTB transcription. c The steady state levels of cytoplasmic MYC and FAM49B mRNAs in WT and mutant HCT-116 cells normalized to TBP expression and external “spike in” RNA controls. The levels of TBP and ß-actin mRNA expression, markers used to normalize the mRNA export and transcription rates, were not significantly different between the WT and D3/E4 cells and correctly estimated the number of input cells (Supplementary Fig. 2a, b). d Comparison between observed and simulated cytoplasmic MYC RNA levels in WT HCT-116 and E4 cells. The simulation used the parameters of nuclear export of MYC mRNA (a), transcriptional rate (b), and the kinetics of MYC mRNA decay in the nuclear and cytoplasmic compartments, as described before. The data represent in all instances the average of three independent experiments with indicated standard deviation. The p values were calculated by the two-tailed Student’s t test.
Fig. 3
Fig. 3. CTCF and ß-catenin recruit AHCTF1 to the oncogenic super-enhancer to promote its ability to reach the nuclear pore.
a Co-immunoprecipitation analyses of physical interactions between CTCF, ß-catenin, NUP133 and AHCTF1. IgG negative control. b Quantification of the CTCF-bound complexes shown in (a). c Co-immunoprecipitation analyses of the physical interactions between AHCTF1 and CTCF in WT HCT-116 cells in the absence or presence of BC21. d ChIP analyses of the binding of AHCTF1 to the oncogenic super-enhancer in DMSO control or BC21-treated WT HCT-116 cells. e ChIP analyses of CTCF and AHCTF1 binding to the CCAT1-specific CTCFBS in cells transfected with siGFP or siCTCF. The signals were normalized to the siGFP controls. The average siCTCF-mediated reduction in CTCF expression was 85% (Supplementary Fig 3d). f ChIP analyses of AHCTF1 binding to the CTCFBS and the CCAT1 promoter within the OSE in WT HCT-116 and mutant (D3/E4) cells. g The knock-down of AHCTF1 expression by siRNA using a siGFP as control. h 3D DNA FISH analyses of the proximity between the OSE and the nuclear periphery in HCT-116 cells in the presence or absence of AHCTF1 (reduced to 72% in comparison to controls). The bars represent the sum of two independent experiments (219 and 201 alleles, respectively) for siGFP and siAHCTF1-treated cells. i Box-and-whisker plots show median values, interquartile ranges and Tukey whiskers of the distribution of the OSE within 0.7 μm from the nuclear periphery. j In situ proximity ligation assay (ISPLA) of the proximity between CTCF and AHCTF1 in the absence or presence of BC21 in WT HCT-116 cells. Overviews of the DMSO, BC21, and no primary antibody control motifs (upper row), with the the lower row shows magnifications of focal planes marked in the upper row. Bar = 5 μm. k The quantification of the ISPLA signals. The data is based on three independent experiments counting a total number of 710 alleles. C CTCF antibody, A AHCTF1 antibody, No ab no primary antibody. All the data (except for h) represent the average of three independent experiments with indicated standard deviations. The p values for (bg, k) were calculated by the two-tailed Student’s t test whereas the p value for (i) was calculated using the two-sided KS test.
Fig. 4
Fig. 4. Schematic model of the recruitment of AHCTF1 to the OSE-specific CTCFBS.
Both WT HCT-116 and D3/E4 cell clones displayed prominent TCF4/ß-catenin binding to the CCAT1-specific CTCFBS region, independently of the mutation in the CTCFBS (Supplementary Fig. 5b). Since both the mutation of the CTCFBS (Fig. 3d, f) and the disruption of ß-catenin-TCF4 complex lead to a reduction in AHCTF1 presence at the OSE, we propose that the juxtaposed CTCF and TCF4-binding sites (Supplementary Fig. 5a) collaborate to stabilize the presence of AHCTF1 at the CCAT1-specific CTCFBS via a CTCF-AHCTF1-ß-catenin complex. The timing of these events is largely unknown and are thus hypothetically visualized in the image.
Fig. 5
Fig. 5. The CCAT1-specific CTCFBS influences the proximity between the OSE and MYC at the nuclear periphery, but not their overall interaction frequency.
a Schematic map (to scale) of the OSE and MYC regions with the position of the DNA FISH probes indicated. b Analysis of the “c” value (scoring for the difference in the distances of MYC and the OSE from the nuclear periphery) in relation to the proximity of the OSE to the nuclear periphery in control and mutant HCT-116 cells for un-replicated alleles (MYCsingle/OSEsingle). The replication state of the MYC and OSE regions are indicated by the number of replicated alleles (see Supplementary Fig. 6 for additional information). A total of 1085 (Ctrl), and 740 (E4) alleles were counted from two independent experiments. c The overall proximity between the OSE and MYC regions from the nuclear periphery were stratified into three distances. S/S = un-replicated alleles; D(MYC)/S(OSE) = The MYC allele replicated before the OSE allele; S(MYC)/D(OSE) = The OSE allele replicated before the MYC allele; D(MYC)/D(OSE) = Both MYC and OSE alleles replicated. d The cumulative distribution of un-replicated MYC and OSE alleles within one micrometer from the nuclear periphery in WT HCT-116, D3, and E4 cells. The numbers have been derived from the source data of (b, c). e Chromatin fiber interaction analyses (Nodewalk), showing the percentage of sequences within the OSE region (hg19:chr8:128192176-128309374) that interacted with the MYC anchor (hg19:chr8:128,746,000-128,756,177). f Graphic representation of the interaction patterns in the 5’-flank of the MYC anchor. The data is the average of unique ligation events normalized from three independent experiments. The p values indicated in panels b and d were determined using the two-sided KS test, while the p values in panel e were determined by the two-tailed Student’s t test.
Fig. 6
Fig. 6. WNT activates CCAT1 eRNA expression via the CTCFBS to promote its juxtaposition to the nuclear periphery.
a Schematic map of the CCAT1 gene and the position of the CTCFBS and the primers used to assess CCAT1 expression. b Sequential RNA/DNA FISH analyses to score for CCAT1 expression in WT HCT-116 cells. The left image shows a larger view with the right image representing a focal plane of CCAT1 RNA and DNA FISH signals. Bar = 3 μm. c Quantitation of the RNA FISH signals in relation to the nuclear periphery in WT HCT-116 (371 alleles), D3 (300 alleles) and E4 (294 alleles) cells. Data points at or near background (<100 AU) are marked in orange. d Box-and-whisker plots show median values, interquartile ranges and Tukey whiskers (p values: two-sided KS test) of the distribution of the OSE in relation to the nuclear periphery, stratified according to the strength of the RNA FISH signal. In instances where no RNA FISH signal could be detected above background, the peripheral distribution was determined by the OSE DNA FISH signal. e qRT-PCR analyses of processed CCAT1 eRNA of total RNA using primers marked as gray in (a). f qRT-PCR analyses of CCAT1 transcription using newly synthesized (30 min ethynyl-uridine pulse) RNA as templates and primers positioned upstream (blue) or downstream (red) of the CTCFBS, as marked in panel a). The p values indicated in panel d were determined by using the two-sided KS test, whereas the p values shown in (e, f) were determined using the two-tailed Student’s t test.
Fig. 7
Fig. 7. A model outlining the role of the CTCFBS to effectuate the WNT-controlled stepwise trafficking of MYC to the nuclear pore.
The migration of the OSE to the nuclear periphery/pore is postulated to occur in three phases: one initially random movement of the OSE in the nuclear interior is followed by a preferential localization of the OSE to a position close to the periphery. This process correlates with WNT-induced activation of CCAT1 transcription, mediated by the CTCFBS potentially in collaboration with the flanking TCF4 motifs. A third key event is the recruitment of AHCTF1 to the CTCF-complexed OSE, which likely occurs close to the periphery in positions illustrated by proximities between CTCF and AHCTF1. Importantly, this last step is critical for the ability of the OSE to reach the nuclear pore. Prior to the anchoring of MYC to the nuclear pore, the potential for direct interaction between the OSE and MYC is highest within 0.5 μm from the nuclear pore, paralleled by declining CCAT1 transcription. This entire process is strongly reduced or absent in mutant D3/E4 HCT-116 cells or normal human primary colon epithelial cells in which the region corresponding to the OSE is unable to efficiently bind CTCF.

References

    1. Blobel G. Gene gating: a hypothesis. Proc. Natl Acad. Sci. U.S.A. 1985;82:8527–8529. - PMC - PubMed
    1. Cremer T, et al. The 4D nucleome: evidence for a dynamic nuclear landscape based on co-aligned active and inactive nuclear compartments. FEBS Lett. 2015;589:2931–2943. - PubMed
    1. Pascual-Garcia P, Capelson M. Nuclear pores as versatile platforms for gene regulation. Curr. Opin. Genet. Dev. 2014;25:110–117. - PubMed
    1. Burns LT, Wente SR. From hypothesis to mechanism: uncovering nuclear pore complex links to gene expression. Mol. Cell Biol. 2014;34:2114–2120. - PMC - PubMed
    1. Pascual-Garcia P, et al. Metazoan nuclear pores provide a scaffold for poised genes and mediate induced enhancer-promoter contacts. Mol. Cell. 2017;66:63–76 e66. - PMC - PubMed

Publication types

MeSH terms