. 2022 Jan 11;13(1):261.
doi: 10.1038/s41467-021-27901-5.

Robust differentiation of human enteroendocrine cells from intestinal stem cells

Affiliations

Robust differentiation of human enteroendocrine cells from intestinal stem cells

Daniel Zeve et al. Nat Commun. .

Abstract

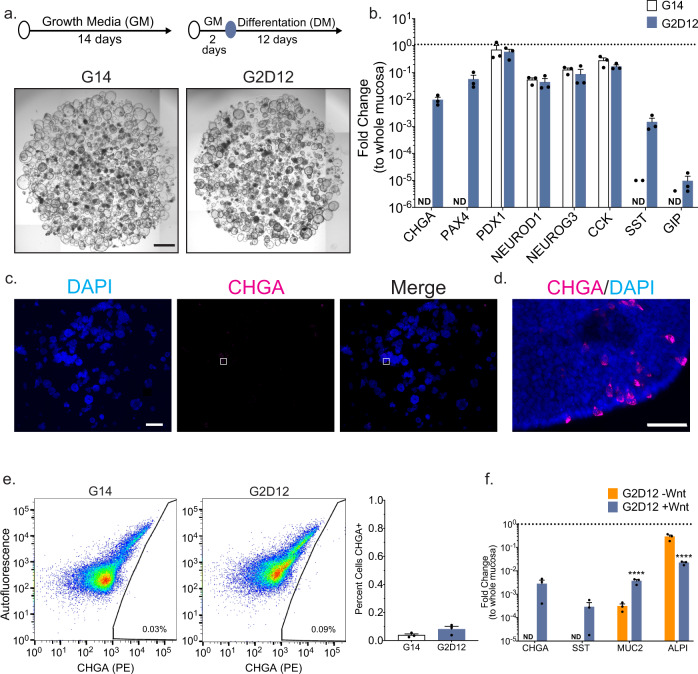
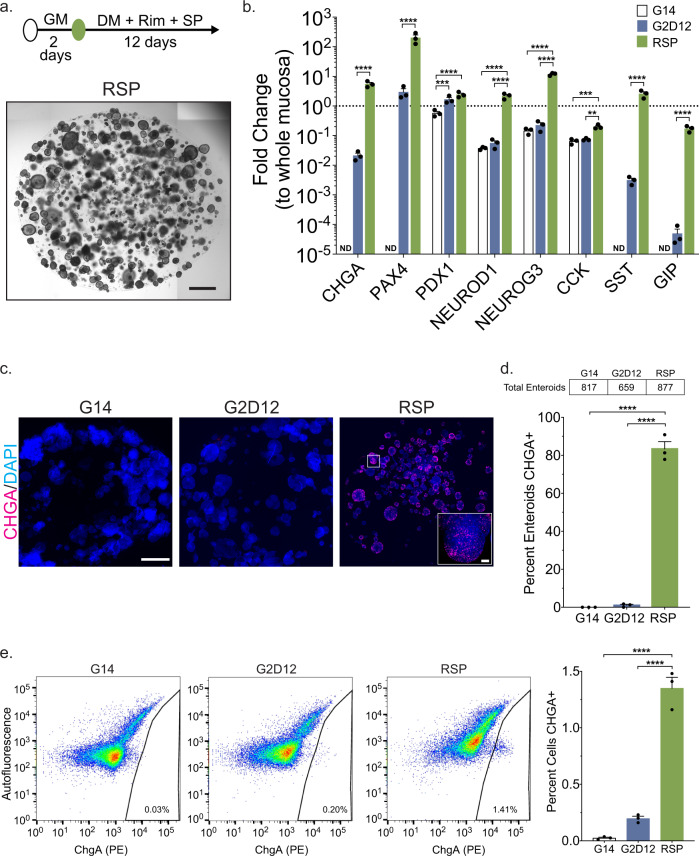
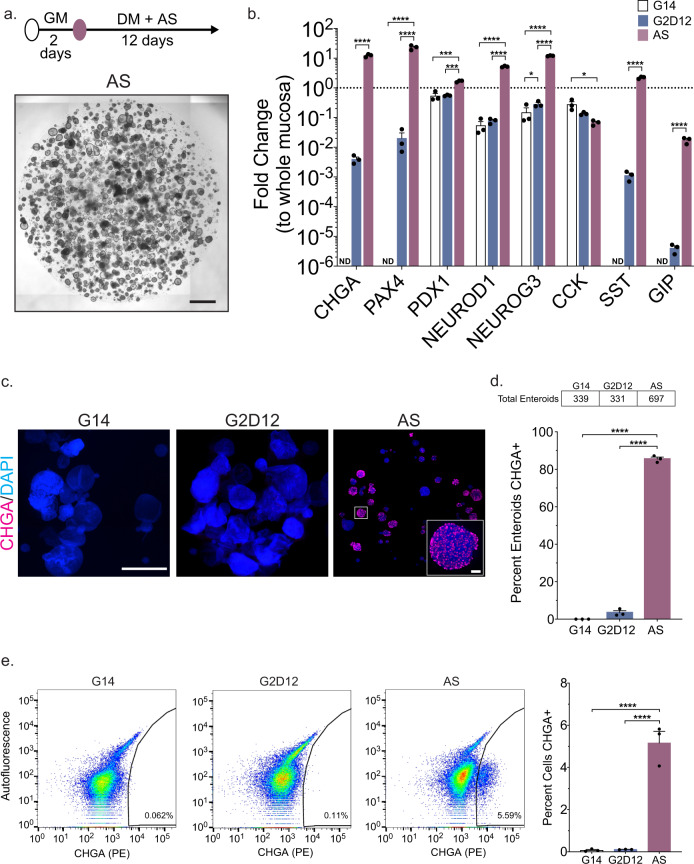
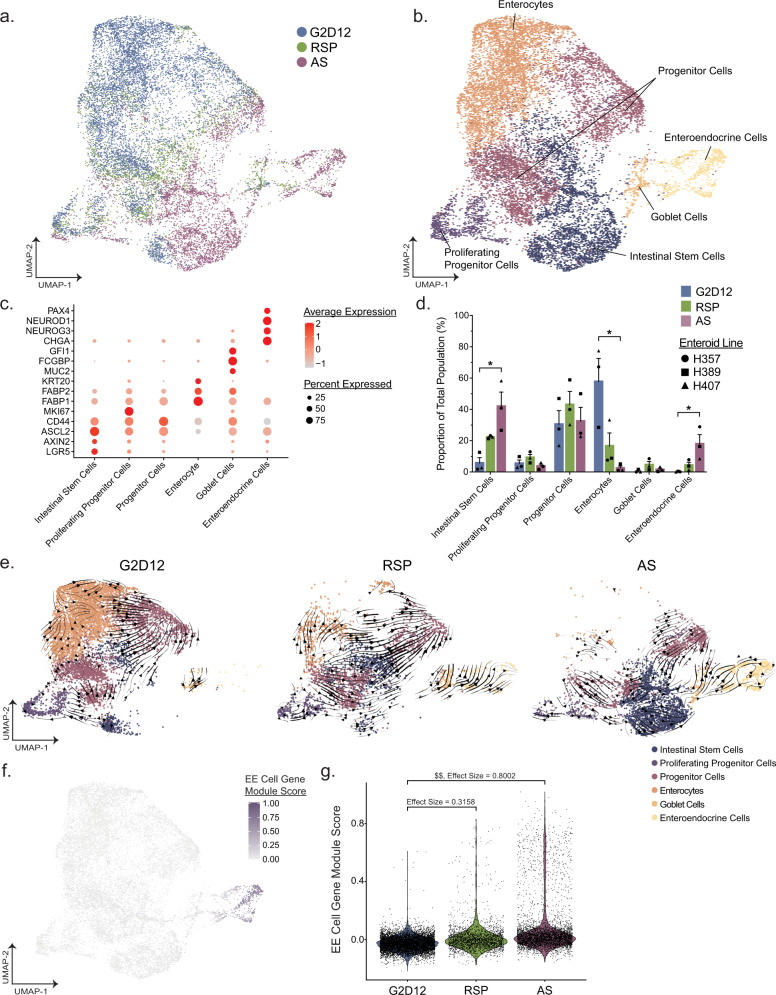
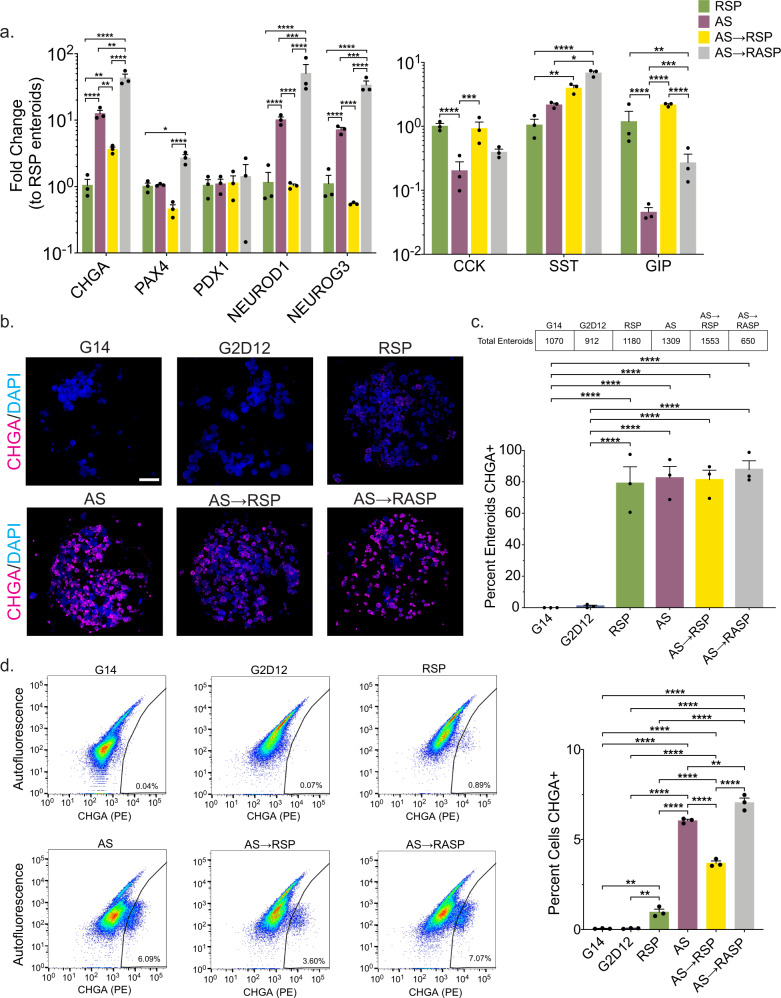
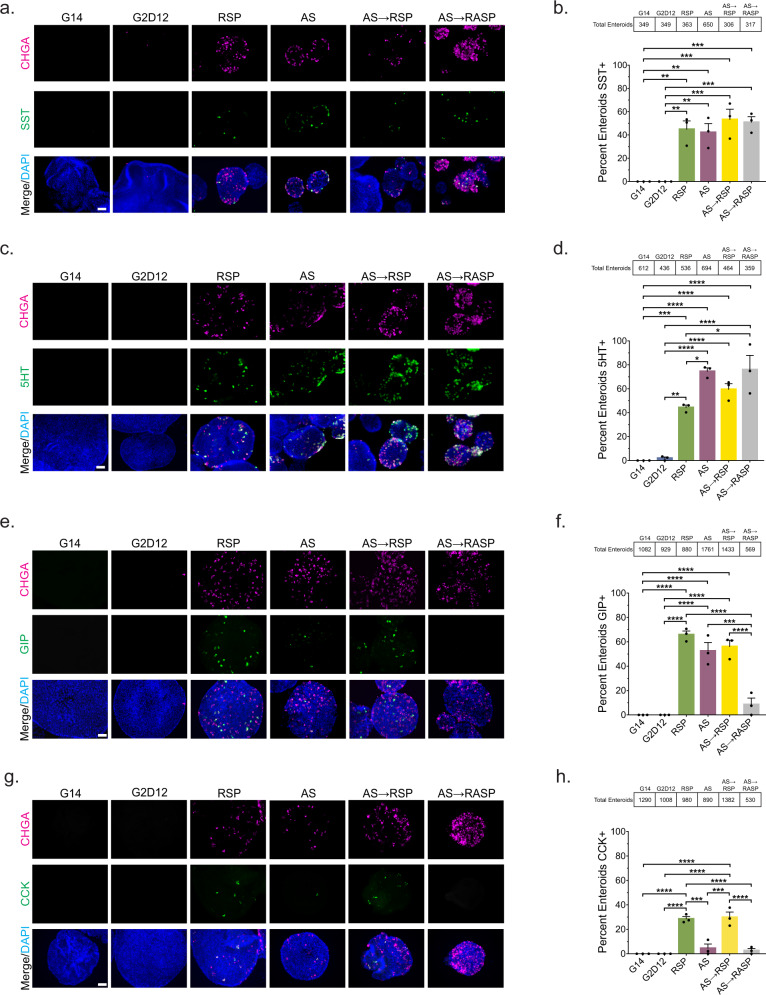
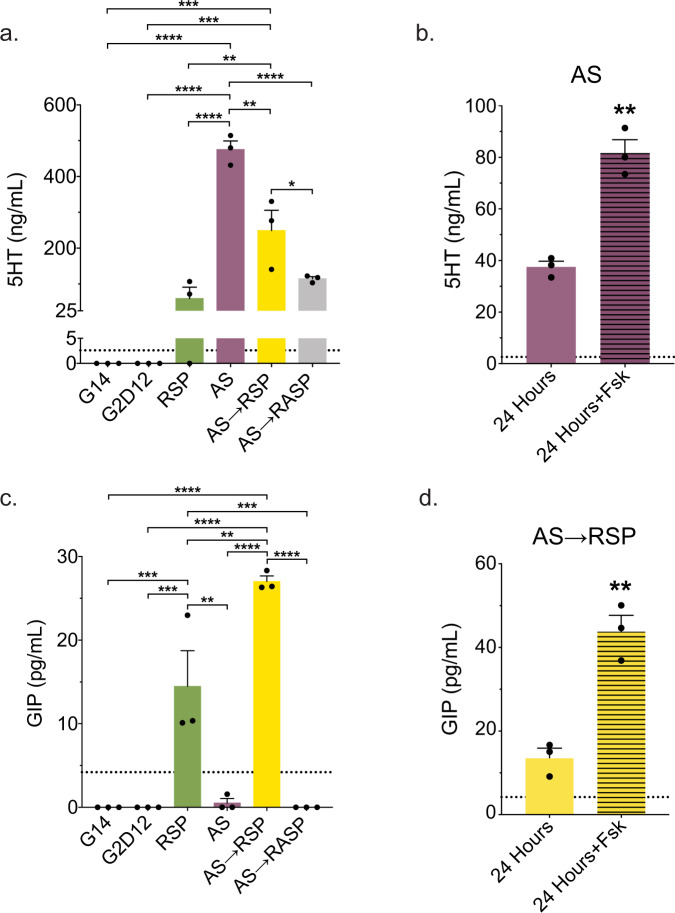
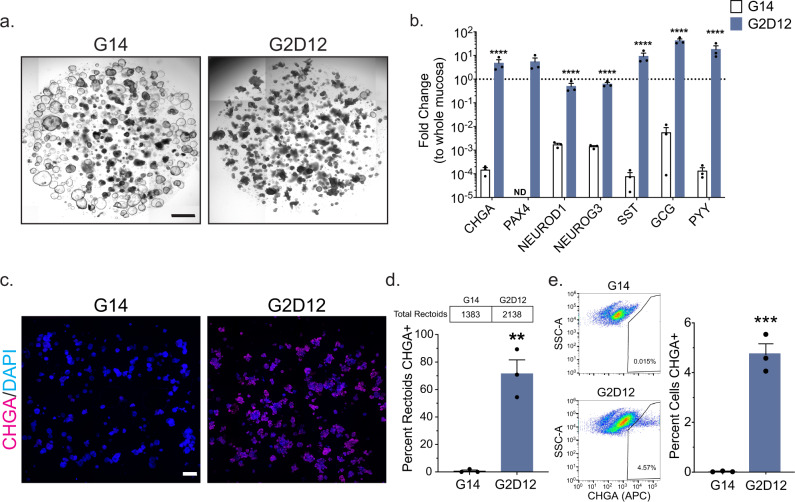
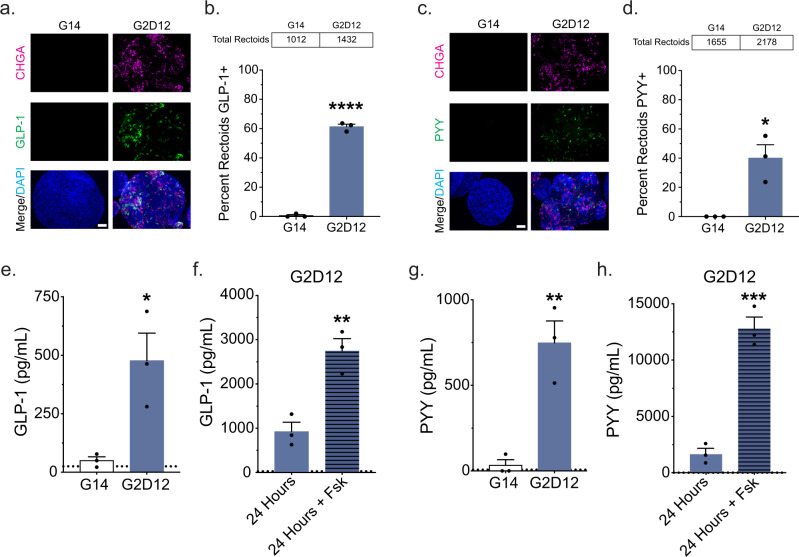
Enteroendocrine (EE) cells are the most abundant hormone-producing cells in humans and are critical regulators of energy homeostasis and gastrointestinal function. Challenges in converting human intestinal stem cells (ISCs) into functional EE cells, ex vivo, have limited progress in elucidating their role in disease pathogenesis and in harnessing their therapeutic potential. To address this, we employed small molecule targeting of the endocannabinoid receptor signaling pathway, JNK, and FOXO1, known to mediate endodermal development and/or hormone production, together with directed differentiation of human ISCs from the duodenum and rectum. We observed marked induction of EE cell differentiation and gut-derived expression and secretion of SST, 5HT, GIP, CCK, GLP-1 and PYY upon treatment with various combinations of three small molecules: rimonabant, SP600125 and AS1842856. Robust differentiation strategies capable of driving human EE cell differentiation is a critical step towards understanding these essential cells and the development of cell-based therapeutics.


Conflict of interest statement

The author J.M.K. holds equity in Frequency Therapeutics, a company that has an option to license IP generated by J.M.K. and that may benefit financially if the IP is licensed and further validated. Also, J.M.K. has been a paid consultant and/or equity holder for multiple companies (listed here https://www.karplab.net/team/jeff-karp). The interests of J.M.K. was reviewed and are subject to a management plan overseen by their institutions in accordance with their conflict-of-interest policies. J.O.M. reports compensation for consulting services with Cellarity and Hovione. The remaining authors declare no competing interests. A patent was filed by D.Z. and D.T.B covering compositions and methods for regulating enteroendocrine cell differentiation and uses thereof as described in the manuscript.

Figures

Fig. 1
Fig. 1. Base differentiation media induces CHGA expression in a Wnt-dependent manner.
a Representative light microscopy of enteroids (whole well) grown in growth media (GM) for 14 days (G14) or two days in GM followed by 12 days in differentiation media (DM, G2D12). Specific culture schematic located above each panel, respectively. Scale bar = 1 mm. b qPCR analysis of enteroendocrine (EE) markers of enteroids grown in either G14 or G2D12 compared to duodenal whole mucosa and normalized to 18S. Dotted line denotes expression level in whole duodenal mucosa. Representative experiment showing n = 3 wells for each condition from a single enteroid line. CHGA = chromogranin A, PAX4 = paired box 4, PDX1 = pancreatic and duodenal homeobox 1, NEUROD1 = neuronal differentiation 1, NEUROG3 = neurogenin 3, CCK = cholecystokinin, SST = somatostatin, GIP = glucose-dependent insulinotropic peptide, ND = not detectable in one or more samples. (c and d) Representative immunofluorescence staining of CHGA (magenta) in enteroids (whole well) treated with G2D12. Boxed portion in c shown magnified in d. DNA (4′,6-diamidino-2-phenylindole (DAPI) blue). Scale bars = 1 mm (c) and 50 µm (d). e Left two panels: Representative flow cytometry plots of CHGA-positive (CHGA+) cells from enteroids grown in either G14 or G2D12. Right panel: Percentage of CHGA + cells per well. Representative experiment showing n = 3 wells from each condition from single enteroid line. f qPCR analysis of mature intestinal gene markers of enteroids grown in either G2D12 without Wnt (G2D12-Wnt) or with Wnt (G2D12 + Wnt) compared to whole mucosa and normalized to 18S. Dotted line denotes expression level in whole duodenal mucosa. MUC2 = Mucin 2, ALPI = Intestinal alkaline phosphatase. Representative experiment showing n = 3 wells from each condition from a single enteroid line. ****p < 0.0001. Bars show mean ± SEM; two-way ANOVA with Tukey correction for multiple comparisons (b, f); two-tailed unpaired t test (e). Each experiment repeated with at least three different enteroid lines. Specific conditions were excluded from statistical analysis if the data from one or more samples was labeled as not detectable. Source data are provided as a Source Data file.
Fig. 2
Fig. 2. Differentiation with small molecules rimonabant and SP600125 induces CHGA expression.
a Representative light microscopy of enteroids (whole well) grown in growth media for 2 days followed by 12 days in differentiation media with rimonabant and SP600125 (RSP). Culture schematic located above panel. Scale bar = 1 mm. b qPCR analysis of enteroendocrine markers of enteroids grown in G14, G2D12 or RSP compared to duodenal whole mucosa and normalized to 18S. Dotted line denotes expression level in whole duodenal mucosa. Representative experiment showing n = 3 wells from each condition from a single enteroid line. CHGA = chromogranin A, PAX4 = paired box 4, PDX1 = pancreatic and duodenal homeobox 1, NEUROD1 = neuronal differentiation 1, NEUROG3 = neurogenin 3, CCK = cholecystokinin, SST = somatostatin, GIP = glucose-dependent insulinotropic peptide, ND = not detectable in one or more samples. **p = 0.0025; ***p = 0.0009 (PDX1), 0.0003 (CCK); ****p < 0.0001. c Representative immunofluorescence staining of CHGA (magenta) in enteroids (whole well) treated with G14, G2D12 and RSP. Boxed portion magnified in lower right corner. Nuclei (4′,6-diamidino-2-phenylindole (DAPI), blue). Scale bars = 1 mm and 50 µm (boxed portion). d Percentage of enteroids with positive CHGA staining in G14, G2D12 and RSP treatments. Table above graph shows the total number of enteroids examined per condition. Average results are from three separate experiments from three different enteroid lines or passages. ****p < 0.0001. e Left three panels: Representative flow cytometry plots of CHGA+ cells from enteroids grown in G14, G2D12, or RSP. Right panel: Percentage of CHGA + cells per well. Representative experiment showing n = 3 wells from each condition from a single enteroid line. ****p < 0.0001. Bars show mean ± SEM; two-way ANOVA with Tukey correction for multiple comparisons (b); one-way ANOVA with Tukey correction for multiple comparisons (d, e). Each experiment repeated with at least three different enteroid lines. Specific conditions were excluded from statistical analysis if the data from one or more samples was labeled as not detectable. Source data are provided as a Source Data file.
Fig. 3
Fig. 3. Differentiation with small molecule AS1842856 induces CHGA expression.
a Representative light microscopy of enteroids (whole well) grown in growth media for 2 days followed by 12 days in differentiation media with AS1842856 (AS). Culture schematic located above panel. Scale bar = 1 mm. b qPCR analysis of enteroendocrine markers of enteroids grown in G14, G2D12 or AS compared to whole duodenal mucosa and normalized to 18S. Dotted line denotes expression level in whole duodenal mucosa. Representative experiment showing n = 3 wells from each condition from a single enteroid line. CHGA = chromogranin A, PAX4 = paired box 4, PDX1 = pancreatic and duodenal homeobox 1, NEUROD1 = neuronal differentiation 1, NEUROG3 = neurogenin 3, CCK = cholecystokinin, SST = somatostatin, GIP = glucose-dependent insulinotropic peptide, ND = not detectable in one or more samples. *p = 0.038 (NEUROG3), 0.0130 (CCK); ***p = 0.0004 (PDX1, G14 to AS), 0.0009 (PDX1, G2D12 to AS); ****p < 0.0001. c Representative immunofluorescence staining of CHGA (magenta) in enteroids (whole well) treated with G14, G2D12 and AS. Boxed portion magnified in lower right corner. DNA (4′,6-diamidino-2-phenylindole (DAPI), blue). Scale bars = 1 mm and 50 µm (boxed portion). d Percentage of enteroids with positive CHGA staining in G14, G2D12 and AS treatments. Table above graph shows the total number of enteroids examined per condition. Average results are from three separate experiments from three different enteroid lines or passages. ****p < 0.0001. e Left three panels: Representative flow cytometry plots of CHGA + cells from enteroids grown in G14, G2D12 or AS. Right panel: Percentage of CHGA + cells per well. Representative experiment showing n = 3 wells from each condition from a single enteroid line. ****p < 0.0001. Bars show mean ± SEM; two-way ANOVA with Tukey correction for multiple comparisons (b); one-way ANOVA with Tukey correction for multiple comparisons (d, e). Each experiment repeated with at least three different enteroid lines. Specific conditions were excluded from statistical analysis if the data from one or more samples was labeled as not detectable. Source data are provided as a Source Data file.
Fig. 4
Fig. 4. scRNA-seq profiling of enteroids cultured with rimonabant/SP600125 or AS1842856.
a Uniform manifold approximation and projection (UMAP) visualization of 14,767 cells summarizing enteroid differentiation from all samples, color labeled by culture condition. b UMAP visualization from a, color labeled by broad annotated cell identity, following Louvain clustering. c Dot plot of the average scaled expression (measured by average Pearson residual) of canonical markers of various intestinal epithelial cell types, plotted against cluster identity. d Proportional abundance of epithelial cell subsets by enteroid culture protocol. Each culture condition consists of three different enteroid lines from distinct human donors, as denoted by data point shape. Bars show mean ± SEM; Kruskal-Wallis test with Dunn’s post-hoc analysis displayed. P values were adjusted using Bonferroni correction for multiple comparisons. *p = 0.0219 (Intestinal Stem Cells and Enteroendocrine Cells), 0.0338 (Enterocytes). e UMAP visualization of 14,767 cells divided by culture condition and colored by cell identity. Trajectory analysis of each protocol was calculated using scVelo and the vector field was overlaid on top of each UMAP. Arrows represent smoothed averages of the estimated cellular differentiation trajectory, with arrow thickness corresponding to the “speed” of differentiation. f UMAP visualization from a, with individual cells colored by their EE cell module score. Each score was scaled on a range from 0 to 1. g Violin plots of the module score described in f split across culture condition. The effect size between culture conditions was calculated as Cohen’s d; $$0.8 < d < 1.2. Source data are provided as a Source Data file.
Fig. 5
Fig. 5. Combinations of AS1842856 and rimonabant/SP600125 induce different levels of enteroendocrine marker expression.
a qPCR analysis of enteroendocrine markers of enteroids grown in AS, AS for 6 days, followed by RSP only for 6 days (AS→RSP) and AS for 6 days, followed by AS and RSP for 6 days (AS→RASP) compared to enteroids grown in RSP and normalized to 18S. Representative experiment showing n = 3 wells from each condition from a single enteroid line. CHGA = chromogranin A, PAX4 = paired box 4, PDX1 = pancreatic and duodenal homeobox 1, NEUROD1 = neuronal differentiation 1, NEUROG3 = neurogenin 3, CCK = cholecystokinin, SST = somatostatin, GIP = glucose-dependent insulinotropic peptide. *p = 0.0424 (PAX4), 0.0123 (SST); **p = 0.039 (CHGA, RSP to AS→RSP), 0.0059 (CHGA, AS to AS→RSP), 0.0064 (CHGA, AS to AS→RASP), 0.0019 (SST), 0.0010 (GIP); ***p = 0.0006 (NEUROD1), 0.0004 (NEUROG3), 0.0003 (CCK), 0.0001 (GIP); ****p < 0.0001. b Representative immunofluorescence staining of CHGA (magenta) in enteroids (whole well) treated with G14, G2D12, RSP, AS, AS→RSP, and AS→RASP. DNA (4′,6-diamidino-2-phenylindole (DAPI), blue). Scale bar = 1 mm. c Percentage of enteroids with positive CHGA staining in G14, G2D12, AS, RSP, AS→RSP, and AS→RASP treatments. Table above graph shows the total number of enteroids examined per condition. Average results are from three separate experiments from three different enteroid lines or passages. ****p < 0.0001. d Left six panels: Representative flow cytometry plots of CHGA + cells from enteroids grown in G14, G2D12, RSP, AS, AS→RSP, and AS→RASP. Right panel: Percentage of CHGA + cells per well. Representative experiment showing n = 3 wells from each condition from a single enteroid line. **p = 0.0041 (G14 to RSP), 0.0045 (G2D12 to RSP), 0.0020 (AS to AS→RASP); ****p < 0.0001. Bars show mean ± SEM; two-way ANOVA with Tukey correction for multiple comparisons (a); one-way ANOVA with Tukey correction for multiple comparisons (c, d). Each experiment repeated with at least three different enteroid lines. Source data are provided as a Source Data file.
Fig. 6
Fig. 6. Multiple differentiation conditions induce hormone production.
a Representative immunofluorescence staining of somatostatin (SST, green) and chromogranin A (CHGA, magenta) in enteroids treated with G14, G2D12, RSP, AS, AS→RSP, and AS→RASP. DNA (4′,6-diamidino-2-phenylindole (DAPI), blue). Scale bar = 50 µm. b Percentage of enteroids with SST staining in G14, G2D12, RSP, AS, AS→RSP, and AS→RASP treatments. Average results are from three different enteroid lines or passages. **p = 0.0017 (G14 to RSP, G2D12 to RSP), 0.0029 (G14 to AS, G2D12 to AS); ***p = 0.0004 (G14 to AS→RSP, G2D12 to AS→RSP), 0.0006 (G14 to AS→RASP, G2D12 to AS→RASP). c Representative immunofluorescence staining of serotonin (5HT, green) and CHGA (magenta) in enteroids treated with G14, G2D12, RSP, AS, AS→RSP and AS→RASP. DNA (DAPI, blue). Scale bar = 50 µm. d Percentage of enteroids with 5HT staining in G14, G2D12, RSP, AS, AS→RSP and AS→RASP treatments. Average results are from three different enteroid lines or passages. *p = 0.0183 (RSP to AS), 0.0134 (RSP to AS→RASP); **p = 0.0014; ***p = 0.0009; ****p < 0.0001. e Representative immunofluorescence staining of glucose-dependent insulinotropic peptide (GIP, green) and CHGA (magenta) in enteroids treated with G14, G2D12, RSP, AS, AS→RSP, and AS→RASP. DNA (DAPI, blue). Scale bar = 50 µm. f Percentage of enteroids with GIP staining in G14, G2D12, RSP, AS, AS→RSP, and AS→RASP treatments. Average results are from three different enteroid lines or passages. ***p = 0.0001; ****p < 0.0001. g Representative immunofluorescence staining of cholecystokinin (CCK, green) and CHGA (magenta) in enteroids treated with G14, G2D12, RSP, AS, AS→RSP, and AS→RASP. DNA (DAPI, blue). Scale bar = 50 µm. h Percentage of enteroids with CCK staining in G14, G2D12, RSP, AS, AS→RSP, and AS→RASP treatments. Average results are from three different enteroid lines or passages. ***p = 0.0002 (RSP to AS), 0.0001 (AS to AS→RSP); ****p < 0.0001. Bars show mean ± SEM; one-way ANOVA with Tukey correction for multiple comparisons (b, d, f, h). Tables above graphs show the total number of enteroids examined per condition. Each experiment repeated with at least three different enteroid lines. Source data are provided as a Source Data file.
Fig. 7
Fig. 7. Differentiation Conditions Induce Hormone Secretion.
a Serotonin (5HT) ELISA of conditioned media from the last two days of differentiation of enteroids grown in G14, G2D12, RSP, AS, AS→RSP, and AS→RASP. Representative experiment showing n = 3 wells from each condition from a single enteroid line. *p = 0.049; **p = 0.0049 (RSP to AS→RSP), 0.0011 (AS to AS→RSP); ***p = 0.0005 (G14 to AS→RSP and G2D12 to AS→RSP); ****p < 0.0001. b 5HT ELISA of AS conditioned media collected after 24 h on day 13 (solid bar) and after 24 h with forskolin (Fsk) on day 14 (striped bar). Representative experiment showing n = 3 wells from each condition from a single enteroid line. **p = 0.0015. c Glucose-dependent insulinotropic peptide (GIP) ELISA of conditioned media from the last two days of differentiation of enteroids grown in G14, G2D12, RSP, AS, AS→RSP, and AS→RASP. Representative experiment showing n = 3 wells from each condition from a single enteroid line. **p = 0.0013 (RSP to AS), 0.0031 (RSP to AS→RSP); ***p = 0.0009 (G14 to RSP, G2D12 to RSP, and RSP to AS→RASP); ****p < 0.0001. d GIP ELISA of AS→RSP conditioned media collected after 24 h on day 13 (solid bar) and after 24 h with Fsk on day 14 (striped bar). Representative experiment showing n = 3 wells from each condition from a single enteroid line. **p = 0.0025. Bars show mean ± SEM; one-way ANOVA with Tukey correction for multiple comparisons (a, c); two-tailed unpaired t test (b, d). Dotted line at 2.6 ng/mL represents the lower limit of detection for the 5HT ELISA (a, b). Dotted line at 4.2 pg/mL represents the lower limit of detection for the GIP ELISA (c, d). Each experiment repeated with at least three different enteroid lines. Source data are provided as a Source Data file.
Fig. 8
Fig. 8. Induction of the Enteroendocrine Lineage in Rectoids.
a Representative light microscopy of rectoids (whole well) grown in G14 or G2D12. Scale bar = 1 mm. b qPCR analysis of EE markers of rectoids grown in either G14 or G2D12 compared to whole rectal mucosa (dotted line) and normalized to 18S. Representative experiment showing n = 3 wells for each condition from a single rectoid line. CHGA = chromogranin A, PAX4 = paired box 4, NEUROD1 = neuronal differentiation 1, NEUROG3 = neurogenin 3, SST = somatostatin, GCG = glucagon, PYY = peptide YY, ND = not detectable in one or more samples. ****p < 0.0001. c Representative immunofluorescence staining of CHGA (magenta) in rectoids (whole well) treated with G14 and G2D12. DNA (4′,6-diamidino-2-phenylindole (DAPI), blue). Scale bar = 1 mm. d Percentage of rectoids with CHGA staining in G14 and G2D12 treatments. Average results are from three different rectoid lines or passages. Table above graph shows the total number of rectoids examined per condition. **p = 0.0022. e Left two panels: Representative flow cytometry plots of CHGA + cells from rectoids grown in G14 and G2D12. Right panel: Percentage of CHGA + cells per well. Representative experiment showing n = 3 wells from each condition from a single rectoid line. ***p = 0.0004. Bars show mean ± SEM; two-way ANOVA with Tukey correction for multiple comparisons (b); two-tailed unpaired t test (d, e). Each experiment repeated with at least three different rectoid lines. Specific conditions were excluded from statistical analysis if the data from one or more samples were labeled as not detectable. Source data are provided as a Source Data file.
Fig. 9
Fig. 9. Hormone production and secretion in rectoids.
a Representative immunofluorescence staining of glucagon-like peptide-1 (GLP-1, green) and CHGA (magenta) in rectoids treated with G14 and G2D12. DNA (4′,6-diamidino-2-phenylindole (DAPI), blue). Scale bar = 50 µm. b Percentage of rectoids with GLP-1 staining in G14 and G2D12. Average results are from three different rectoid lines or passages. ****p < 0.0001. c Representative immunofluorescence staining of peptide YY (PYY, green) and CHGA (magenta) in rectoids treated with G14 and G2D12. DNA (DAPI, blue). Scale bar = 50 µm. d Percentage of rectoids with PYY staining in G14 and G2D12. Average results are from three different rectoid lines or passages. *p = 0.0118. e GLP-1 ELISA of conditioned media from the last two days of differentiation of rectoids grown in G14 and G2D12. Representative experiment showing n = 3 wells from each condition from a single rectoid line. *p = 0.0229. f GLP-1 ELISA of G2D12 conditioned media collected after 24 h on day 13 (solid bar) and after 24 hours with forskolin (Fsk) on day 14 (striped bar). Representative experiment showing n = 3 wells from each condition from a single rectoid line. **p = 0.0061. g PYY ELISA of conditioned media from the last two days of differentiation of rectoids grown in G14 and G2D12. Representative experiment showing n = 3 wells from each condition from a single rectoid line. **p = 0.0056. h PYY ELISA of G2D12 conditioned media collected after 24 h on day 13 (solid bar) and after 24 hours with forskolin (Fsk) on day 14 (striped bar). Representative experiment showing n = 3 wells from each condition from a single rectoid line. ***p = 0.0006. Bars show mean ± SEM; two-tailed unpaired t test (b, d, e, f, g, h). Dotted line at 25 pg/mL represents the lower limit of detection for the GLP-1 ELISA (e, f). Dotted line at 7.3 pg/mL represents the lower limit of detection for the PYY ELISA (g, h). Each experiment repeated with at least three different rectoid lines. Tables above graphs show the total number of rectoids examined per condition. Source data are provided as a Source Data file.

References

    1. Posovszky C. Development and anatomy of the enteroendocrine system in humans. Endocr. Dev. 2017;32:20–37. - PubMed
    1. Furness JB, Rivera LR, Cho HJ, Bravo DM, Callaghan B. The gut as a sensory organ. Nat. Rev. Gastroenterol. Hepatol. 2013;10:729–740. - PubMed
    1. El-Salhy M, Hausken T, Gilja OH, Hatlebakk JG. The possible role of gastrointestinal endocrine cells in the pathophysiology of irritable bowel syndrome. Expert Rev. Gastroenterol. Hepatol. 2017;11:139–148. - PubMed
    1. Worthington JJ, Reimann F, Gribble FM. Enteroendocrine cells-sensory sentinels of the intestinal environment and orchestrators of mucosal immunity. Mucosal Immunol. 2018;11:3–20. - PubMed
    1. Holst JJ, Vilsboll T, Deacon CF. The incretin system and its role in type 2 diabetes mellitus. Mol. Cell Endocrinol. 2009;297:127–136. - PubMed

Publication types

MeSH terms