. 2022 Jan 11;13(1):245.
doi: 10.1038/s41467-021-27921-1.

MAPK4 promotes triple negative breast cancer growth and reduces tumor sensitivity to PI3K blockade

Affiliations

MAPK4 promotes triple negative breast cancer growth and reduces tumor sensitivity to PI3K blockade

Wei Wang et al. Nat Commun. .

Abstract

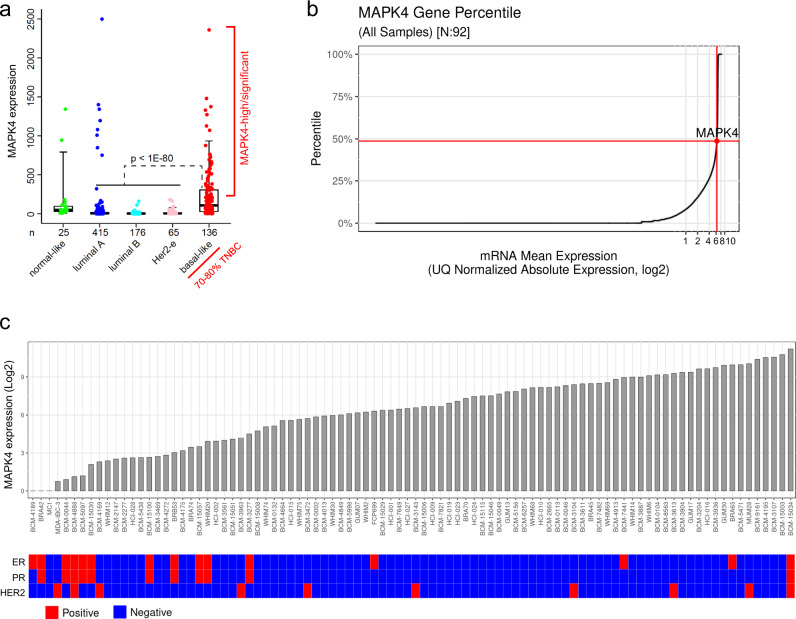
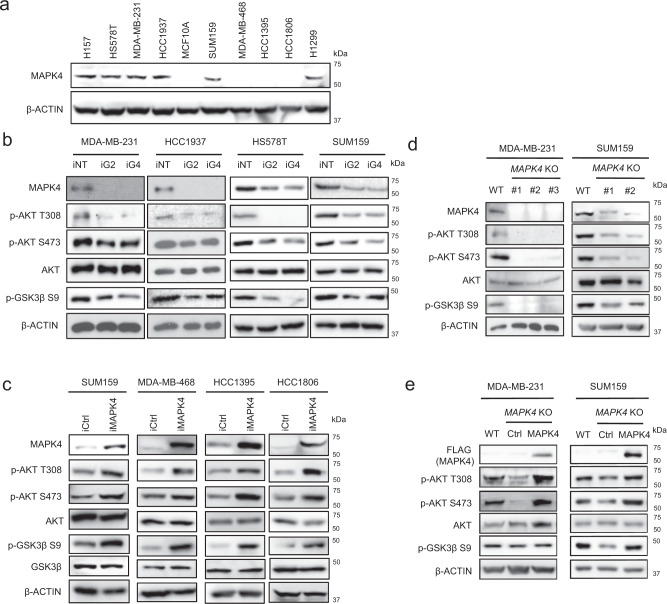
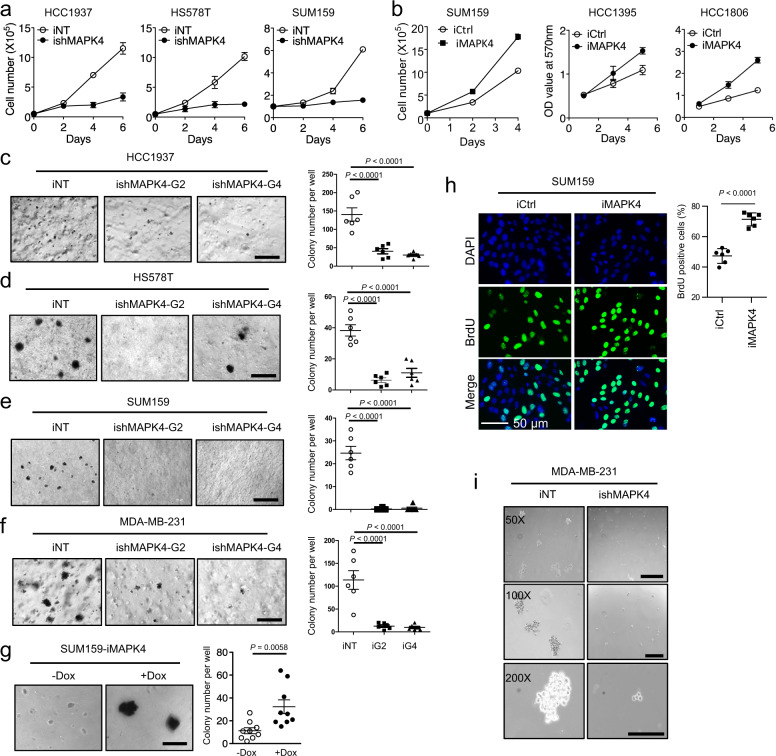
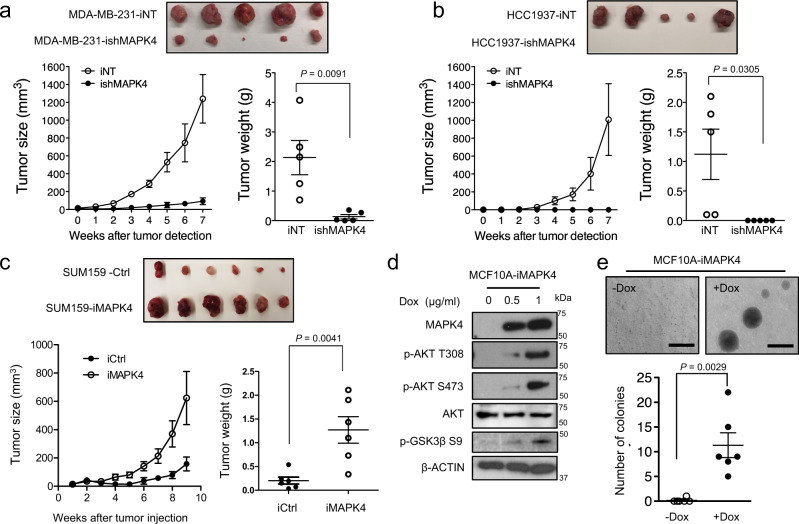
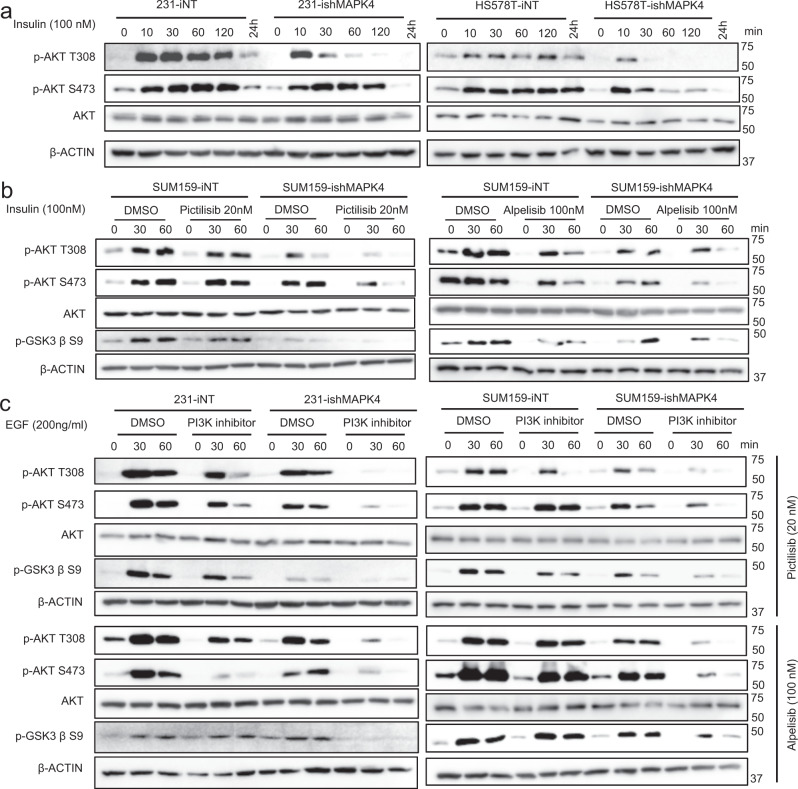
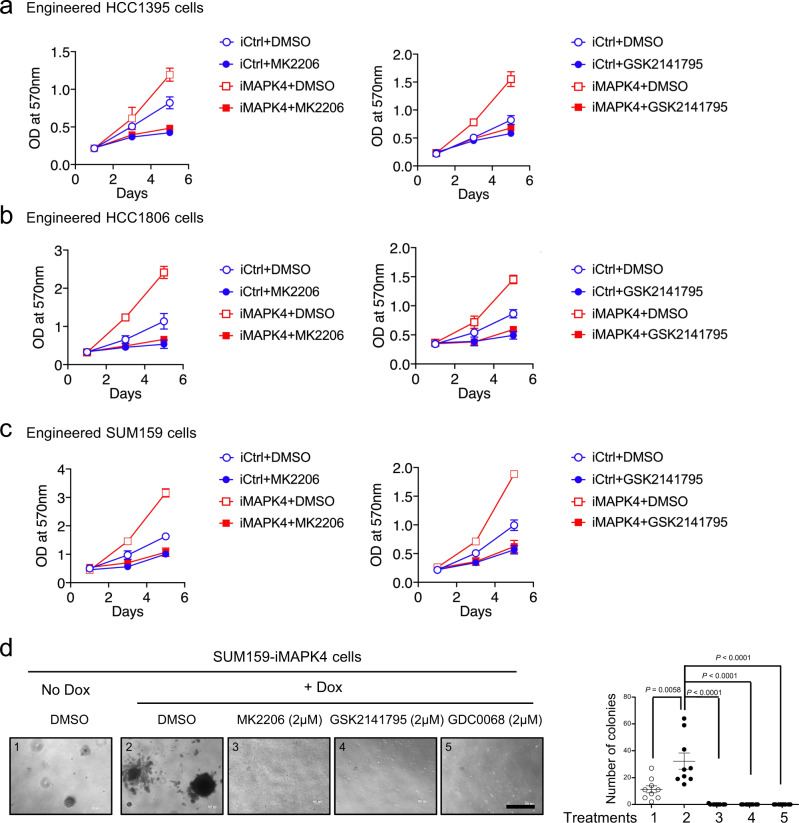
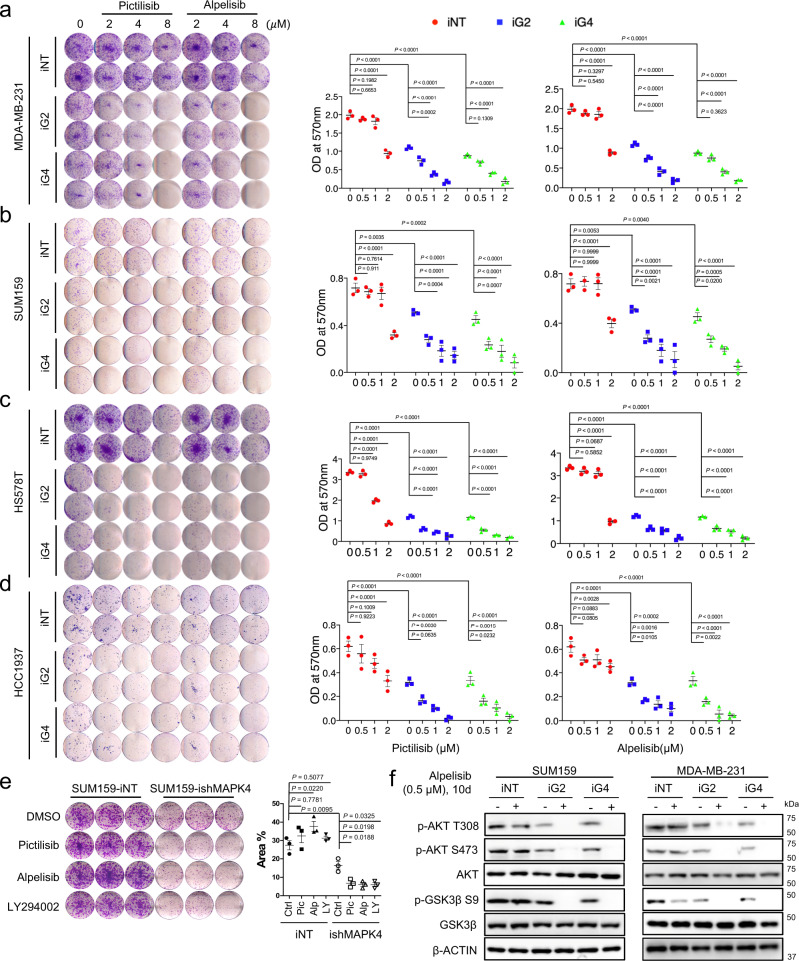
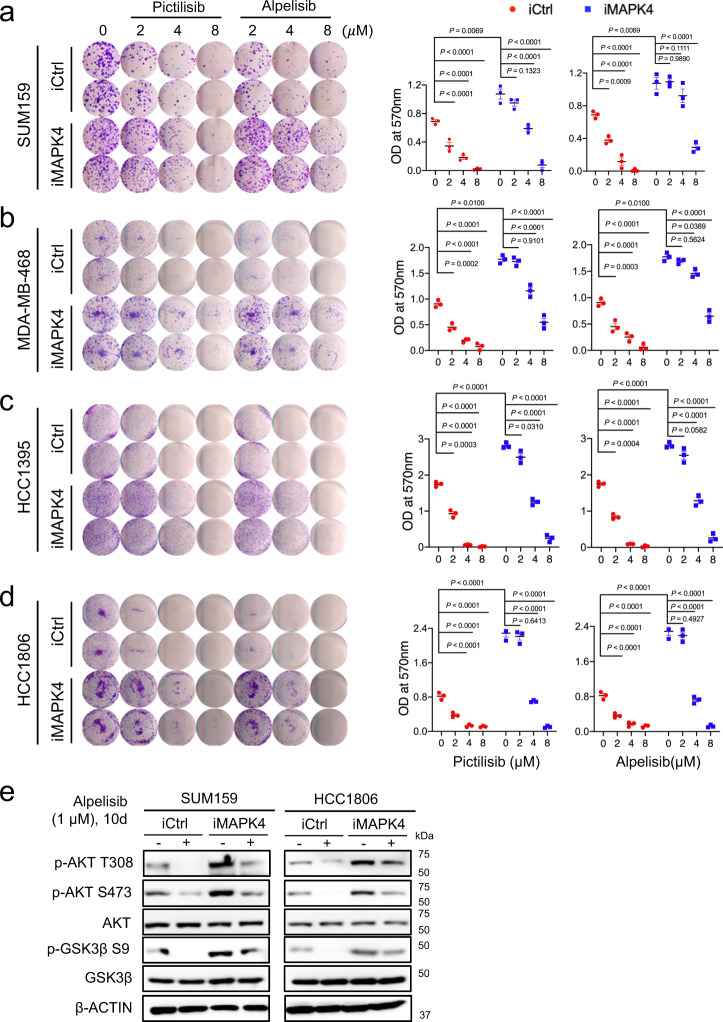
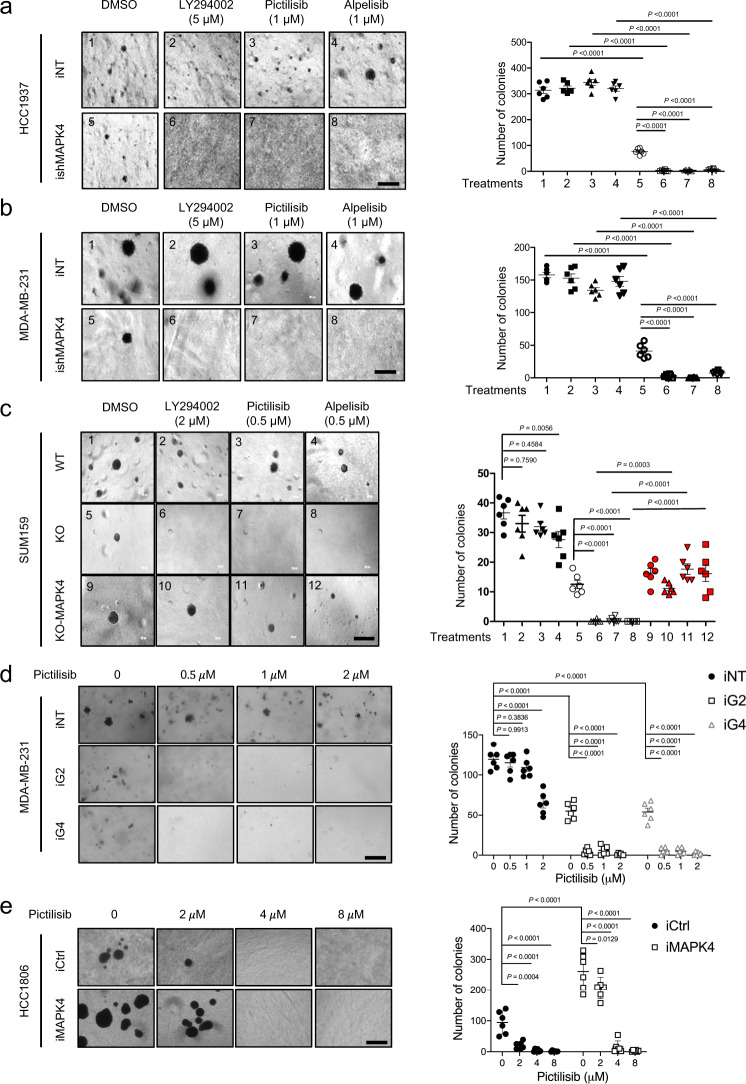
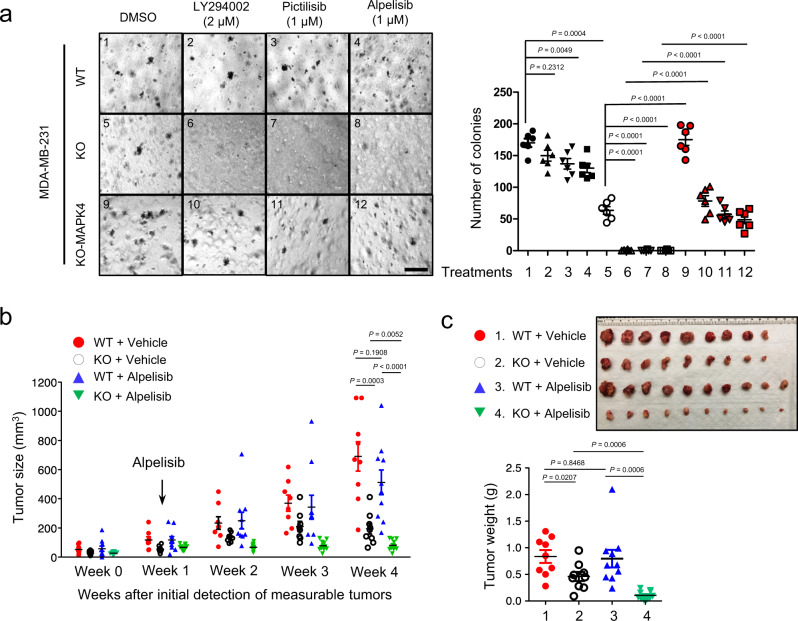
About 15-20% of breast cancer (BCa) is triple-negative BCa (TNBC), a devastating disease with limited therapeutic options. Aberrations in the PI3K/PTEN signaling pathway are common in TNBC. However, the therapeutic impact of PI3K inhibitors in TNBC has been limited and the mechanism(s) underlying this lack of efficacy remain elusive. Here, we demonstrate that a large subset of TNBC expresses significant levels of MAPK4, and this expression is critical for driving AKT activation independent of PI3K and promoting TNBC cell and xenograft growth. The ability of MAPK4 to bypass PI3K for AKT activation potentially provides a direct mechanism regulating tumor sensitivity to PI3K inhibition. Accordingly, repressing MAPK4 greatly sensitizes TNBC cells and xenografts to PI3K blockade. Altogether, we conclude that high MAPK4 expression defines a large subset or subtype of TNBC responsive to MAPK4 blockage. Targeting MAPK4 in this subset/subtype of TNBC both represses growth and sensitizes tumors to PI3K blockade.


Conflict of interest statement

M.T.L. is founder and limited partner in StemMed Ltd, and founder and manager in StemMed Holdings, its general partner. He also holds an equity stake in Tvardi Therapeutics Inc. The other authors declare no competing interests.

Figures

Fig. 1
Fig. 1. MAPK4 is highly expressed in a subset of basal-like BCa and TNBC.
a MAPK4 mRNA expression across 817 BCa from The Cancer Genome Atlas (TCGA). Boxplot represents 5% (lower whisker), 25% (lower box), 50% (median), 75% (upper box), and 95% (upper whisker). P value by two-sided t test on log2-transformed expression values. n represents independent patients. b, c MAPK4 mRNA expression across 92 BCa PDX models, including 69 TNBC PDX models. MAPK4 is markedly expressed (at around the 50th percentile of all genes expressed) in these PDX tumors (b). IHC was used for evaluating ER, PR, HER2 expression status within these tumors.
Fig. 2
Fig. 2. MAPK4 activates AKT in human TNBC cells.
a Western blots on MAPK4 expression in various human TNBC cell lines and MCF10A, a “normal” human mammary epithelial cell line. H157 and H1299 are human non-small cell lung cancer cell lines expressing high levels of MAPK4 as we previously reported. b Western blots on engineered MDA-MB-231, HCC1937, HS578T, and SUM159 cells with 4 μg/ml Dox-induced knockdown of MAPK4 (iG2, iG4) or control (iNT). c Western blots on engineered SUM159, MDA-MB-468, HCC1395, and HCC1806 cells with 0.5 μg/ml Dox-induced expression of MAPK4 (iMAPK4) or control (iCtrl). d CRISPR/Cas9 technology was used to knockout MAPK4 in MDA-MB-231 cells (clone# 1, 2, 3) and SUM159 cells (clone# 1, 2). Western blots were used to compare AKT phosphorylation and activation among these cells. e MAPK4 was ectopically expressed in the MDA-MB-231 MAPK4-knockout cells (clone# 3) and SUM159 MAPK4-knockout cells (clone# 2). Western blots were used to detect AKT phosphorylation and activation. Data are representative of at least three independent experiments.
Fig. 3
Fig. 3. MAPK4 promotes TNBC cell growth in vitro.
Proliferation assays comparing the growth of a engineered HCC1937, HS578T, and SUM159 cells with 4 μg/ml Dox-induced knockdown of MAPK4 (ishMAPK4) or control (iNT), and b SUM159, HCC1395, and HCC1806 cells with 0.5 μg/ml Dox-induced expression of MAPK4 (iMAPK4) or control (iCtrl). Soft-agar assays comparing the anchorage-independent growth of the engineered c HCC1937, d HS578T, e SUM159, f MDA-MB-231 cells with 4 μg/ml Dox-induced knockdown of MAPK4 (ishMAPK4-G2 or G4) or control (iNT), and g SUM159 cells with 0 or 0.5 μg/ml Dox-induced expression of MAPK4 (iMAPK4). Bar: 500 μm. h BrdU incorporation assays on the engineered SUM159 cells with 0.5 μg/ml Dox-induced ectopic expression of MAPK4 (iMAPK4) or control (iCtrl). Right panels in ch show data quantification. i Mammosphere assay on MDA-MB-231 cells with 4 μg/ml Dox-induced knockdown of MAPK4 (ishMAPK4) or control (iNT). Bar: 500 μm (50X), 200 μm (100X and 200X). Data are mean ± SEM (a, cg) and mean ± SD (b, h). P values determined by unpaired two-tailed Student’s t test and adjusted P values determined by one-way ANOVA followed by Dunnett’s multiple comparisons. Data are representative of at least three independent experiments. Source data are provided as a Source data file.
Fig. 4
Fig. 4. MAPK4 promotes TNBC xenograft growth in vivo.
Dox-induced knockdown of MAPK4 inhibits a MDA-MB-231 and b HCC1937 xenograft growth in SCID mice. c Dox-induced overexpression of MAPK4 promotes SUM159 xenograft growth in SCID mice. 2 × 106 of engineered MDA-MB-231 or HCC1937 cells with Dox-inducible knockdown of MAPK4 (ishMAPK4) or control (iNT), or engineered SUM159 with Dox-inducible ectopic expression of MAPK4 (iMAPK4) or control (iCtrl), were injected into the mammary fat pad of female SCID mice (iCtrl or iNT on the left side; iMAPK4 or ishMAPK4 on the right side). Mice began receiving Dox (0.2 mg/ml for SUM159 xenografts and 4 mg/ml for MDA-MB-231 and HCC1937 xenografts) in 1–10% sucrose in drinking water on the day of xenograft implantation. Tumors were harvested as indicated. d Western blots and e Soft-agar assays on engineered MCF10A cells with Dox-inducible MAPK4 expression. Dox concentration used are as indicated in (d) and 0.5 μg/ml in (e). Bar: 500 μm. Data are mean ± SEM. P values determined by unpaired two-tailed Student’s t test. Data are representative of at least three independent experiments. Source data are provided as a Source data file.
Fig. 5
Fig. 5. MAPK4 enhances insulin and EGF-induced AKT phosphorylation/activation independent of PI3K.
a MDA-MB-231 and HS578T cells with Dox-inducible knockdown of MAPK4 (ishMAPK4) or control (iNT) were induced with 4 μg/ml Dox for 3 days. The cells were then plated in 6-well plates. Twenty hours later, the cells were serum-starved overnight followed by treatments with 100 nM insulin for the indicated time (minutes). The cell lysates were then prepared and used in western blots. b Western blots on SUM159-ishMAPK4 and -iNT cells that were similarly treated as described above. These cells were also pre-treated with Pictilisib or DMSO control for 2 h before 100 nM insulin stimulation. c Western blots on MDA-MB-231 and SUM159 cells with Dox-inducible knockdown of MAPK4 (ishMAPK4) or control (iNT) that were similarly treated as described above. These cells were pre-treated with PI3K inhibitors Pictilisib, Alpelisib, or control for 2 h followed by 200 ng/ml EGF stimulation for the indicated time. Data are representative of at least three independent experiments.
Fig. 6
Fig. 6. AKT inhibition blocks MAPK4 tumor-promoting activity in TNBC.
Proliferation assays on the engineered a HCC1395, b HCC1806, and c SUM159 cells with 0.5 µg/ml Dox-induced expression of MAPK4 (iMAPK4) or control (iCtrl). The cells were also treated with 1 µM of the AKT inhibitors MK2206 (left) or GSK2141795 (right) or control. Data are mean ± SD. d Representative images and quantification of soft-agar assays on Dox-induced SUM159-iMAPK4 cells treated with AKT inhibitors MK2206, GSK2141795, GDC-0068, and DMSO control. Also shown are the control-treated SUM159-iMAPK4 cells without Dox induction. Bar: 500 μm. Data are mean ± SEM. P value by unpaired two-tailed Student’s t test. Data are representative of at least 3 independent experiments. Source data are provided as a Source data file.
Fig. 7
Fig. 7. Knockdown of MAPK4 sensitizes human TNBC cells to PI3K inhibitor treatments.
Representative images and quantification of colony formation assay data of engineered a MDA-MB-231, SUM159, c HS578T, and d HCC1937 cells with 4 µg/ml Dox-induced knockdown of MAPK4 (iG2, iG4) or control (iNT). The cells were also treated with increasing doses of Pictilisib, Alpelisib, or control. e Representative images and quantification of SUM159-iNT and -ishMAPK4 cells in the colony formation assays. The cells were treated for 10 days with PI3K inhibitors Pictilisib (1 µM), Alpelisib (0.5 µM), LY294002 (2 µM), or DMSO. The right panels in ae show quantification of colonies formed under each treatment condition described in the left panels. Data are mean ± SD (ad) and mean ± SEM (e). Adjusted P values determined by two-way ANOVA followed by Sidak’s multiple comparisons. f Western blots on SUM159 and MDA-MB-231 cells with 4 µg/ml Dox-induced knockdown of MAPK4 (iG2, iG4) or control (iNT) cells after 10 days culturing in the presence of Alpelisib (+) or DMSO (−). Data are representative of at least three independent experiments. Source data are provided as a Source data file.
Fig. 8
Fig. 8. Ectopic expression of MAPK4 reduces human TNBC cell sensitivity to PI3K inhibitor treatments.
Representative images and quantification of colony formation assay data of engineered a SUM159, b MDA-MB-468, c HCC1395, and d HCC1806 cells with 0.5 µg/ml Dox-induced ectopic expression of MAPK4 (iMAPK4) or control (iCtrl). The cells were also treated with increasing doses of Pictilisib, Alpelisib, or control. The right panels show quantification of colonies formed under each treatment condition described in the left panels. Data are mean ± SD. Adjusted P values determined by two-way ANOVA followed by Sidak’s multiple comparisons. e Western blots on SUM159 and HCC1806 cells with 0.5 µg/ml Dox-induced ectopic expression of MAPK4 (iMAPK4) or control (iCtrl) cells after 10 days culturing in the presence of Alpelisib (+) or DMSO (−). Data are representative of at least three independent experiments. Source data are provided as a Source data file.
Fig. 9
Fig. 9. MAPK4 profoundly affects the anchorage-independent growth of TNBC cells and their response to PI3K inhibitor treatments.
Representative images and quantification of soft-agar assay data of engineered a Dox-induced HCC1937-iNT and -ishMAPK4, b Dox-induced MDA-MB-231-iNT and -ishMAPK4, and c wild type (WT) and MAPK4-knockout (KO, clone #2) SUM159 cells, as well as MAPK4-KO SUM159 cells with ectopic expression of MAPK4 (KO-MAPK4). The cells were also treated with PI3K inhibitors LY294002, Pictilisib, Alpelisib at the indicated concentrations, or vehicle control (DMSO). Representative images and quantification of soft-agar assay data of engineered d MDA-MB-231 cells with 4 µg/ml Dox-induced knockdown of MAPK4 (iG2, iG4) or control (iNT), and e HCC1806 cells with 0.5 µg/ml Dox-induced overexpression of MAPK4 (iMAPK4) or control (iCtrl). The cells were also treated with increasing dosages of Pictilisib at indicated concentrations. The right panels show quantification of colonies formed under each treatment condition described/numbered in the left panels. Bar: 500 μm. Data are mean ± SEM (ac) or mean ± SD (d, e). Adjusted P values determined by two-way ANOVA followed by Sidak’s multiple comparisons. Data are representative of at least three independent experiments. Source data are provided as a Source data file.
Fig. 10
Fig. 10. Knockout of MAPK4 sensitizes MDA-MB-231 cells and xenografts to PI3K inhibition.
a Soft-agar assays for anchorage-independent growth of wild type (WT) and MAPK4-knockout (KO, clone #3) MDA-MB-231 cells, as well as MAPK4-KO MDA-MB-231 cells with ectopic expression of MAPK4 (KO-MAPK4), in the presence of PI3K inhibitors LY294002, Pictilisib, Alpelisib, or vehicle control (DMSO). Bar: 500 μm. The right panels show quantification (mean ± SEM) of colonies formed under each treatment condition described/numbered in the left panels. Adjusted P values determined by two-way ANOVA followed by Sidak’s multiple comparisons. Data are representative of at least three independent experiments. b The weekly measurement of the growth (sizes) of wild type (WT) and MAPK4-knockout (KO) MDA-MB-231 xenograft tumors with 3-week continuous treatments of Alpelisib (daily oral gavage at 20 mg/kg) or Vehicle. Week 0 indicates the initial time point when measurable xenografts were detected. Arrow indicates beginning of Alpelisib treatment one week after tumor detection. c Xenograft tumors and tumor weights at collection. Xenograft tumor data are representative of two independent experiments. Data are mean ± SEM. P values determined by unpaired two-tailed Student’s t test. Source data are provided as a Source data file.

References

    1. Whitman M, Kaplan DR, Schaffhausen B, Cantley L, Roberts TM. Association of phosphatidylinositol kinase activity with polyoma middle-T competent for transformation. Nature. 1985;315:239–242. doi: 10.1038/315239a0. - DOI - PubMed
    1. Auger KR, Serunian LA, Soltoff SP, Libby P, Cantley LC. PDGF-dependent tyrosine phosphorylation stimulates production of novel polyphosphoinositides in intact cells. Cell. 1989;57:167–175. doi: 10.1016/0092-8674(89)90182-7. - DOI - PubMed
    1. Franke TF, et al. The protein kinase encoded by the Akt proto-oncogene is a target of the PDGF-activated phosphatidylinositol 3-kinase. Cell. 1995;81:727–736. doi: 10.1016/0092-8674(95)90534-0. - DOI - PubMed
    1. Zoncu, R., Efeyan, A. & Sabatini, D. M. mTOR: from growth signal integration to cancer, diabetes and ageing. Nat. Rev. Mol. Cell Biol.12, 21–35 (2011). - PMC - PubMed
    1. Sarbassov DD, Guertin DA, Ali SM, Sabatini DM. Phosphorylation and regulation of Akt/PKB by the rictor-mTOR complex. Science. 2005;307:1098–1101. doi: 10.1126/science.1106148. - DOI - PubMed

Publication types

MeSH terms

Substances