. 2022 Jan 11;8(1):2.
doi: 10.1038/s41522-021-00265-w.

Gut microbiome development in early childhood is affected by day care attendance

Affiliations

Gut microbiome development in early childhood is affected by day care attendance

Amnon Amir et al. NPJ Biofilms Microbiomes. .

Abstract

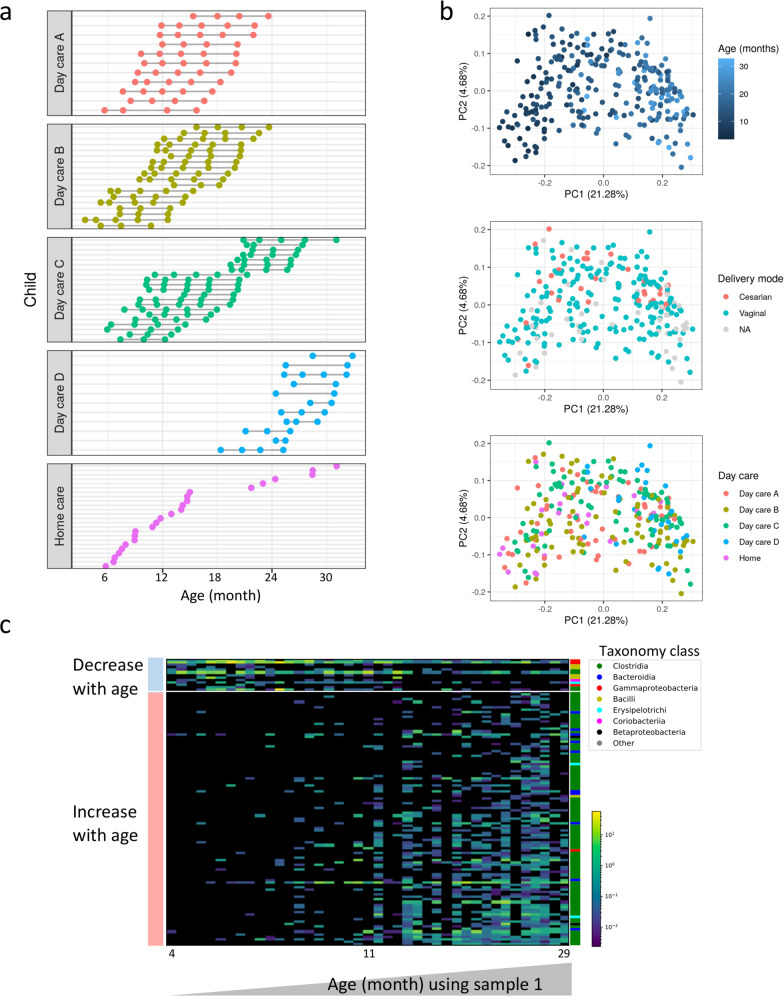
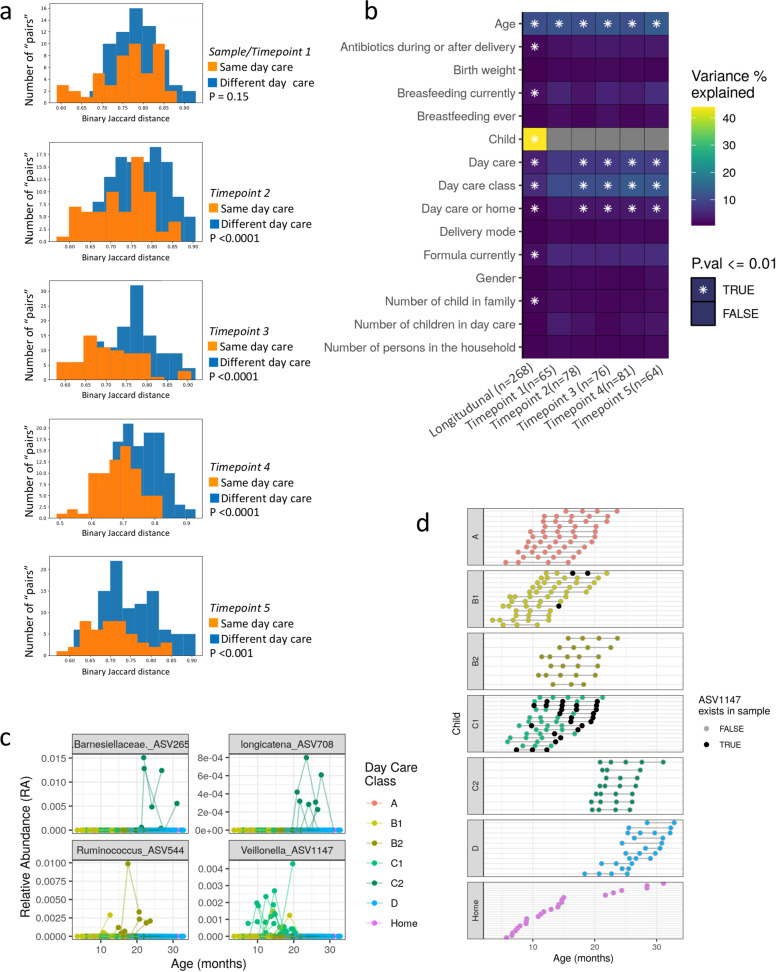
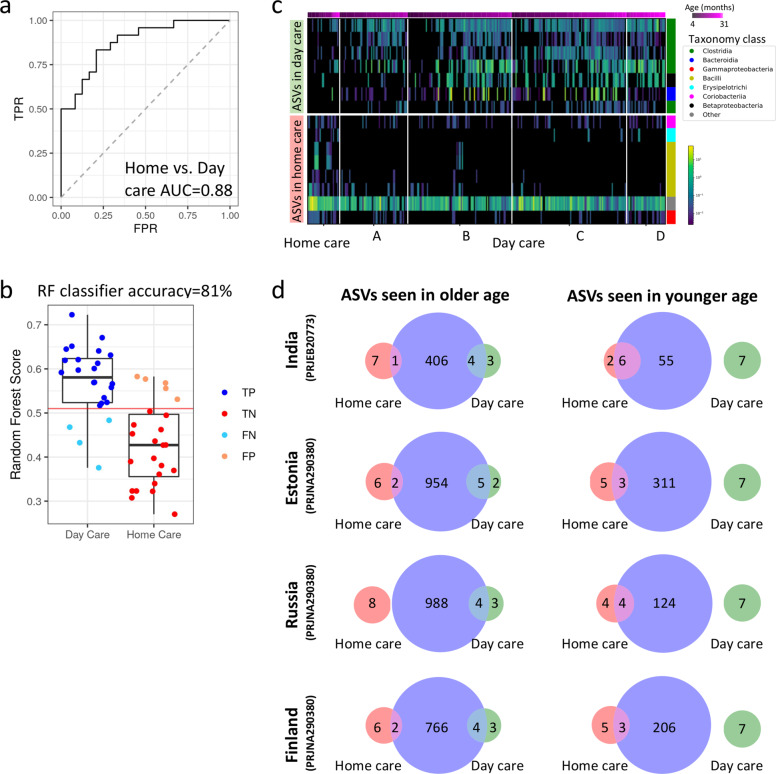
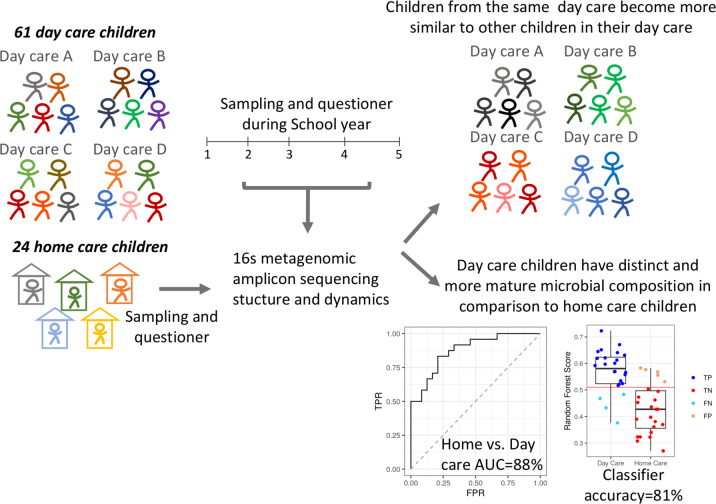
The human gut microbiome develops during the first years of life, followed by a relatively stable adult microbiome. Day care attendance is a drastic change that exposes children to a large group of peers in a diverse environment for prolonged periods, at this critical time of microbial development, and therefore has the potential to affect microbial composition. We characterize the effect of day care on the gut microbial development throughout a single school year in 61 children from 4 different day care facilities, and in additional 24 age-matched home care children (n = 268 samples, median age of entering the study was 12 months). We show that day care attendance is a significant and impactful factor in shaping the microbial composition of the growing child, the specific daycare facility and class influence the gut microbiome, and each child becomes more similar to others in their day care. Furthermore, in comparison to home care children, day care children have a different gut microbial composition, with enrichment of taxa more frequently observed in older populations. Our results provide evidence that daycare may be an external factor that contributes to gut microbiome maturation and make-up in early childhood.


Conflict of interest statement

The authors declare no competing interests.

Figures

Fig. 1
Fig. 1. Longitudinal cohort of 61 children starting day care, and additional age-match home care children.
a Each row corresponds to an enrolled child with longitudinal fecal sampling. Stool samples were collected within the first 2 weeks after each child started persistent day care attendance (sample or time point 1), and after 2 months (time point 2), 4 (time point 3), 7 (time point 4), and 10 months (time point 5) during the same school year. b Unweighted UniFrac PCoA plots colored by age, mode of delivery, and day care or home care of the 268 samples included in our study. c A heatmap representing 116 amplicon sequence variants (ASVs) that showed significant correlation with age in day care children using the first sample obtained within the first 2 weeks after each child started persistent day care attendance (Spearman correlation r > 0.3, dsFDR < 0.1). Each row represents a different ASV and each column a different sample. Samples are ordered by age, ASVs ordered by the effect size, color bar on the right indicates ASVs taxonomy class. Source data are provided as a Source Data file.
Fig. 2
Fig. 2. Specific day care is a significant contributor to gut microbial composition in early childhood.
a Binary Jaccard distance was calculated between pairs of age-matched children (born within up to 1 month apart). Distances are shown for age-matched children pairs participating in the same day care (orange) or a different day care facility (blue), showing that from the second sampling onward, age-matched pairs from the same day care share more of their microbiome in comparison to pairs from different day care facilities. P-values for differences between same and different day care pairs were calculated using a two-sided Mann–Whitney test. b PERMANOVA shows that inter-individual variation explains most (44%) of the variation when using longitudinal sampling, followed by age (11%), day care class (6%), and day care facility (4%) (left most column). The effect of day care facility and class is further noted when examining each sampling point separately, where the variation explained by day care class increases to 12% in the fourth and fifth sampling point. Stars show statistical significance (*P ≤ 0.01). Variance is estimated for each feature independently, while accounting for age, gender, and subject when needed (see Methods section). Total n is shown in brackets. c Age against relative abundance of 4 ASVs significantly associated with day care class in the maaslin2 analysis (see Methods section). Barnesiellaceae appeared in 4 of the 7 children in day care C class 2, and in none of the other children. Longicatena also appeared in 4 of the 7 children in day care C class 2, and in none of the other children (not the same 4 children as Barnesiellaceae). Veillonella appeared in 12 of the 14 children in day care C class 1, and in additional 2 children from day care B class 1. Lastly, Ruminococcus appeared in 4 of the 12 children in day care B class 1, and in 4 of the 6 children in day care B class 2, and in none of the other day cares. d A cohort figure showing all children from specific day care classes over age, similar to Fig. 1a. Samples positive to Veillonella (ASV1147, Supplementary Data Source) are marked in a black circle. Source data are provided as a Source Data file.
Fig. 3
Fig. 3. Day care children show a distinct and more mature microbial composition in comparison to age-matched home care children.
a ROC curve of random forest result, differentiating between 24 home care and 24 age-matched day care samples, with an AUC of 0.88. b Random forest out of bag (OOB) score for day care and home care samples with a Youden point threshold of 0.51 (see Methods). True positive (TP), true negative (TN), false positive (FP) and false negative (FN) classification results are colored. c A heatmap showing ASVs with significant differential abundance between home care and age-matched day care children samples (paired rank-mean test with dsFDR < 0.1 multiple hypothesis correction, see methods). Each row represents a different ASV (7 ASVs more abundant in day care and 8 more abundant in home care) and each column a different sample. Samples within each day care facility are ordered by age, ASVs are ordered by the effect size, and color bar on the right indicates ASVs taxonomy class. d Venn diagram showing overlap between the 7 day care and 8 home care associated ASVs from panel c (green and red circles respectively) with age younger/older age associated ASVs (blue circle in right and left columns respectively) identified from other cohorts [PRJNA290380], PRJEB20773] - see Methods section for additional details), emphasizing significant larger overlap of home care enriched ASVs with younger subjects (χ2 p < 0.05) in contrast to day care enriched ASVs that show a more substantial overlap with older subjects. Source data are provided as a Source Data file.
Fig. 4
Fig. 4. Cartoon highlighting the results implicating that day care environment is a significant factor impacting microbial dynamics in the second and third year of life.
The specific day care facility is shaping the growing child’s microbial composition, with each child becoming distinct and more similar to his classmates. Furthermore, when comparing to home care children, day care children have distinct and more mature microbial composition with enrichment of taxa more frequently seen in older populations.

References

    1. Yatsunenko T, et al. Human gut microbiome viewed across age and geography. Nature. 2012;486:222–227. - PMC - PubMed
    1. Stewart CJ, et al. Temporal development of the gut microbiome in early childhood from the TEDDY study. Nature. 2018;562:583–588. doi: 10.1038/s41586-018-0617-x. - DOI - PMC - PubMed
    1. Yassour M, et al. Strain-level analysis of mother-to-child bacterial transmission during the first few months of life. Cell Host Microbe. 2018;24:146–154.e144. - PMC - PubMed
    1. Gensollen T, Blumberg RS. Correlation between early-life regulation of the immune system by microbiota and allergy development. J. Allergy Clin. Immunol. 2017;139:1084–1091. doi: 10.1016/j.jaci.2017.02.011. - DOI - PMC - PubMed
    1. Zheng DP, Liwinski T, Elinav E. Interaction between microbiota and immunity in health and disease. Cell Res. 2020;30:492–506. doi: 10.1038/s41422-020-0332-7. - DOI - PMC - PubMed

Publication types