. 2022 Jan 11;13(1):231.
doi: 10.1038/s41467-021-27936-8.

Cancer cell-expressed BTNL2 facilitates tumour immune escape via engagement with IL-17A-producing γδ T cells

Affiliations

Cancer cell-expressed BTNL2 facilitates tumour immune escape via engagement with IL-17A-producing γδ T cells

Yanyun Du et al. Nat Commun. .

Abstract

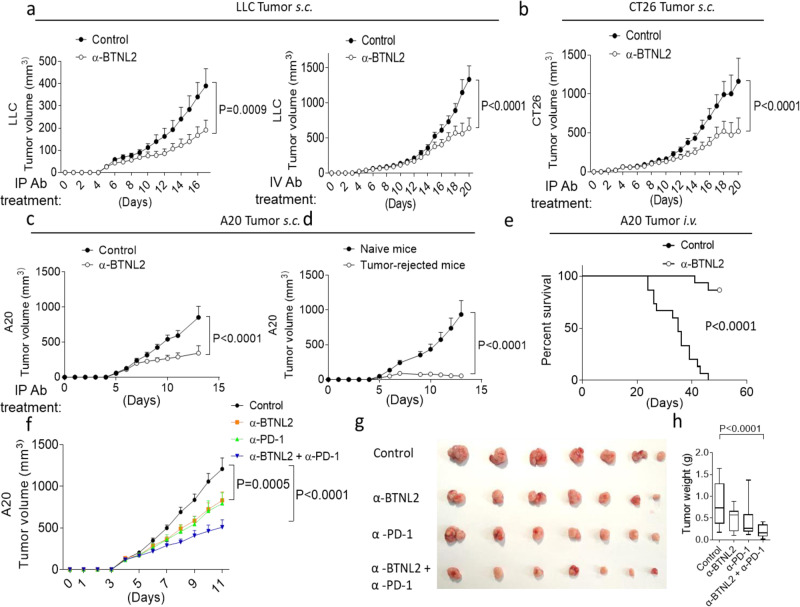
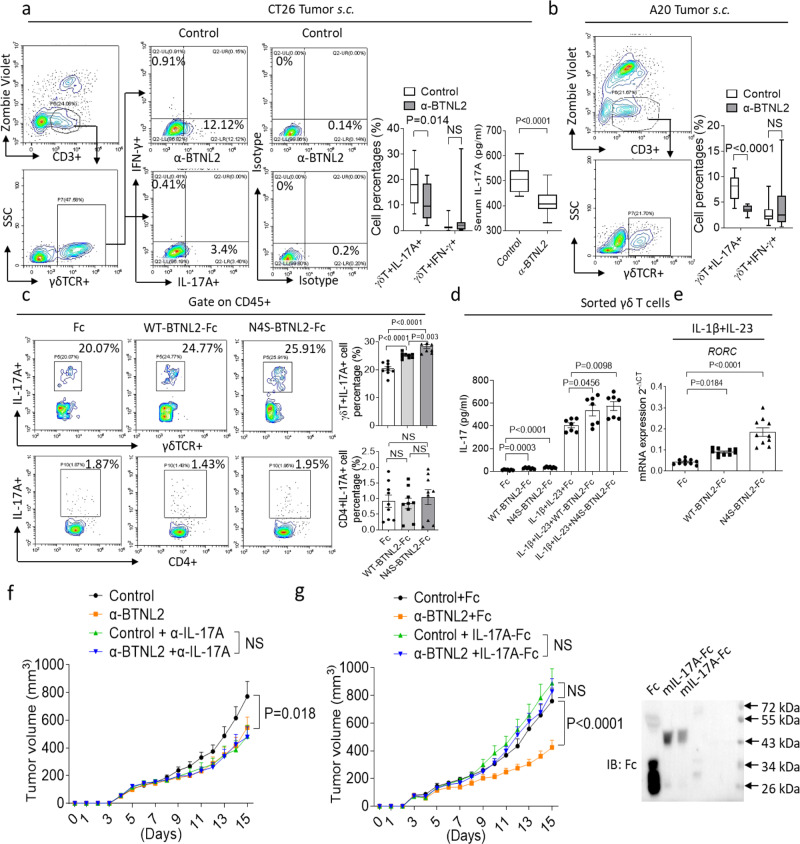
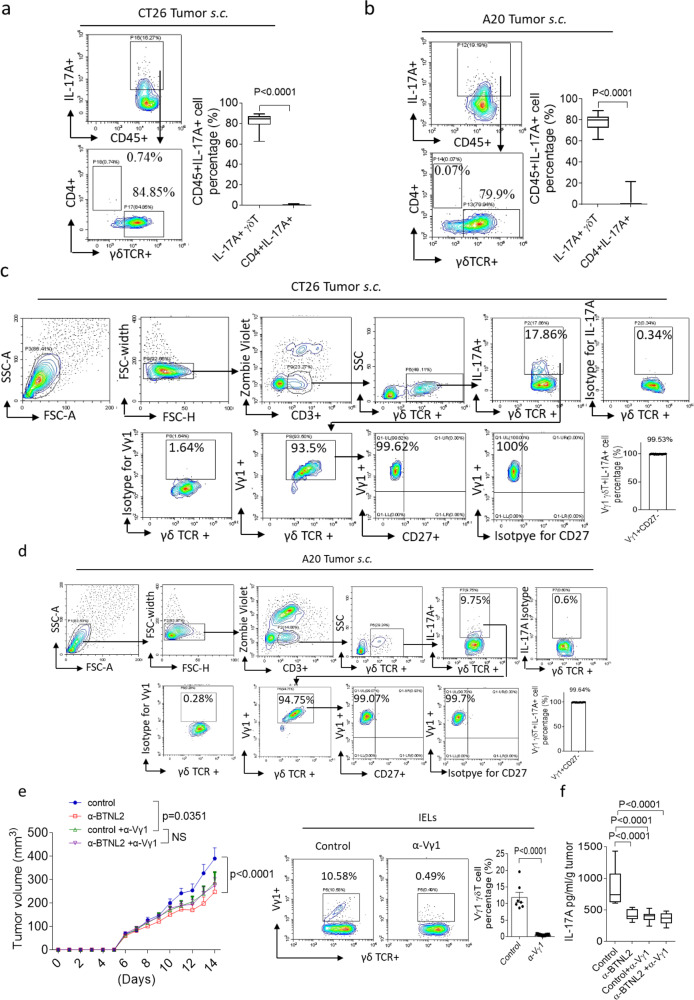
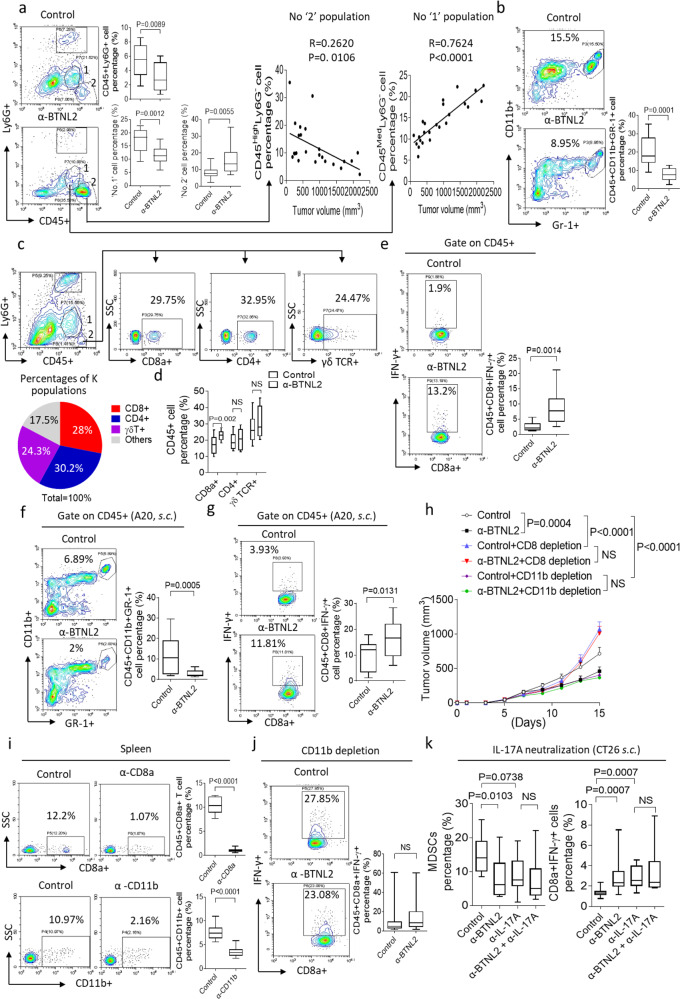
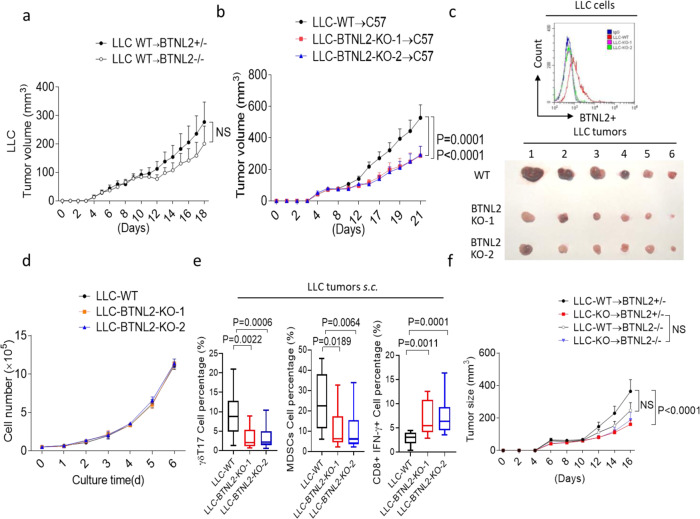
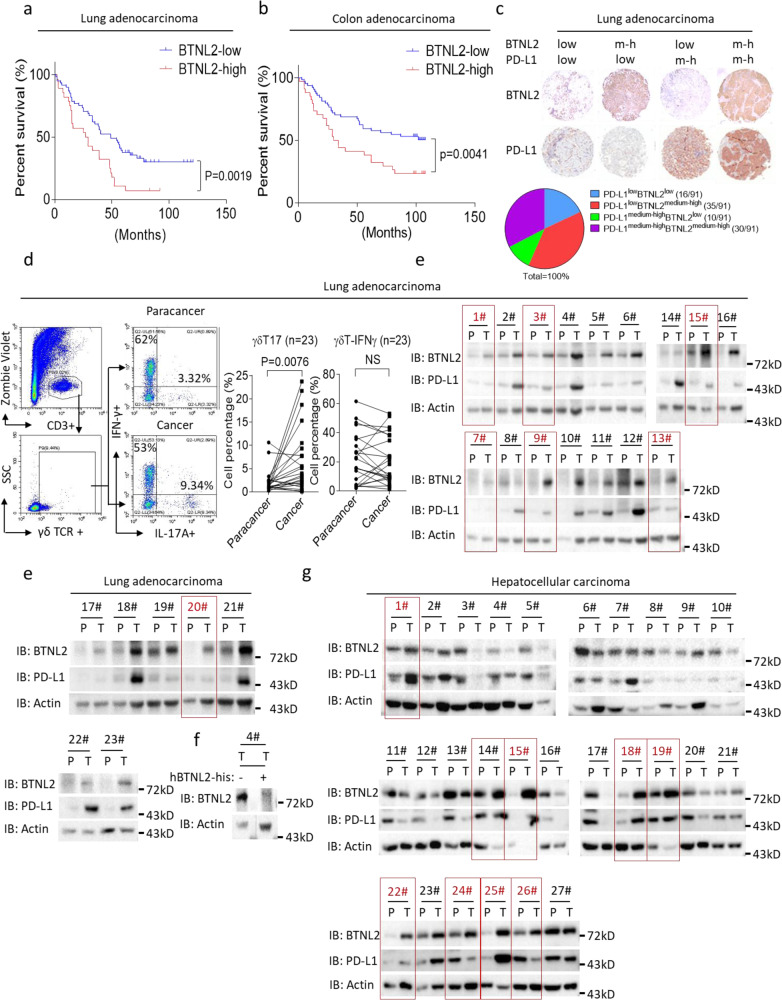
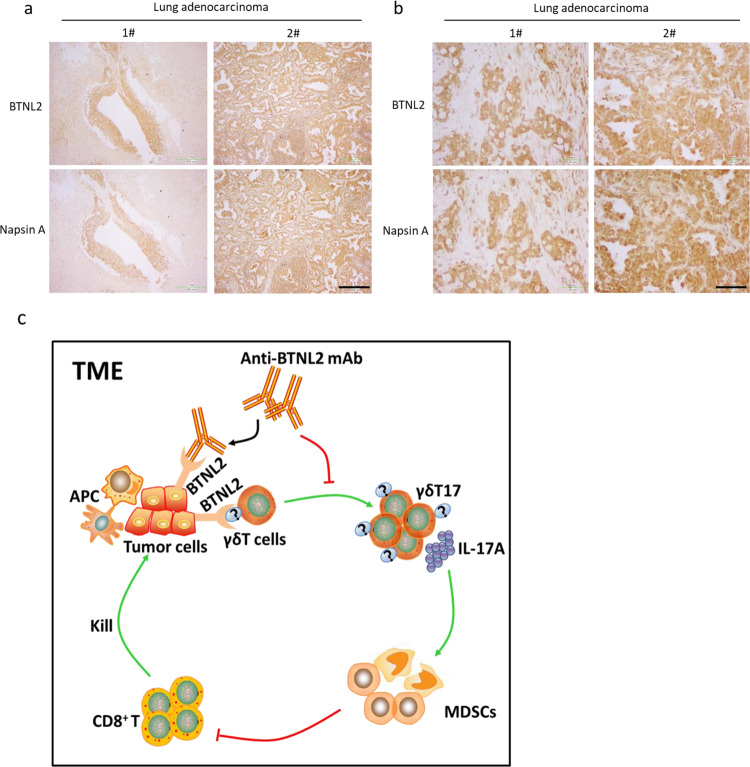
Therapeutic blockade of the immune checkpoint proteins programmed cell death protein 1 (PD-1) and cytotoxic T lymphocyte antigen 4 (CTLA4) has transformed cancer treatment. However, the overall response rate to these treatments is low, suggesting that immune checkpoint activation is not the only mechanism leading to dysfunctional anti-tumour immunity. Here we show that butyrophilin-like protein 2 (BTNL2) is a potent suppressor of the anti-tumour immune response. Antibody-mediated blockade of BTNL2 attenuates tumour progression in multiple in vivo murine tumour models, resulting in prolonged survival of tumour-bearing mice. Mechanistically, BTNL2 interacts with local γδ T cell populations to promote IL-17A production in the tumour microenvironment. Inhibition of BTNL2 reduces the number of tumour-infiltrating IL-17A-producing γδ T cells and myeloid-derived suppressor cells, while facilitating cytotoxic CD8+ T cell accumulation. Furthermore, we find high BTNL2 expression in several human tumour samples from highly prevalent cancer types, which negatively correlates with overall patient survival. Thus, our results suggest that BTNL2 is a negative regulator of anti-tumour immunity and a potential target for cancer immunotherapy.


Conflict of interest statement

The authors declare no competing interests.

Figures

Fig. 1
Fig. 1. Anti-BTNL2 mAb has therapeutic effect for multiple tumours.
a Primary LLC tumour growth kinetics of mice after intraperitoneal injection of isotype rat IgG1 control Ab or anti-BTNL2 mAb (200 μg/mouse) (left panel) or intravenous injected of antibody (200 μg/mouse) (right panel) was shown. (n = 13, P = 0.0009 for left panel, and n = 14, P < 0.0001 for right panel). b, c Primary CT26 (b, n = 14 for each group, P < 0.0001) or A20 (c, n = 17 for each group, P < 0.0001) tumour growth kinetics of mice after intraperitoneal injection of antibody (200 μg/mouse) was shown. d Tumour free mice from anti-BTNL2 mAb treated group in c were re-implanted A20 tumours in the contralateral flank of mice, and tumour growth kinetics of mice was shown (n = 12 for each group, P < 0.0001). e Mice were intravenous injected 2 × 106 A20 tumour cells, followed by intraperitoneal injection of isotype control Ab or anti-BTNL2 mAb as described in the Materials and methods (n = 15 for each group, P < 0.0001) (200 μg/mouse). Mice survival was shown. f Primary A20 tumour growth kinetics of mice after intraperitoneal injection of control Ab, anti-BTNL2 mAb, anti-PD-1 mAb or anti-PD-1 mAb plus anti-BTNL2 mAb was shown. (200 μg/mouse of anti-BTNL2 mAb and 100 μg/mouse of anti-PD-1 mAb) (n = 13 for each group, P = 0.0005 for Control vs α-BTNL2, P < 0.0001 for Control vs α-BTNL2 + α-PD-1, 4 × 106 A20 cells were subcutaneously injected). g Tumour image from f was shown. h Tumour weight was shown (n = 13 for each group, P < 0.0001 for Control vs α-BTNL2 + α-PD-1, 4 × 106 A20 cells were subcutaneously injected). All data are mean ± s.e.m. *P < 0.05, **P < 0.01, ***P < 0.001, ****P < 0.0001 based on Two-way ANOVA for (a–d, f), Log-rank (Mantel-Cox) Test for (e) and one-way ANOVA for (h). Data are representative of three independent experiments (a–e) and two independent experiments (f–h).
Fig. 2
Fig. 2. Anti-BTNL2 mAb treatment decreases the tumour infiltration of γδT17 cells.
a, b After isotype control Ab or anti-BTNL2 mAb treatment (200 μg/mouse), infiltrated live CD3 + γδ T lymphocytes which producing IL-17A or IFN-γ in subcutaneous CT26 (a) and A20 (b) tumours were analyzed by flow cytometry as indicated (a, n = 15, P = 0.014 for γδT+IL-17A+ cell Percentages, NS for γδT+IFN-γ+ cell Percentages and b, n = 14, P < 0.0001 for γδT+IL-17A+ cell Percentages, NS for γδT+IFN-γ+ cell Percentages). Serum IL-17A was examined by ELISA (n = 15, P < 0.0001 for a). c Splenocytes were cultured in the presence of plate-coated Fc, WT-BTNL2-Fc or N4S-BTNL2-Fc recombinant proteins (10 μg/ml) for 48 h, followed by flow cytometry analysis of γδT17 and Th17 (cells were restimulated with Cell Activation Cocktail (with Brefeldin A) for 4 h, and were gated by live CD45+, n = 9, P < 0.0001 for Fc vs WT-BTNL2-Fc γδT+IL-17A+ cell Percentages, P < 0.0001 for Fc vs N4S-BTNL2-Fc γδT+IL-17A+ cell Percentages, P = 0.003 for WT-BTNL2-Fc vs N4S-BTNL2-Fc γδT+IL-17A+ cell Percentages, NS for CD4+IL-17A+ cell Percentages). d FACS sorted γδ T cells were cultured in the presence of plate-coated Fc, WT-BTNL2-Fc or N4S-BTNL2-Fc with or without IL-1β and IL-23 for 24 h. ELISA was performed to analyze IL-17A production (n = 7, P = 0.0003 for Fc vs WT-BTNL2-Fc, P < 0.0001 for Fc vs N4S-BTNL2-Fc, P = 0.0456 for IL-1β + IL-23+Fc vs IL-1β + IL-23+WT-BTNL2-Fc, P = 0.0098 for IL-1β + IL-23+Fc vs IL-1β + IL-23 + N4S-BTNL2-Fc). e FACS sorted γδ T cells were cultured in the presence of plate-coated Fc, WT-BTNL2-Fc or N4S-BTNL2-Fc together with IL-1β and IL-23 for 24 h, followed by real-time PCR analysis of RORC expression (n = 10, P = 0.0184 for Fc vs WT-BTNL2-Fc, P < 0.0001 for Fc vs N4S-BTNL2-Fc). f IL-17A were neutralized by neutralizing antibody described in the Methods (100 μg/mouse), and CT26 tumour growth kinetics was shown (n = 16 for each group, P = 0.018). g Primary CT26 tumour growth kinetics of mice after intraperitoneal injection of control Ab or anti-BTNL2 mAb (200 μg/mouse) together with Fc or IL-17A-Fc recombinant proteins was shown. (n = 15 for each group, P < 0.0001). Fc or IL-17A-Fc recombinant proteins (5 μg/mouse) were intraperitoneal injected at day 1, 4, 7, 10 and 13 after tumour implantation. Right panel indicates the purified Fc and IL-17A-Fc recombinant proteins analyzed by western blot. All data are mean ± s.e.m. *P < 0.05, **P < 0.01, ***P < 0.001, ****P < 0.0001 based on Mann–Whitney test for (a, b), one-way ANOVA for (c–e) and Two-way ANOVA for (f, g). Data are representative of three independent experiments.
Fig. 3
Fig. 3. Tumour-infiltrated IL-17A-producing cells were mainly Vγ1 γδ T cells.
a, b Infiltrated cells from subcutaneous tumour of CT26 and A20 were isolated, followed by flow cytometry analysis as indicated (n = 17, P < 0.0001). c, d Infiltrated cells from tumour of CT26 (c), A20 (d) were isolated, followed by flow cytometry analysis as indicated (n = 16 for c and n = 16 for d). e Vγ1 γδ T cells were depleted by neutralizing antibody described in the Methods (80 μg/mouse), and CT26 tumour growth kinetics was shown (n = 13 for each group, P = 0.0351 for control vs control+α-Vγ1, P < 0.0001 for control vs α-BTNL2, NS for control+α-Vγ1 vs α-BTNL2 + α-Vγ1). The depletion effect of Vγ1 γδ T cells in the IEL was shown in the right panel (n = 7, P < 0.0001). f CT26 tumours were processed as in e, and IL-17A secretion by TME-infiltrated cells was measured by ELISA (n = 12, P < 0.0001 for control vs α-BTNL2, control+α-Vγ1 and α-BTNL2 + α-Vγ1). All data are mean ± s.e.m. *P < 0.05, **P < 0.01, ***P < 0.001, ****P < 0.0001 based on two-sided Mann–Whitney test for (a, b), Two-way ANOVA for (e) and one-way ANOVA for (f). Data are representative of three independent experiments.
Fig. 4
Fig. 4. Anti-BTNL2 mAb treatment decreases the tumour infiltration of MDSCs.
a–e After isotype control Ab or anti-BTNL2 mAb treatment (200 μg/mouse), infiltrated cells in subcutaneous CT26 tumours were analyzed by flow cytometry as indicated (a, n = 12, P = 0.0089 for CD45+Ly6G+ cell percentage, P = 0.0012 for ‘No. 1’ cell percentage, P = 0.0055 for ‘No. 2’ cell percentage; b, n = 12, P = 0.0001; d, n = 13, P = 0.002 for CD8α+, NS for CD4+ and γδ TCR+; e, n = 13, P = 0.0014). c ‘No. 2’ cell population was further gated by CD4+, CD8+ or γδ TCR+, and the percentages of different cell populations were shown. f, g After isotype control Ab or anti-BTNL2 mAb treatment (200 μg/mouse), A20 tumour-infiltrated cell were isolated, followed by flow cytometry analysis (n = 15, P = 0.0005 for f, and n = 13, P = 0.0131 for g). h CD8+ T cells or CD11b + cells were depleted by neutralizing antibody as described in the Materials and methods (100 μg/mouse of anti-CD8 or anti-CD11b mAb were used), and CT26 tumour growth kinetics of isotype control Ab or anti-BTNL2 mAb treatment were shown (n = 16 for each group, P = 0.004 for control vs α-BTNL2, P < 0.0001 for control vs control+CD8 depletion and control vs control + CD11b depletion, NS for control+CD8 depletion vs α-BTNL2 + CD8 depletion and control+CD11b depletion vs α-BTNL2 + CD11b depletion). i CD8 + T cells or CD11b + cells were depleted by neutralizing antibody (100 μg/mouse), and splenocytes were analyzed by flow cytometry for CD8 + T cells and CD11b + cells (n = 10 and 16, P < 0.0001). j After CD11b cells depletion and control Ab or anti-BTNL2 mAb treatment (100 μg/mouse of anti-CD11b mAb and 200 μg/mouse of anti-BTNL2 mAb were used), infiltrated cells in subcutaneous CT26 tumours were analyzed by flow cytometry as indicated (n = 13 for each group, NS for control vs α-BTNL2). k After IL-17A neutralization and isotype control Ab or anti-BTNL2 mAb treatment (100 μg/mouse of anti-IL-17A mAb and 200 μg/mouse of anti-BTNL2 mAb were used), infiltrated cells in subcutaneous CT26 tumours were analyzed by flow cytometry as indicated (n = 15 for each group, P = 0.0103 for control vs α-BTNL2 MDSCs percentage, P = 0.0738 for control vs α-IL-17A MDSCs percentage, NS for α-IL-17A vs α-BTNL2 + α-IL-17A MDSCs percentage, P = 0.0007 for control vs α-BTNL2 and control vs α-IL-17A CD8α+IFN-γ+ cells percentage, NS for α-IL-17A vs α-BTNL2 + α-IL-17A CD8α+IFN-γ+ cells percentage). All data are mean ± s.e.m. *P < 0.05, **P < 0.01, ***P < 0.001, ****P < 0.0001 based on two-way ANOVA for h, Dunn’s multiple comparisons test for k, two-sided Mann–Whitney test for j and two-sided unpaired t-test for a–e, f, g, i. Data are representative of three independent experiments.
Fig. 5
Fig. 5. Tumour-expressed BTNL2 plays a major role for the anti-tumour immune escaping.
a Littermate control mice or BTNL2-KO mice were implanted WT LLC cells, and tumour growth kinetics of mice was shown (n = 12 for each group). b WT LLC cells or two clones of BTNL2-KO LLC cells were implanted subcutaneously in WT mice (3 × 105/mouse), and tumour growth kinetics was shown (n = 14 for each group, P = 0.0001 for LLC-WT vs LLC-BTNL2-KO-1 and P < 0.0001 for LLC-WT vs LLC-BTNL2-KO-2). c WT or BTNL2-KO LLC cells were analyzed by anti-BTNL2 mAb-2 for flow cytometry analysis (upper panel). Tumour image from b was shown (lower panel). d WT LLC cells or BTNL2-KO LLC cells were cultured in vitro for indicated times, and cell proliferation was shown by cell counting. e Cells from WT LLC tumours or BTNL2-KO LLC tumours were isolated, followed by the flow cytometry analysis (n = 14 for each group, P = 0.0022 for LLC-WT vs LLC-BTNL2-KO-1 γδT17 cell percentage and P = 0.0006 for LLC-WT vs LLC-BTNL2-KO-2 γδT17 cell percentage, P = 0.0189 for LLC-WT vs LLC-BTNL2-KO-1 MDSCs cell percentage and P = 0.0064 for LLC-WT vs LLC-BTNL2-KO-2 MDSCs cell percentage, P = 0.0011 for LLC-WT vs LLC-BTNL2-KO-1 CD8α+IFN-γ+ cells percentage and P = 0.0001 for LLC-WT vs LLC-BTNL2-KO-2 CD8α+IFN-γ+ cells percentage). f Littermate control mice or BTNL2-KO mice were implanted with WT or BTNL2-KO LLC cells, and tumour growth kinetics of mice was shown (n = 12 for each group, P < 0.0001 for control mice were implanted with WT vs BTNL2-KO LLC cells, NS for control mice or BTNL2-KO mice were implanted with BTNL2-KO LLC cells and control mice or BTNL2-KO mice were implanted with WT LLC cells). All data are mean ± s.e.m. *P < 0.05, **P < 0.01, ***P < 0.001, ****P < 0.0001 based on two-way ANOVA for a, b, d, f, and Dunn’s multiple comparisons test for e. Data are representative of three independent experiments.
Fig. 6
Fig. 6. BTNL2 expression in human cancers correlates with patient’s prognosis.
a, b Kaplan–Meier estimates of overall survival of lung adenocarcinoma (a) and colon adenocarcinoma patients b based on the expression level of BTNL2 (n = 91 for a and n = 99 for b). Comparison was made of groups with high BTNL2 expression (score ≥ 9) and low BTNL2 expression (score < 9) according to immunohistochemistry scoring system described in the Materials and methods. c The percentages of lung adenocarcinoma samples with different expression patterns of BTNL2 and PD-L1 were shown, and score ≥ 5 was considered medium to high expression, and score ≤ 4 was considered low expression. ‘m-h’ indicates medium to high expression level of BTNL2. d Cells were isolated from lung adenocarcinoma samples and para-cancerous samples (n = 23), and were stained as indicated for flow cytometry analysis. e Lysates from 23 pairs of cancer samples and para-cancerous samples from lung adenocarcinoma patients were analyzed by western blot, and probed for indicated proteins. The samples number with higher expression of BTNL2 but low expression of PD-L1 was marked as red. f The BTNL2 Ab which incubated with or without recombinant His-hBTNL2 proteins was probed with the cancer sample from no.4 patient, and western blot of BTNL2 was shown (lower panel). g Lysates from 27 pairs of cancer samples and para-cancerous samples from hepatocellular carcinoma patients were analyzed by western blot, and probed for indicated proteins. The samples numbers with higher expression of BTNL2 was marked as red. All data are mean ± s.e.m. *P < 0.05, **P < 0.01, ***P < 0.001, ****P < 0.0001 based on Log-rank (Mantel-Cox) test for a and b and two-sided Mann–Whitney test for d. Data in e–g are representative of three independent experiments.
Fig. 7
Fig. 7. BTNL2 was strongly expressed in some of PD-1 inhibitor treatment-resistant lung cancer samples.
a, b Immunohistochemistry staining of BTNL2 and Napsin A expression in lung adenocarcinoma samples was shown (serial section of slices was stained with anti-BTNL2 and anti- Napsin A). Scale bar = 202 μm for a, Scale bar = 50 μm for b. “P” represents para-cancerous tissue; “C” represents cancer tissue. c Sketch Map of BTNL2 blockage in the TME was shown, that tumour cell-expressed BTNL2 promotes γδT17 cells differentiation, which recruits MDSCs into TME to inhibit the cytotoxic function of CD8 + T cells. Blockage of BTNL2 by mAb abolishes the γδT17 cells differentiation and subsequent recruitment of MDSCs, which re-activates CD8 + T cells for the tumour-cytotoxic function. Data in a, b are representative of three independent experiments.

References

    1. Dong H, et al. Tumour-associated B7-H1 promotes T-cell apoptosis: a potential mechanism of immune evasion. Nat. Med. 2002;8:793–800. - PubMed
    1. Freeman GJ, et al. Engagement of the PD-1 immunoinhibitory receptor by a novel B7 family member leads to negative regulation of lymphocyte activation. J. Exp. Med. 2000;192:1027–1034. - PMC - PubMed
    1. Pardoll DM. The blockade of immune checkpoints in cancer immunotherapy. Nat. Rev. Cancer. 2012;12:252–264. - PMC - PubMed
    1. Sun C, Mezzadra R, Schumacher TN. Regulation and function of the PD-L1 checkpoint. Immunity. 2018;48:434–452. - PMC - PubMed
    1. Chen L, Han X. Anti-PD-1/PD-L1 therapy of human cancer: past, present, and future. J. Clin. Invest. 2015;125:3384–3391. - PMC - PubMed

Publication types

MeSH terms