. 2022 Jan 11;12(1):555.
doi: 10.1038/s41598-021-04505-z.

Automated prediction of the clinical impact of structural copy number variations

Affiliations

Automated prediction of the clinical impact of structural copy number variations

M Gažiová et al. Sci Rep. .

Abstract

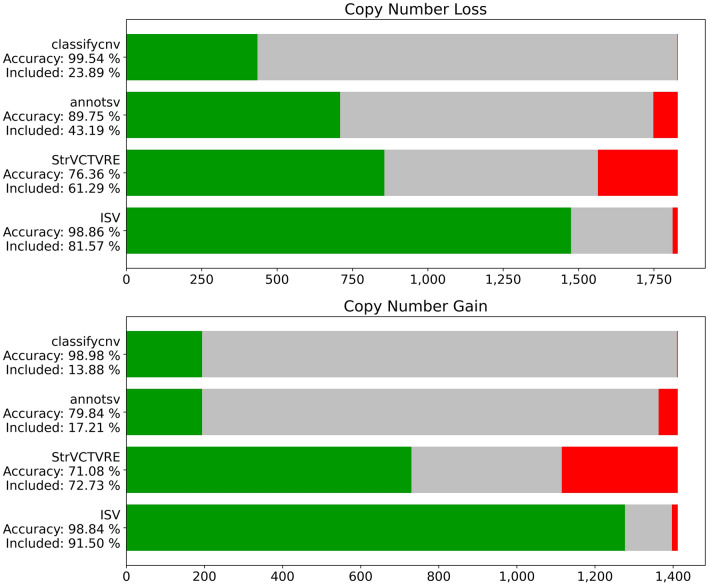
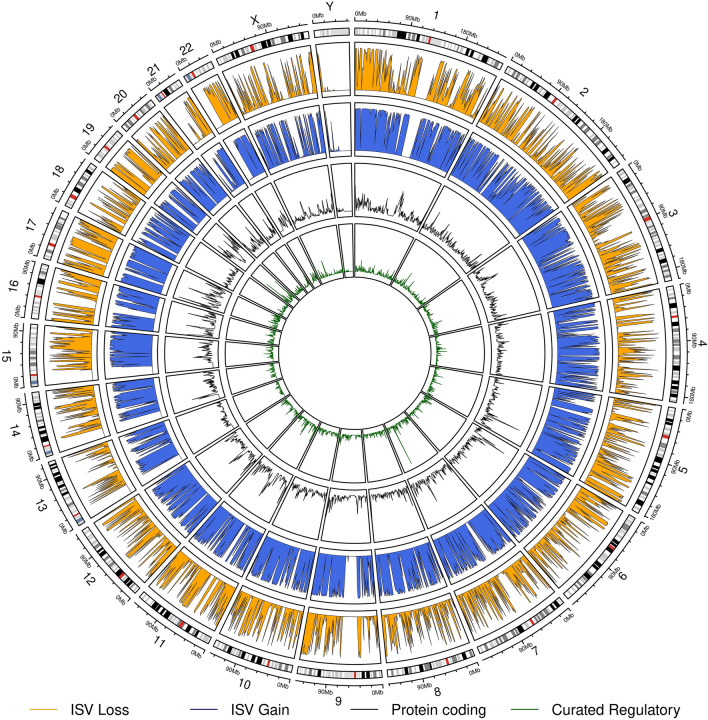
Copy number variants (CNVs) play an important role in many biological processes, including the development of genetic diseases, making them attractive targets for genetic analyses. The interpretation of the effect of these structural variants is a challenging problem due to highly variable numbers of gene, regulatory, or other genomic elements affected by the CNV. This led to the demand for the interpretation tools that would relieve researchers, laboratory diagnosticians, genetic counselors, and clinical geneticists from the laborious process of annotation and classification of CNVs. We designed and validated a prediction method (ISV; Interpretation of Structural Variants) that is based on boosted trees which takes into account annotations of CNVs from several publicly available databases. The presented approach achieved more than 98% prediction accuracy on both copy number loss and copy number gain variants while also allowing CNVs being assigned "uncertain" significance in predictions. We believe that ISV's prediction capability and explainability have a great potential to guide users to more precise interpretations and classifications of CNVs.


Conflict of interest statement

All authors are employees of Geneton Ltd., where they also participate in the development of a commercial application for the annotation and interpretation of CNV. The presented method was filed as a patent application under the number PCT/EP2020/025292. Apart from the above-mentioned, all authors have declared no conflicts of interest.

Figures

Figure 1
Figure 1
Diagram depicting used datasets and preprocessing steps. In all analyses, we only evaluated CNVs larger than 1 Kbps. CNVs with a multiplicity of 1 for losses and multiplicity of 3 for gains and smaller than 5 Mbps from ClinVar were used for training, validation of models, and basic testing for the final evaluation of the chosen model. CNVs with other multiplicity were used as an additional testing set [Testing (multiple)] as well as CNVs larger than 5 Mbps [Testing (> 5 Mbps)]. Furthermore, likely benign, likely pathogenic and CNVs of uncertain significance were also evaluated together with CNVs from the basic Testing set. Potentially benign variants were collected from the GnomAD database and pathogenic CNVs from DECIPHER and OMIM databases as additional evaluation sets (implemented with app.diagram.net).
Figure 2
Figure 2
A 2-dimensional representation of the training datasets. We used the tSNE algorithm implemented in the scikit-learn package with default hyperparameters. Each dot represents a CNV, either benign (green) or pathogenic (red) (implemented with matplotlib package, version 3.3.2).
Figure 3
Figure 3
Comparison of the predictive capability of five studied models at three different probability thresholds (validation dataset). In the top row, the models classify all CNVs as either benign or pathogenic. “Correctly” predicted CNVs (being in line with ClinVar classification; either benign or pathogenic) are in green, while “incorrectly” predicted ones (that means the prediction unmatching the ClinVar classification) are in red. The middle row and the bottom row allow for uncertain predictions (shown in gray) if the probability of pathogenicity is between (1 − Pct, Pct), where Pct is the probability threshold. The x-axis represents individual CNVs and corresponds to the sizes of the validation datasets. “Included” represents the percentage of CNVs evaluated by ISV with a clear outcome (with probabilities either above the probability threshold (Pct) or below 1 − Pct (implemented with matplotlib package, version 3.3.2 and pandas package, version 1.1.3).
Figure 4
Figure 4
Evaluation of ISV on CNVs with standard five-tier classification generally used for the classification of genomic variants in Mendelian diseases. Each CNV is represented by a dot while the color patterns reflect purely the five-tier ClinVar classification, i.e. neither the ISV prediction nor the “matching” status between ISV and ClinVar. The ISV prediction of pathogenicity is reflected on the y-axis while the value 1.0 means pathogenic prediction and 0.0 means benign prediction. Please note that these classes of variants are recommended by the respective ACMG/AMP guidelines. The sizes of datasets are provided in parentheses under the classification labels (implemented with seaborn package, version 0.11.0).
Figure 5
Figure 5
Numbers of correct (green), incorrect (red), and uncertain (gray) predictions on the test data. For ClassifyCNV and AnnotSV we treated likely benign and likely pathogenic predictions as uncertain significance. If we treated them as benign/pathogenic instead, we observed an increase in false predictions, while the added percentage of CNVs was not enough to categorize this as an improvement in the model’s performance (see Supplementary Fig. S11). The StrVCTVRE algorithm only classifies exonic CNVs, thus the ones shown as uncertain significance correspond to ones outside of exonic regions (implemented with matplotlib package, version 3.3.2 and pandas package, version 1.1.3).
Figure 6
Figure 6
Evaluation of ISV tool on gnomAD data. The x-axis represents the population frequencies of CNVs (black dots) with the ISV probability of pathogenicity on the y-axis. The figure shows that the majority of frequently occurring CNVs were classified as benign by ISV, while the ones with a higher probability of pathogenicity occur rarely (implemented with seaborn package, version 0.11.0).
Figure 7
Figure 7
Evaluation of pathogenic microdeletions and evaluation of pathogenic microduplications is stratified into two classes, showing that inclusion of critical region/gene may not be sufficient for correct prediction (implemented with seaborn package, version 0.11.0).
Figure 8
Figure 8
Force plot showing contributions of individual attributes towards the final prediction for a CNV causing Prader-Willi and Angelman syndrome (chr15:22760000–28560000). Bars represent individual attributes contributing to the prediction of this CNV with bar widths reflecting the strength of each attribute. In this case, all attributes contribute to the pathogenicity of the CNV, however, this will not always be the case. The base value represents the prior baseline value, from which the individual contributions are added/subtracted. If values of all attributes were equal to 0, the final prediction would be equal to the base value. Attributes are in order according to their strength in the prediction while “regulatory elements” being the most contributing genomic attribute. Hi-genes = haploinsufficient genes. The plot was constructed by utilizing functions from the SHAP package (version 0.37.0).
Figure 9
Figure 9
Circular genome plot with annotations by ISV. We divided the genome into 1 Mbp long non-overlapping CNVs and predicted their impact with ISV. The orange track shows probabilities of pathogenicity for copy number loss variants while the blue track shows this for copy number gain variants. The two inner tracks show the numbers of overlapped protein coding genes (black line) and overlapped curated regulatory elements (green line). The outer track shows the estimated chromosome bands according to the G-banding pattern. The plot was constructed using the R package circlize, version 0.4.2.

References

    1. Pös O, et al. Copy number variation: Methods and clinical applications. NATO Adv. Sci. Inst. Ser. E Appl. Sci. 2021;11:819.
    1. Pös O, et al. DNA copy number variation: Main characteristics, evolutionary significance, and pathological aspects. Biomed. J. 2021;44:548–559. doi: 10.1016/j.bj.2021.02.003. - DOI - PMC - PubMed
    1. Kucharik M, et al. Non-invasive prenatal testing (NIPT) by low coverage genomic sequencing: Detection limits of screened chromosomal microdeletions. PLoS One. 2020;15:e0238245. doi: 10.1371/journal.pone.0238245. - DOI - PMC - PubMed
    1. Nowakowska B. Clinical interpretation of copy number variants in the human genome. J. Appl. Genet. 2017;58:449–457. doi: 10.1007/s13353-017-0407-4. - DOI - PMC - PubMed
    1. Lupiáñez DG, et al. Disruptions of topological chromatin domains cause pathogenic rewiring of gene-enhancer interactions. Cell. 2015;161:1012–1025. doi: 10.1016/j.cell.2015.04.004. - DOI - PMC - PubMed