. 2022 Jan 11;5(1):41.
doi: 10.1038/s42003-021-02934-0.

Analysis of the glyco-code in pancreatic ductal adenocarcinoma identifies glycan-mediated immune regulatory circuits

Affiliations

Analysis of the glyco-code in pancreatic ductal adenocarcinoma identifies glycan-mediated immune regulatory circuits

Ernesto Rodriguez et al. Commun Biol. .

Abstract

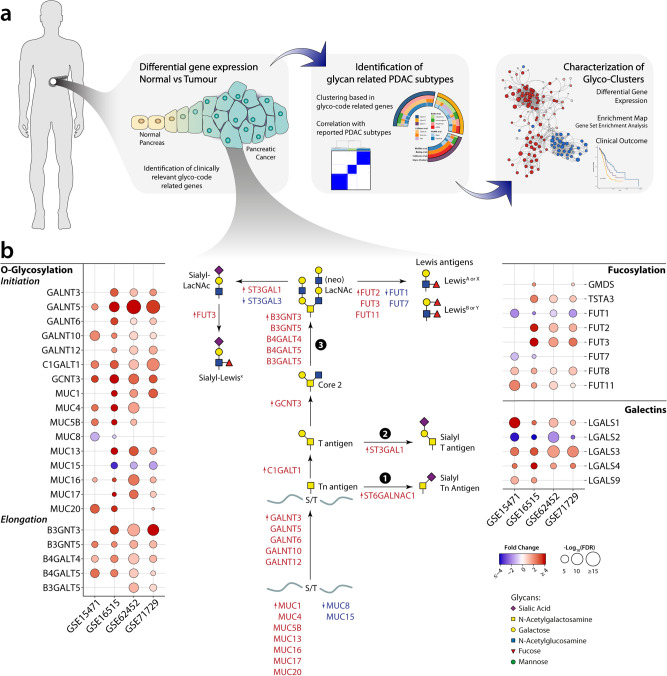
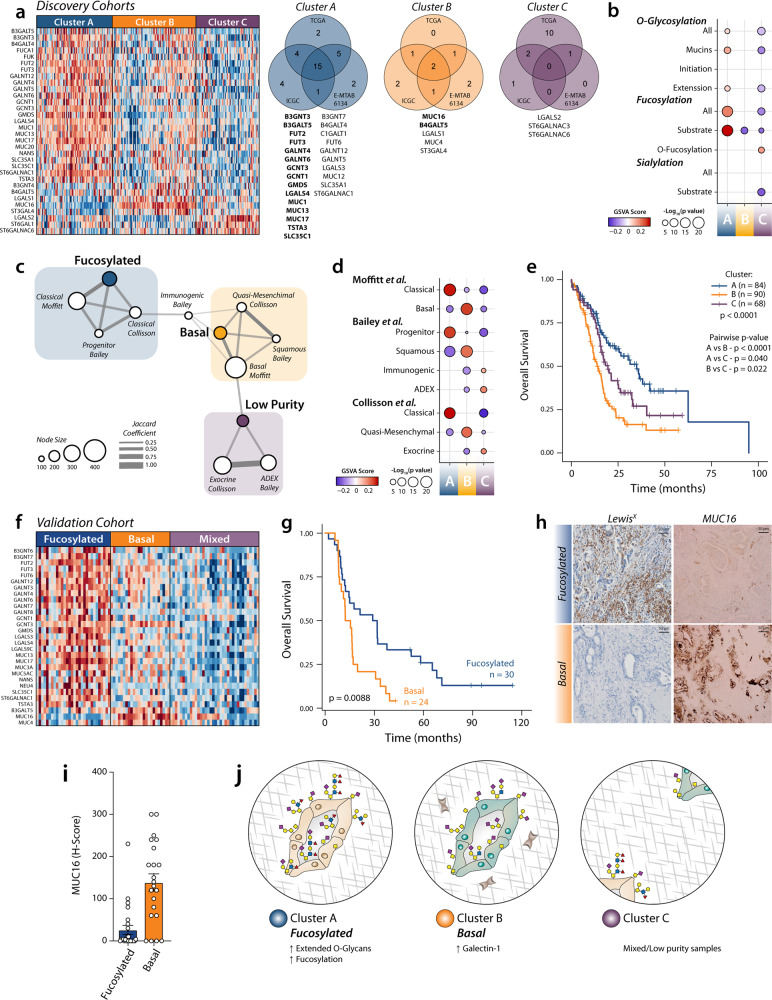
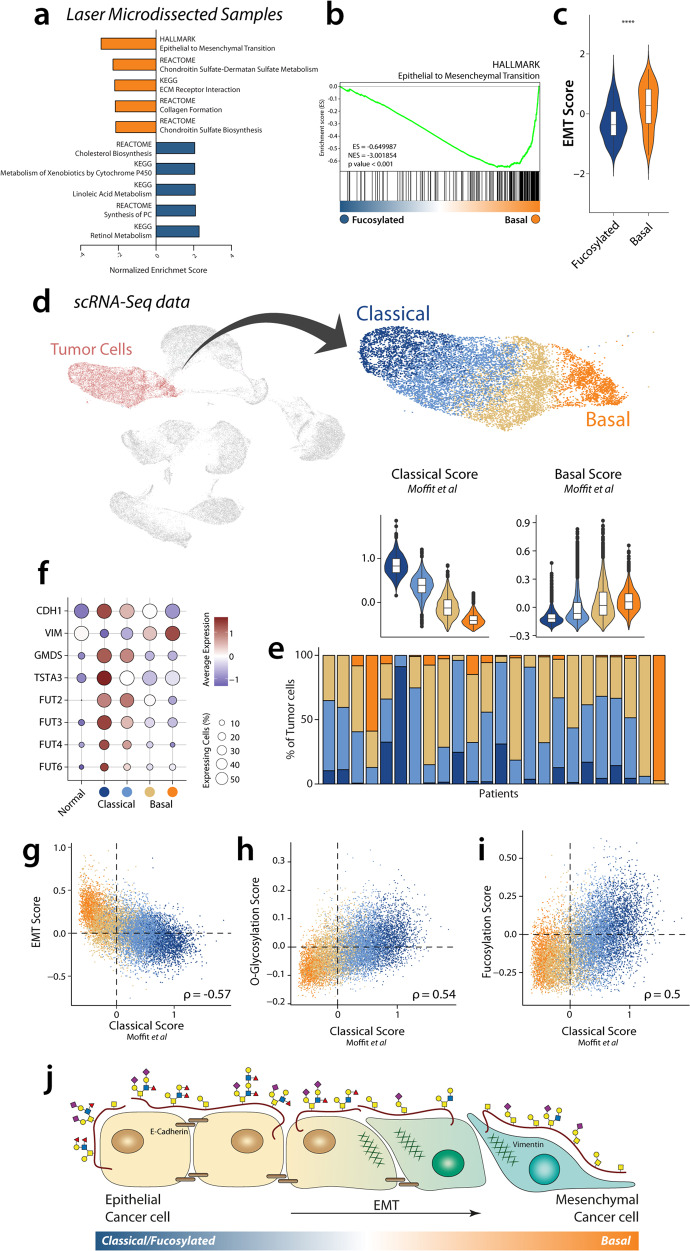
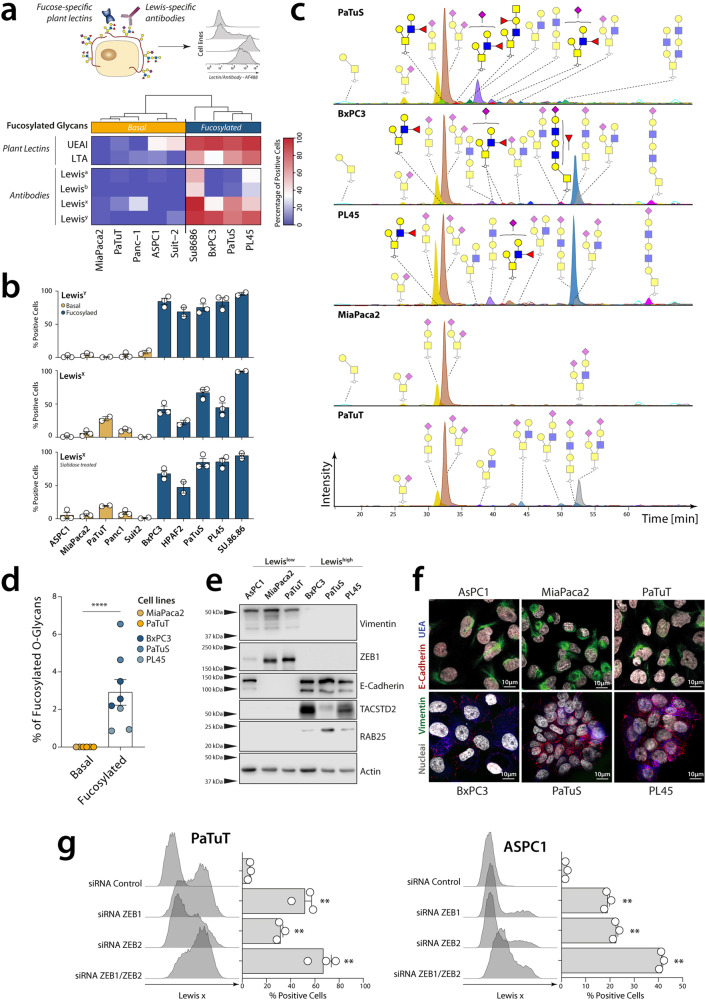
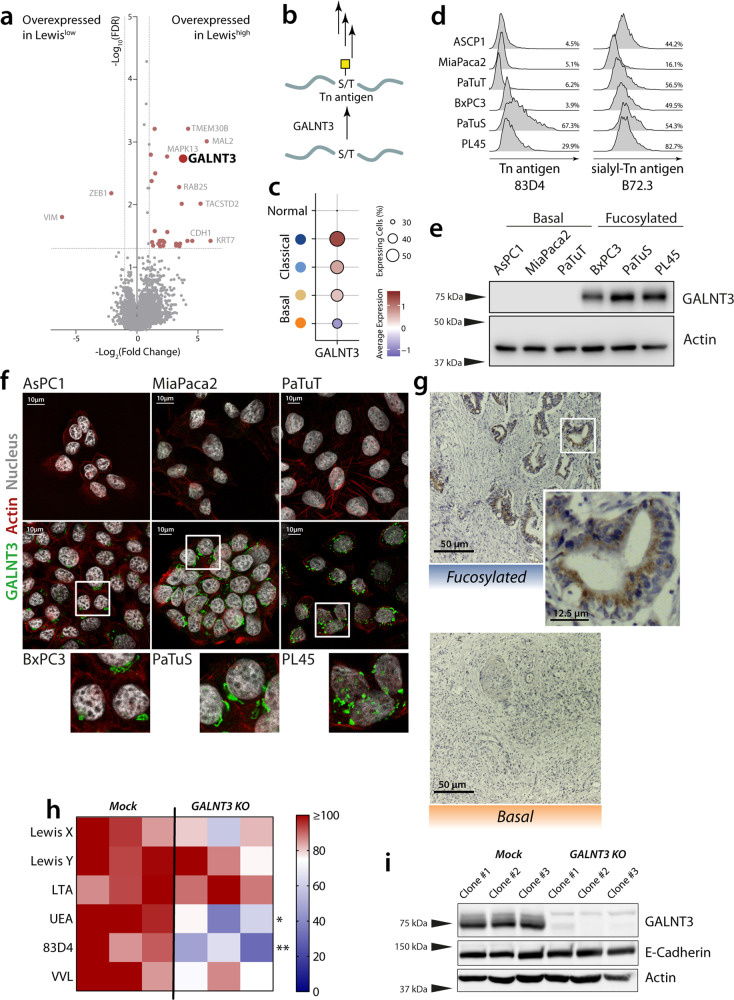
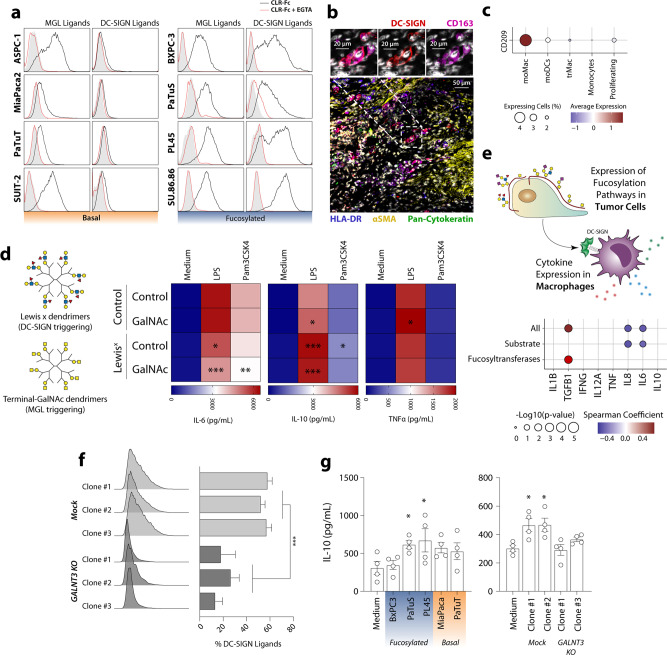
Pancreatic ductal adenocarcinoma (PDAC) remains one of the most aggressive malignancies with a 5-year survival rate of only 9%. Despite the fact that changes in glycosylation patterns during tumour progression have been reported, no systematic approach has been conducted to evaluate its potential for patient stratification. By analysing publicly available transcriptomic data of patient samples and cell lines, we identified here two specific glycan profiles in PDAC that correlated with progression, clinical outcome and epithelial to mesenchymal transition (EMT) status. These different glycan profiles, confirmed by glycomics, can be distinguished by the expression of O-glycan fucosylated structures, present only in epithelial cells and regulated by the expression of GALNT3. Moreover, these fucosylated glycans can serve as ligands for DC-SIGN positive tumour-associated macrophages, modulating their activation and inducing the production of IL-10. Our results show mechanisms by which the glyco-code contributes to the tolerogenic microenvironment in PDAC.


Conflict of interest statement

The authors declare no competing interests.

Figures

Fig. 1
Fig. 1. Transcriptional changes in glyco-code related genes in pancreatic cancer.
a Diagram of the steps used in this paper for the analysis of the role of the glyco-code in pancreatic cancer. b Analysis of glyco-code related genes differentially expressed in tumour tissue with respect to their normal counterpart showed fundamental changes in pancreatic cancer. Bubble plot representing the differentially expressed glyco-code related genes (rows) y four different datasets. Colour of the circles is associated with the fold change of tumour vs normal: red shows genes upregulated in tumour samples, while blue in normal samples. The size of the circles is associated with the p value, calculated as −log10(p value).
Fig. 2
Fig. 2. Expression of glyco-code related genes define molecular subtypes with differential prognosis.
a Consensus clustering revealed the presence of three different glyco-clusters of patients with pancreatic cancer. Heatmap of differential expressed genes between the different clusters in the ICGC-PAAD-AU dataset. Right: Venn diagram showing the common differential expressed glyco-code related genes in the identified clusters in the discovery datasets. Genes identified in at least two datasets are listed (in bold letters, genes identified in all three datasets). b GSVA scores for different glycosylation pathways associated with the glyco-code. c Network analysis of interconnectivity between the identified clusters and previously reported molecular subtypes. d Enrichment scores using GSVA for different gene sets associated with the subtypes described by Bailey et al., Moffit et al. and Collisson et al. e Survival analysis revealed differences in prognosis in the different subtypes. Statistical analysis: Log-rank test. f Heatmap of differential expressed genes between the different clusters in the validation cohort. g Survival analysis of the fucosylated and basal subtypes. Statistical analysis: Log-rank test. h Immunohistochemistry of MUC16 in PDAC tissues from patients in the validation cohort classified as a basal or fucosylated subtype. Data presented as mean values ± SEM. i Quantification of the staining of MUC16 in PDAC tissues. j Diagram summarising the characteristics of each subtype.
Fig. 3
Fig. 3. Glyco-code subtypes are associated with EMT and coexist in PDAC tumours.
a Graphical representation of the top five gene sets enriched in each cluster. b GSEA representation of the gene set ‘HALLMARK Epithelial to Mesenchymal transition’. c EMT Score of both glyco-clusters A and B. Statistics: Mann–Whitney test (*p ≤ 0.05, **p ≤ 0.01, ***p ≤ 0.001, ****p ≤ 0.0001). d Analysis of single-cell RNA-seq identify clusters of tumour cells associated with the Classical and Basal molecular subtypes defined by Moffit et al. Data presented as violin plots with boxplots indicating the median, 25th and 75th percentiles (hinge) and whiskers represent 1.5 times the interquartile range. e Quantification of the Classical (blue) and Basal (beige-orange) tumour clusters in different patients. f Expression of EMT markers E-Cadherin (CDH1), Vimentin (VIM) and Fucosylation-related genes in different clusters in scRNA-seq. Correlation of EMT scores g O-glycosylation h and Fucosylation pathway i with Classical score. j Our results suggest defined changes in glycosylation during EMT in PDAC.
Fig. 4
Fig. 4. Fucosylated and Basal subtypes are also reflected in pancreatic cancer cell lines.
a Analysis of the profile of glycan structures expressed in cell lines using plant lectins or glycan-specific antibodies. b Quantification of the expression of LewisX and LewisY in Fucosylated and Basal cell lines using anti-Lewis antigens antibodies, before and after sialidase treatment. Data presented as mean values ± SEM. c Chromatographic separation of O-glycans from PDAC cell lines. d Quantification of Fucosylated O-glyans present in cell lines. Statistics: Mann–Whitney test (*p ≤ 0.05, **p ≤ 0.01, ***p ≤ 0.001, ****p ≤ 0.0001). e Western blot and f confocal microscopy showing the differential expression of epithelial or mesenchymal markers in each subtype. g Knocking down of ZEB1 and ZEB2 in PaTuT and ASPC1 and evaluation of Lewis X expression by flow cytometry using specific antibodies. Data presented as mean values ± SEM. Statistics: using one-way ANOVA with Dunnett method for multiple test correction (**p ≤ 0.01).
Fig. 5
Fig. 5. GALNT3 is overexpressed in Fucosylated cell lines and contributes to its glyco-phenotype.
a Volcano plot of a differential gene expressed genes between the Lewishigh and Lewislow cell lines defined in. b Scheme of the GALNT3 enzymatic activity. c Expression of GALNT3 in the different tumour clusters in scRNA-seq. d Expression of Tn antigen (mAb: 83D4) and Sialyl-Tn antigen (mAb: B72.3) was analyzed by flow cytometry. e Western blot of GALNT3 in selected PDAC cell lines. f Confocal microscopy of GALNT3 (green) and actin (red). g Expression of GALNT3 is associated with the Fucosylated subtype in PDAC tissue. h Analysis of the expression of glycan structures using plant lectins and antibodies by flow cytometry in WT and GALNT3 KO cell lines. Statistical analysis: Two-way ANOVA with Sidak method for multiple test correction (*p ≤ 0.05; **p ≤ 0.01; ***p ≤ 0.001). i Western Blot of GALNT3, E-Cadherin and Actin in WT and GALNT3 KO cell lines.
Fig. 6
Fig. 6. TAMs distinguish Fucosylated and Basal cells.
a Glycan ligands for the lectin receptors DC-SIGN and MGL were assessed by flow cytometry using DC-SIGNFc and MGL-Fc. b Confocal microscopy of tissue from PDAC patients identifying CD163+ DC-SIGN+ cells. c DC-SIGN (gene CD209) can be detected in moMac in scRNA-seq data of PDAC patients. d Stimulation of moMac macrophages (n = 7) with dendrimers containing LewisX or terminal GalNAc in the presence or absence of TLR ligands, leads to altered IL-6 and IL-10 production, detected using ELISA. Statistics: comparations of each condition against the stimulation with dendrimer control was performed by two-way ANOVA with Dunnett’s multiple comparisons test (*p ≤ 0.05; **p ≤ 0.01; ***p ≤ 0.001). e Correlation between the expression of Fucosylation pathway in tumour cells with the expression of cytokines in moMac using scRNA-seq. f Flowcytometric analysis of the expression of DC-SIGN ligands in WT and GALNT3 KO cell lines, using DC-SIGN-Fc. Statistical analysis: Two-way ANOVA (*p ≤ 0.05, **p ≤ 0.01 and ***p ≤ 0.001). g IL-10 production of M2 Macrophages co-cultured with WT and GALNT3 KO cell lines in the presence of LPS, measured by ELISA. Statistics: Friedman test (*p < 0.05).

References

    1. Rahib L, et al. Projecting cancer incidence and deaths to 2030: the unexpected burden of thyroid, liver, and pancreas cancers in the United States. Cancer Res. 2014;74:2913–2921. - PubMed
    1. Siegel RL, Miller KD, Jemal A. Cancer statistics, 2020. CA Cancer J. Clin. 2020;70:7–30. - PubMed
    1. Chari ST, et al. Early detection of sporadic pancreatic cancer: summative review. Pancreas. 2015;44:693–712. - PMC - PubMed
    1. Erkan M, et al. The role of stroma in pancreatic cancer: diagnostic and therapeutic implications. Nat. Rev. Gastroenterol. Hepatol. 2012;9:454–467. - PubMed
    1. Ligorio M, et al. Stromal microenvironment shapes the intratumoral architecture of pancreatic. Cancer Cell. 2019;178:160–175.e127. - PMC - PubMed

Publication types

MeSH terms