. 2022 Jan 11;5(1):37.
doi: 10.1038/s42003-021-02980-8.

Connectivity of Fennoscandian Shield terrestrial deep biosphere microbiomes with surface communities

Affiliations

Connectivity of Fennoscandian Shield terrestrial deep biosphere microbiomes with surface communities

George Westmeijer et al. Commun Biol. .

Abstract

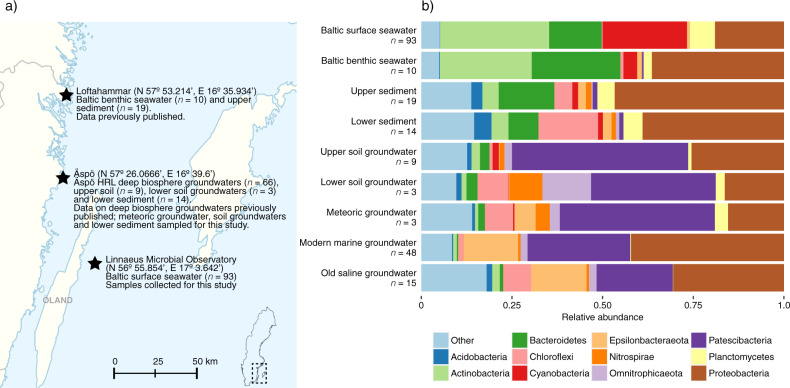
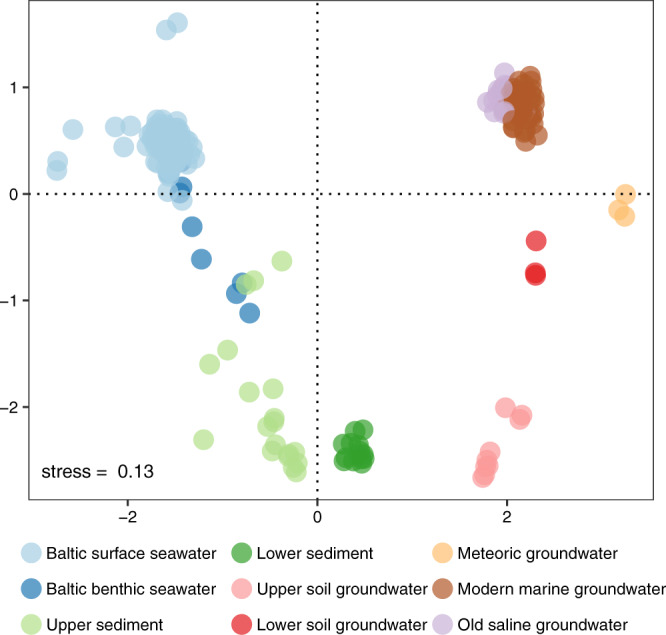
The deep biosphere is an energy constrained ecosystem yet fosters diverse microbial communities that are key in biogeochemical cycling. Whether microbial communities in deep biosphere groundwaters are shaped by infiltration of allochthonous surface microorganisms or the evolution of autochthonous species remains unresolved. In this study, 16S rRNA gene amplicon analyses showed that few groups of surface microbes infiltrated deep biosphere groundwaters at the Äspö Hard Rock Laboratory, Sweden, but that such populations constituted up to 49% of the microbial abundance. The dominant persisting phyla included Patescibacteria, Proteobacteria, and Epsilonbacteraeota. Despite the hydrological connection of the Baltic Sea with the studied groundwaters, infiltrating microbes predominantly originated from deep soil groundwater. Most deep biosphere groundwater populations lacked surface representatives, suggesting that they have evolved from ancient autochthonous populations. We propose that deep biosphere groundwater communities in the Fennoscandian Shield consist of selected infiltrated and indigenous populations adapted to the prevailing conditions.


Conflict of interest statement

The authors declare no competing interests.

Figures

Fig. 1
Fig. 1. Boxplot depicting depth and chemistry of the studied soil plus deep biosphere groundwaters.
DOC; dissolved organic carbon. δ18O is the 18O/16O ratio relative to Standard Mean Ocean Water, expressed in parts per thousand (‰). The boxes are formed by the first and third quartiles while the whiskers extend to 1.5 times the inter-quartile range. Additional chemical parameters including strontium and manganese concentrations are shown in Fig. S1.
Fig. 2
Fig. 2. Overview of sampling sites and their microbial communities.
a Map of south-east Sweden with the sampling sites marked as a star. b Bar plot depicting the 11 most abundant phyla over all the environments with the remaining phyla grouped as “Other”. The number of replicates within each environment is displayed underneath each bar label. The environments are ordered according to increasing depth although they do not represent a physical continuum due to the multiple sampling sites as shown in (a).
Fig. 3
Fig. 3. Alpha diversity microbial communities.
a Boxplot combined with a dot plot. The box is formed by the first and third quartiles while the whiskers extend to 1.5 times the inter-quartile range. The data points in the Baltic surface seawater left of the whisker indicates outliers. The environments are ordered according to increasing depth although they do not represent a physical continuum due to the multiple sampling sites as shown in Fig. 2a. Scatterplots depicting the relation of alpha diversity with depth (b) and with dissolved organic carbon (c). Shading in b, c represents a 95% confidence interval.
Fig. 4
Fig. 4. NMDS of microbial communities from surface, near-surface, and deep biosphere environments.
The beta diversity was estimated according to the Bray-Curtis dissimilarity index. The clustering was verified by multivariate statistical testing (Table S4).
Fig. 5
Fig. 5. Shared ASVs between deep biosphere groundwaters and surface plus near-surface environments.
a Venn diagram depicting the number of shared ASVs between each of the groundwaters and the surface plus near-surface communities with their relative abundance in parentheses. Surface and near-surface is a reference to the seawater, sediment, and soil groundwater samples. b The taxonomy of the shared ASVs sorted at the taxonomic level of phylum. c The taxonomy of the ASVs that lack a surface or near-surface representative, sorted at the taxonomic level of phylum. For each groundwater, the relative abundance of b, c sums up to 1. The overlap among the deep biosphere groundwater communities can be found in Table S5.

References

    1. Magnabosco C, et al. The biomass and biodiversity of the continental subsurface. Nat. Geosci. 2018;11:707–717.
    1. Pedersen K, Bengtsson AF, Edlund JS, Eriksson LC. Sulphate-controlled diversity of subterranean microbial communities over depth in deep groundwater with opposing gradients of sulphate and methane. Geomicrobiol. J. 2014;31:617–631.
    1. Bell E, et al. Active sulfur cycling in the terrestrial deep subsurface. ISME J. 2020;14:1260–1272. - PMC - PubMed
    1. Kotelnikova S. Microbial production and oxidation of methane in deep subsurface. Earth-Sci. Rev. 2002;58:367–395.
    1. Onstott, T. C. et al. In Enigmatic Microorganisms and Life in Extreme Environments (Joseph Seckbach ed) 487–500 (Springer Netherlands, 1999).

Publication types