. 2022 Jan 11;5(1):19.
doi: 10.1038/s42003-021-02927-z.

Diacylglyceryl-N,N,N-trimethylhomoserine-dependent lipid remodeling in a green alga, Chlorella kessleri

Affiliations

Diacylglyceryl-N,N,N-trimethylhomoserine-dependent lipid remodeling in a green alga, Chlorella kessleri

Yutaro Oishi et al. Commun Biol. .

Abstract

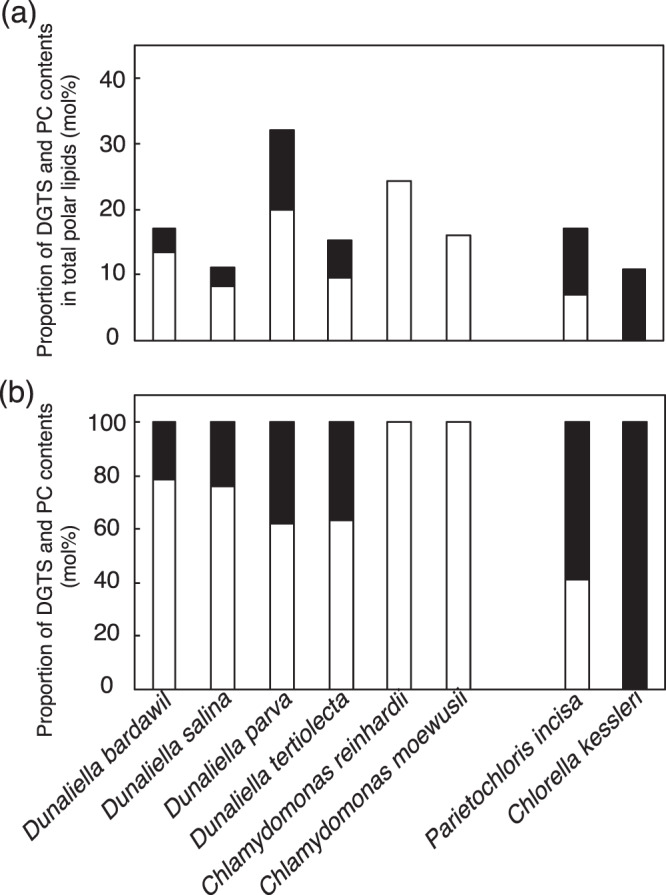
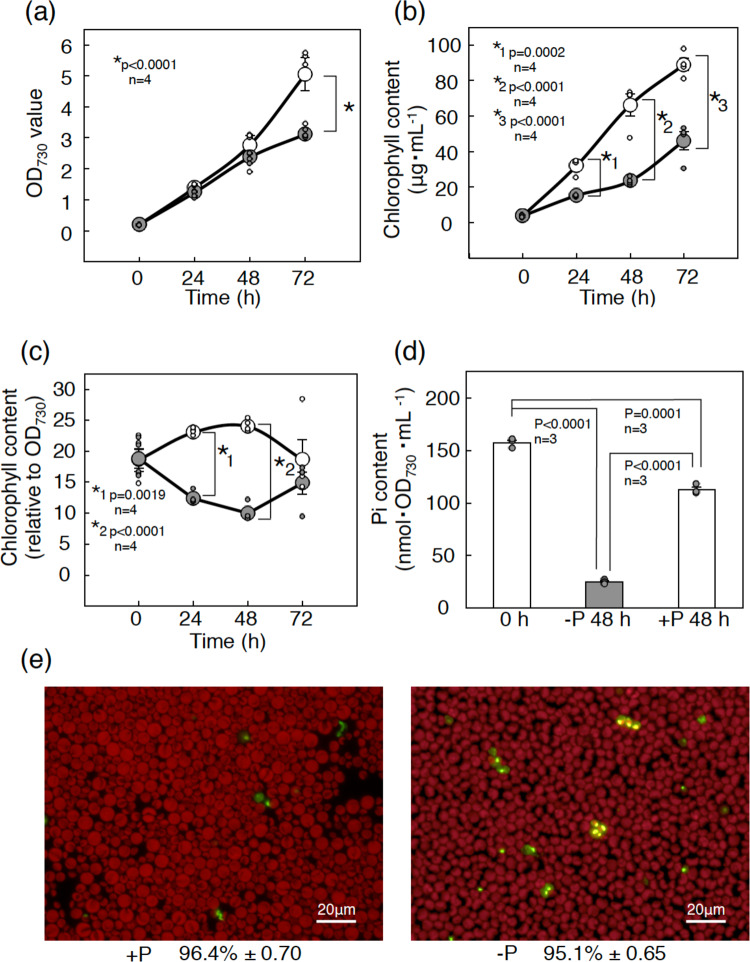
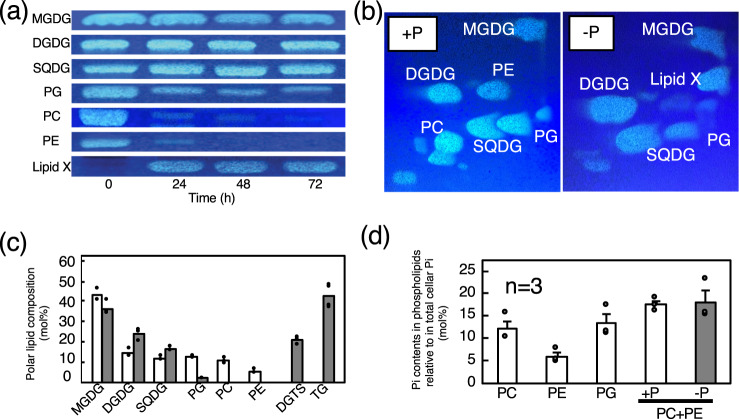
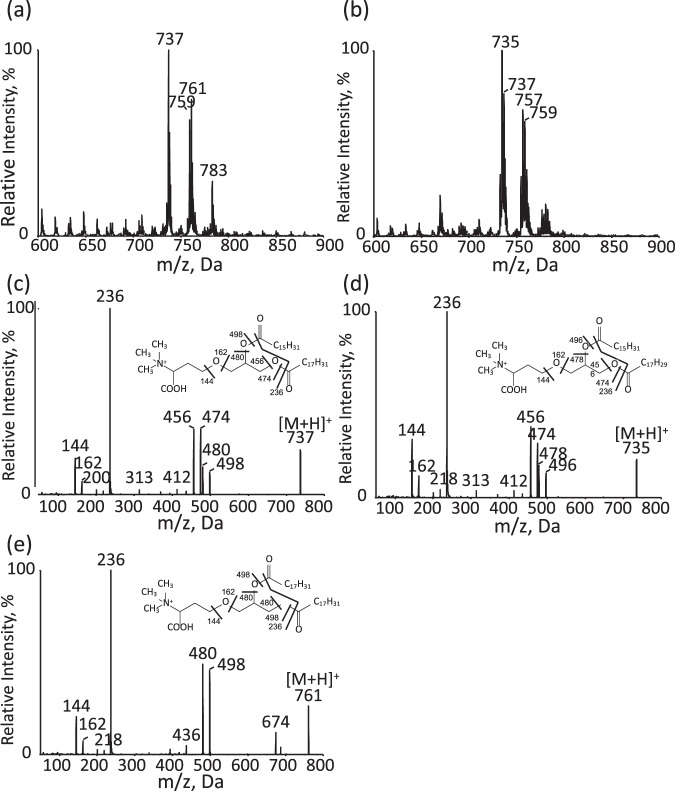
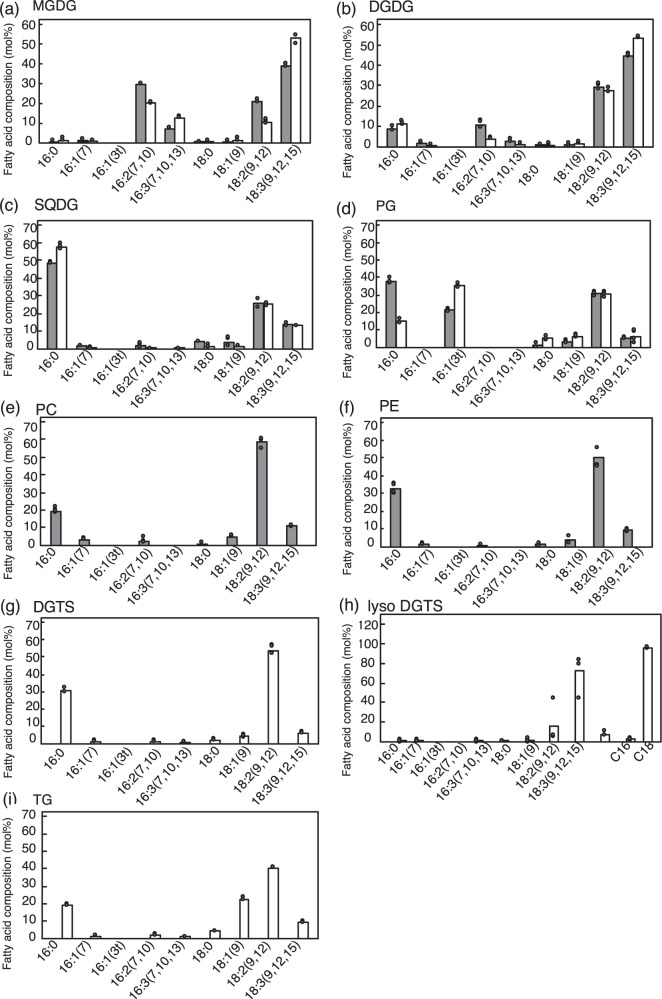
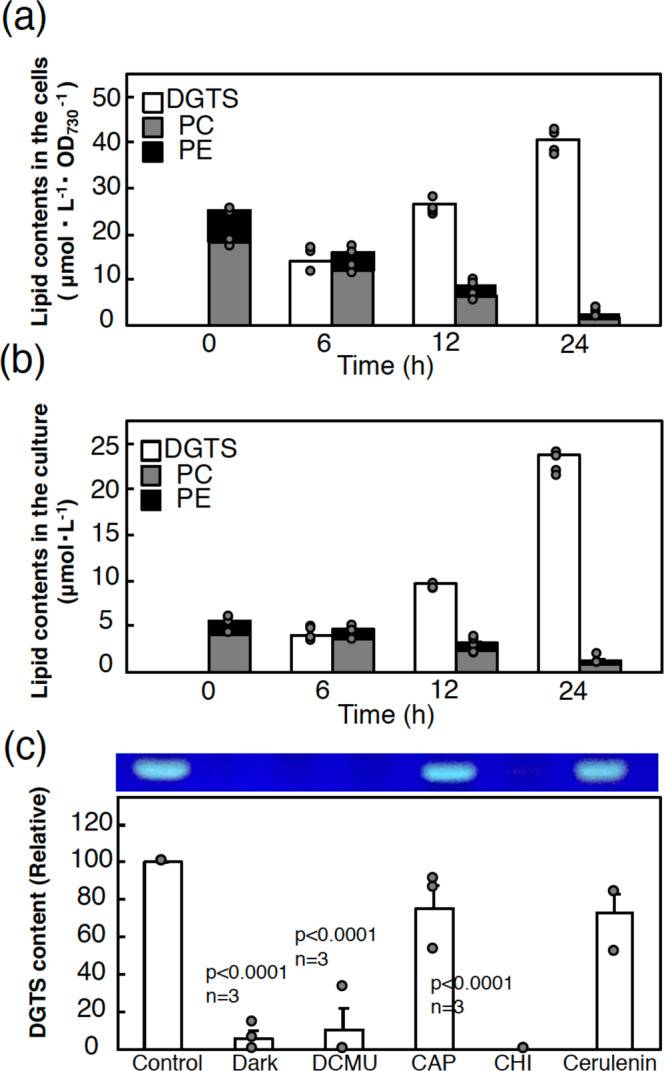
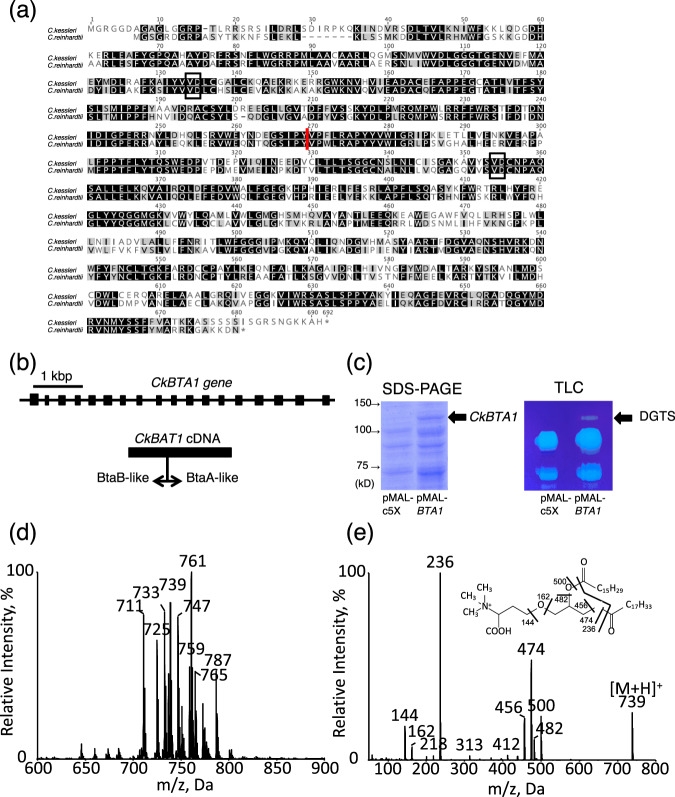
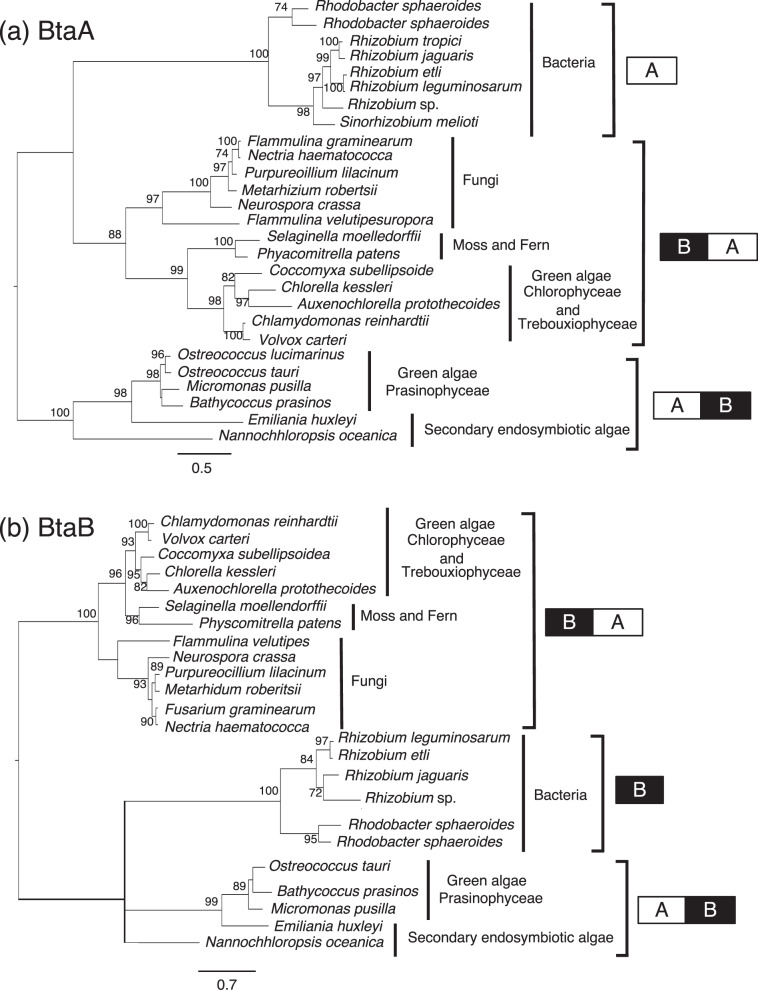
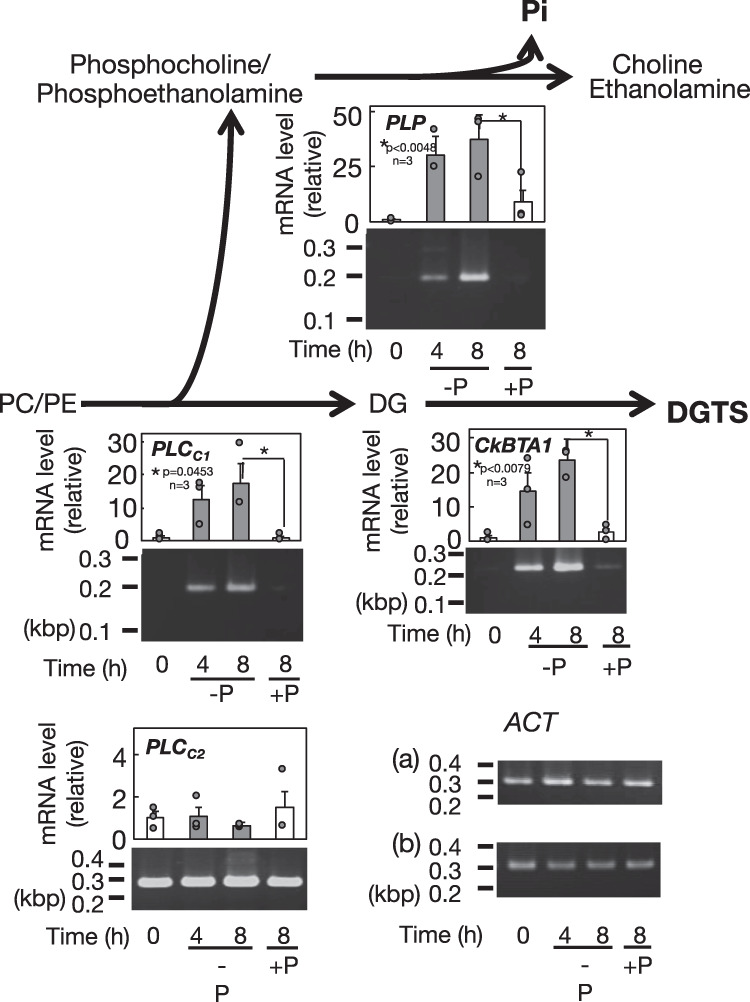
Membrane lipid remodeling contributes to the environmental acclimation of plants. In the green lineage, a betaine lipid, diacylglyceryl-N,N,N-trimethylhomoserine (DGTS), is included exclusively among green algae and nonflowering plants. Here, we show that the green alga Chlorella kessleri synthesizes DGTS under phosphorus-deficient conditions through the eukaryotic pathway via the ER. Simultaneously, phosphatidylcholine and phosphatidylethanolamine, which are similar to DGTS in their zwitterionic properties, are almost completely degraded to release 18.1% cellular phosphorus, and to provide diacylglycerol moieties for a part of DGTS synthesis. This lipid remodeling system that substitutes DGTS for extrachloroplast phospholipids to lower the P-quota operates through the expression induction of the BTA1 gene. Investigation of this lipid remodeling system is necessary in a wide range of lower green plants for a comprehensive understanding of their phosphorus deficiency acclimation strategies.


Conflict of interest statement

The authors declare no competing interests.

Figures

Fig. 1
Fig. 1. DGTS and PC contents in green algae grown under +P conditions.
a Respective contents of DGTS and PC relative to that of total polar lipids. b The proportion of DGTS and PC contents. White and black bars indicate the contents of DGTS and PC, respectively. The values were obtained from previous reports–, .
Fig. 2
Fig. 2. Effects of −P stress on physiological behavior in C. kessleri cells.
a Cell growth on the basis of the OD730 value of the culture. b Chl content in the culture. c The cellular Chl content obtained through estimation of the relative ratios of the values in (b) to those in (a). White and gray circles indicate cells grown under +P and −P conditions, respectively. d Pi contents measured in cells grown under +P conditions (0 h), and in ones grown further for 48 h under +P and −P conditions. e Images of the cells emitting red auto-fluorescence of Chl and/or the green fluorescence of SYTOX bound to chromosomal DNA. The survival ratio of the cells was determined through estimation of the proportion of the number of viable cells emitting only red fluorescence, relative to that of total cells, including non-viable cells with emission of green fluorescence only and with that of both red and green fluorescence. The values shown are averages ± SEM for four biological replicates (ac), and those for three biological replicates (d, e). Data were analyzed by one-way ANOVA with multiple comparison by Tukey–Kramer’s test. Some dots are overlapped (refer to source data in Supplementary Data 1).
Fig. 3
Fig. 3. Lipid remodeling in C. kessleri cells in response to −P stress.
a Qualitative TLC analysis of individual polar lipids prepared from cells grown under +P conditions (0 h), and from ones shifted to −P conditions for further growth for 24, 48, and 72 h. Respective lipids came from different regions of the plate (see Supplementary Fig. 2). b Two-dimensional TLC profile of polar lipids in the cells grown for 48 h under +P or −P conditions. c Polar lipid composition in the cells grown for 48 h under +P (white bars) or −P conditions (gray bars). The content of TG was shown as that of its constituent fatty acids, relative to total polar lipids. d The contents of Pi included in individual phospholipids, relative to that in total cellular fraction. The value as to PC + PE under −P conditions indicates the content of Pi derived from the degradation of PC and PE of +P cells, relative to that in total fraction of −P cells. The values shown are averages for two technical replicates for each of two biological replicates (c), or averages ± SEM estimated on the basis of the data in Fig. 2d (n = 3) and c. Some dots are overlapped (refer to source data in Supplementary Data 1).
Fig. 4
Fig. 4. Identification of a −P-induced lipid as DGTS through LC/MS2 analysis.
ESI mass spectra as to a −P-induced lipid of C. kessleri (a) and DGTS of C. reinharditii (b). Product ion spectra (c), (d), and (e), as to m/z 737 in (a), m/z 735 in (b), and m/z 761 in (a), respectively.
Fig. 5
Fig. 5. Fatty acid composition of individual polar lipids.
The fatty acid compositions of MGDG (a), DGDG (b), SQDG (c), and PG (d) are shown for 48-h grown +P (gray bars) and −P cells (white bars), whereas those of PC (e) and PE (f), and DGTS (g) are for +P and −P cells, respectively. The fatty acid composition of sn-2 monoacyl lysoDGTS is shown in (h). Fatty acid composition of TG in −P cells is shown in (i). The values shown are averages for two technical replicates for each of two biological replicates. Some dots are overlapped (refer to source data in Supplementary Data 1).
Fig. 6
Fig. 6. Metabolic mechanism of DGTS accumulation under −P conditions.
Changes in the contents of DGTS (white), PC (gray), and PE (black) in cells grown for 24 h after a shift from +P to −P conditions, which were estimated in cells on an OD730 L culture basis (a), and in the culture (b). c Effects of metabolic inhibitors or light conditions on the accumulation of DGTS in the cells at 24 h after the shift to −P conditions. The values were estimated as the proportion of the DGTS content in the cells with application of chloramphenicol (CAP), cycloheximide (CHI), cerulenin, and DCMU, and in those shifted to the dark conditions, relative to that in non-treated control cells. The values shown are averages for two technical replicates for each of two biological replicates (a, b), or averages ± SEM for three biological replicates (c). Some dots are overlapped (refer to source data in Supplementary Data 1). Data in (c) were analyzed by one-way ANOVA with multiple comparison by Tukey–Kramer’s test.
Fig. 7
Fig. 7. Structural and functional identification of a BTA1 homolog in C. kessleri.
a Alignment of the postulated amino acid sequence of a BTA1 homolog with that of CrBTA1. Identical and similar amino acid residues are shadowed in black and gray. The vertical red line indicates the boundary of the N-terminal BtaB- and C-terminal BtaA-like domains, whereas two black boxes show the conserved dipeptide VD for the binding of SAM, the substrate in the respective catalytic actions of BtaA and BtaB. b The structure of the BTA1 homolog of C. kessleri. The BTA1 homolog is composed of 18 exons on the nuclear genome. c Expression of cDNA of the BTA1 homolog in E. coli. SDS-PAGE of total cellular proteins shows induction of the expression of the homolog protein in pMAL-CkBTA1 introduced E. coli cells, but not in empty-vector introduced ones. TLC of total cellular lipids shows the appearance of a lipid specifically in pMAL-CkBTA1 introduced E. coli cells. d The ESI mass spectrum of the lipid in the transformant of E. coli. e The product ion spectrum of m/z 739 in (d). Note that the product ion spectrum exhibited three signals (m/z 144, 162, and 236) for identification of the lipid as DGTS.
Fig. 8
Fig. 8. Phylogenetic trees of the BtaA and BtaB domains in BTA1 proteins.
a Bacterial BtaA and eukaryotic BtaA-domains. b Bacterial BtaB and eukaryotic BtaB-domains. Two linked boxes, AB and BA, indicate eukaryotic A and B type BTA1 proteins, respectively, whereas single boxes, A and B, demonstrate bacterial BtaA and BtaB proteins, respectively.
Fig. 9
Fig. 9. Regulatory expression of the genes for −P induced lipid remodeling in C. kessleri.
The expression levels of the BTA1, PLCC1, PLCC2, and PLP genes were investigated through semi-quantitative RT-PCR analysis in C. kessleri cells before and after a shift to −P conditions. The intensities of the DNA bands that correspond to mRNAs of the individual genes were used for determination of the values, relative to that of ACT. Shown are the values relative to those at 0 h with averages ± SEM for three biological replicates. Some dots are overlapped (refer to source data in Supplementary Data 1). Data were analyzed by one-way ANOVA with multiple comparison by Tukey–Kramer’s test.

Similar articles

Cited by

References

    1. Nakamura Y. Phosphate starvation and membrane lipid remodeling in seed plants. Prog. Lipid Res. 2013;52:43–50. - PubMed
    1. Sato N. Roles of the acidic lipids sulfoquinovosyl diacylglycerol and phosphatidylglycerol in photosynthesis: their specificity and evolution. J. Plant Res. 2004;117:495–505. - PubMed
    1. Brown AE, Elovson J. Isolation and characterization of a novel lipid, 1(3),2-diacylglyceryl-(3)-O-4′-(N,N,N-trimethyl)homoserine, from Ochromonas danica. Biochemistry. 1974;13:3476–3482. - PubMed
    1. Künzler K, Eichenberger W. Betaine lipids and zwitterionic phospholipids in plants and fungi. Phytochemistry. 1997;46:883–892. - PubMed
    1. Sato N, Furuya M. Distribution of diacylglyceryltrimethylhomoserine in selected species of vascular plants. Phytochemistry. 1984;23:1625–1627.

Publication types

MeSH terms

Substances