. 2022 Jan 11;5(1):27.
doi: 10.1038/s42003-021-02985-3.

Trans cohort metabolic reprogramming towards glutaminolysis in long-term successfully treated HIV-infection

Affiliations

Trans cohort metabolic reprogramming towards glutaminolysis in long-term successfully treated HIV-infection

Flora Mikaeloff et al. Commun Biol. .

Abstract

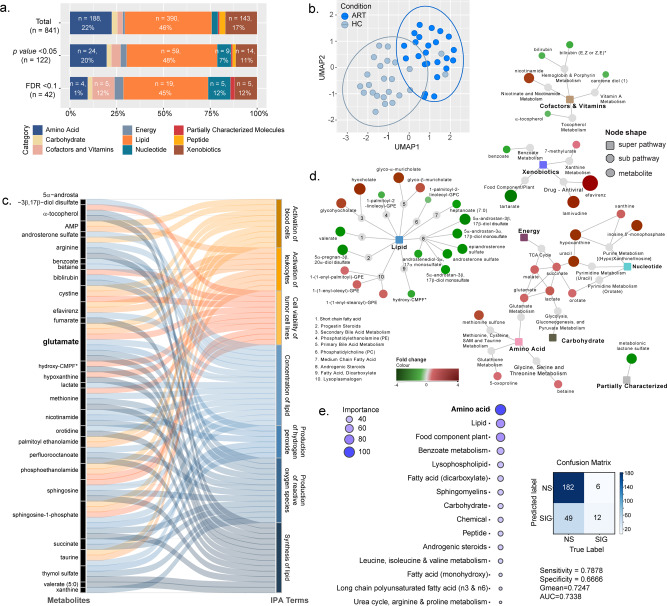
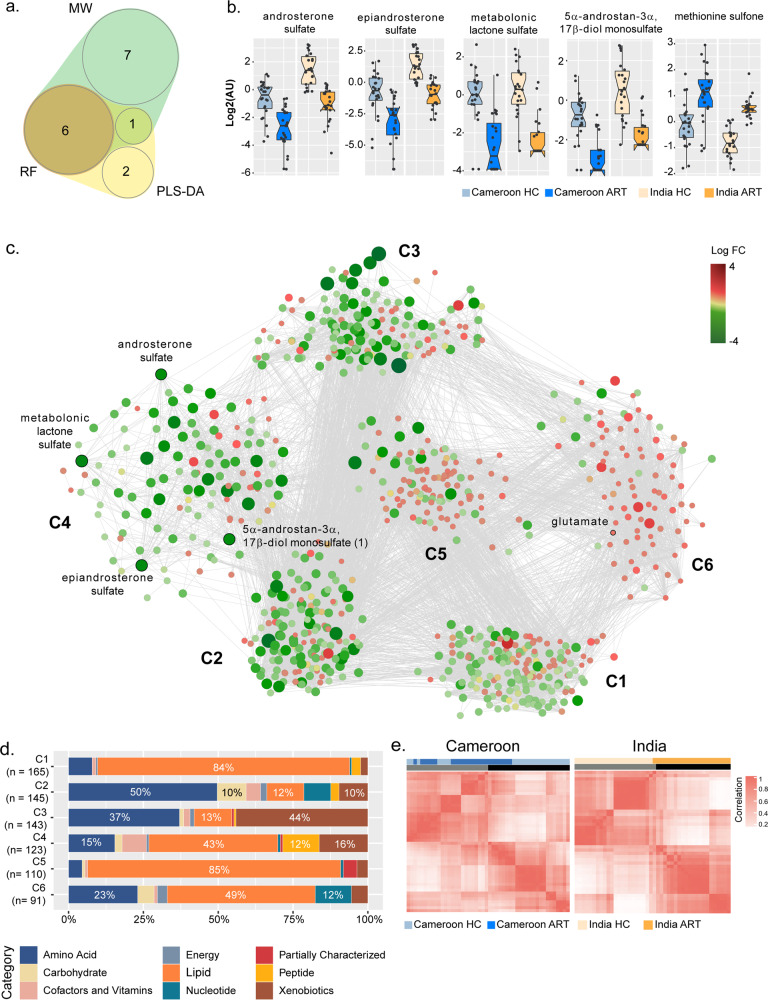
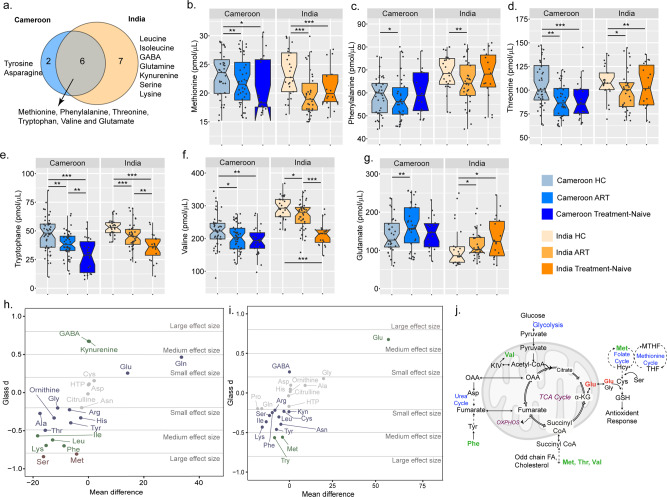
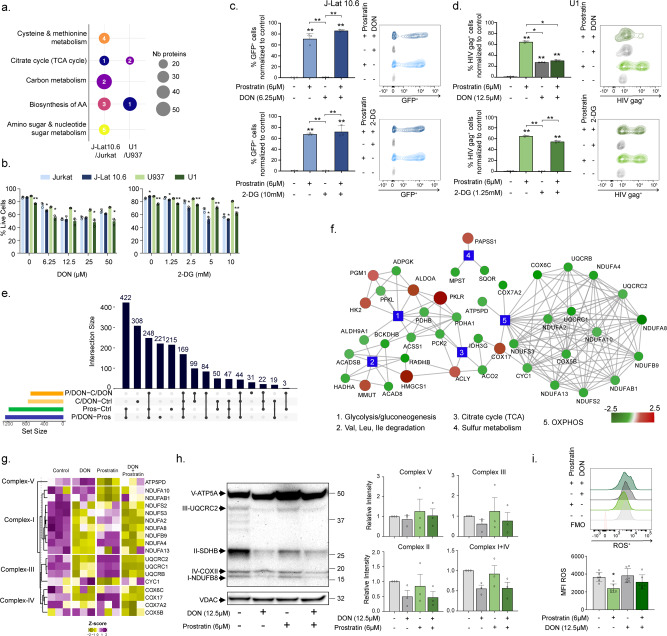
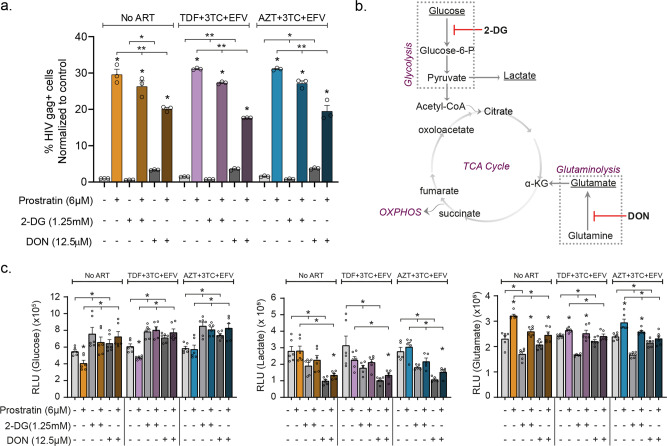
Despite successful combination antiretroviral therapy (cART), persistent low-grade immune activation together with inflammation and toxic antiretroviral drugs can lead to long-lasting metabolic flexibility and adaptation in people living with HIV (PLWH). Our study investigated alterations in the plasma metabolic profiles by comparing PLWH on long-term cART(>5 years) and matched HIV-negative controls (HC) in two cohorts from low- and middle-income countries (LMIC), Cameroon, and India, respectively, to understand the system-level dysregulation in HIV-infection. Using untargeted and targeted LC-MS/MS-based metabolic profiling and applying advanced system biology methods, an altered amino acid metabolism, more specifically to glutaminolysis in PLWH than HC were reported. A significantly lower level of neurosteroids was observed in both cohorts and could potentiate neurological impairments in PLWH. Further, modulation of cellular glutaminolysis promoted increased cell death and latency reversal in pre-monocytic HIV-1 latent cell model U1, which may be essential for the clearance of the inducible reservoir in HIV-integrated cells.


Conflict of interest statement

C.L.L. is the co-founder and chief scientific officer for Shift Pharmaceuticals. The remaining authors declare no competing interests.

Figures

Fig. 1
Fig. 1. Untargeted metabolomics in the Cameroon cohort highlight substantial metabolic alterations in cART compared with HC.
a Bar plots representing the proportion of super pathways and number of associated metabolites in total detected metabolites (n = 841), metabolites with differential abundance between HC and PLWH on cART with p < 0.02 (Mann–Whitney U-Test, n = 122) and FDR < 0.1 (Mann–Whitney U-test, n = 42). b UMAP visualization of 48 samples using metabolites differing between HC and PLWH on cART (Mann–Whitney U-test, FDR < 0.1, n = 42). Samples are colored by condition (light blue = HC; dark blue=cART). c Sankey Plot illustrating the most important contribution to the flow of glutamate-associated pathways together with metabolites that are altered in cART patients. d Network of the metabolites significantly differing between HC and cART (Mann–Whitney U-test, FDR < 0.1, n = 42). Colored rectangular nodes represent super pathways, gray circles subpathways, and colored circles single metabolites. The color gradient was applied depending on log2FC for each metabolite from green (decreased in cART) to red (increased in cART). The size of the bubble is proportional to log2FC. Edges connect each metabolite to its respective subpathway and each subpathway to its respective super pathway. e Bubble plot showing the importance of Metabolon pathways in the prediction of metabolite association with cART status and the associated confusion matrix and classifier metrics. Terms represented at the top of the figure are the most important for prediction. (RF, estimators: 500, class weight: balanced).
Fig. 2
Fig. 2. Identification of biomarkers associated with HIV status and impact of cART compared to HC.
a A 4-dimensional, quasi-proportional Venn diagram showing the number of overlapping metabolites (n = 6) differing HC/cART from three methodologies (Mann–Whitney U-test, RF, and PLS-DA) in Indian and Cameroon cohort. Analysis was performed separately in Indian and Cameroon cohorts. b Box plots of significant biomarkers shared by Indian and Cameroon patients: androsterone sulfate, epiandrosterone sulfate, metabolomic lactone sulfate, 5α–androstan–3α,17β-diol monosulfate, and methionine sulfone. In all the comparisons, FDR < 0.001 Dots represent individual values and the line represents the median. c Global association analysis network and identified communities. Potential biomarkers and glutamate are indicated. d Bar plots representing proportion of super pathways and number of associated metabolites in communities (n_c1 = 165, n_c2 = 145, n_c3 = 143, n_c4 = 123, n_c5 = 110, n_c6 = 91). e Consensus matrices of potential biomarkers and first neighbors in HC and cART. Data were log-transformed and z-score transformed. Cameroon HC (light blue); Cameroon cART (dark blue); India HC (light yellow); and India cART (dark yellow).
Fig. 3
Fig. 3. Targeted amino acid in the larger HIV-1 cohorts from Cameroon and India.
a Venn diagram representing the overlap of AA significantly differing in HC compared to cART between Cameroon and Indian cohort. bg Box plots showing the abundance of six significant AA between HC and cART (Mann–Whitney U-test, FDR < 0.1) (*FDR < 0.1, **FDR < 0.05, ***FDR < 0.01): methionine (b), phenylalanine (c), threonine (d), tryptophan (e), valine (f), and glutamate (g) in HC, and PLWH on cART and treatment-naive patients from Cameroon and Indian cohorts. Cameroon HC (light blue) n = 50; Cameroon cART (blue) n = 50; Cameroon Treatment-Naïve (dark blue) n = 25; India HC (light yellow) n = 30; India cART (light orange) n = 41; India Treatment-naïve (orange) n = 20. h and i Scatter plot of AA mean differences by effect size (Glass delta (D)) in Indian (h) and Cameroon (i) cohorts. Dots are colored based on effect size (red = large, green = medium, blue = small). j Schematic representation of the altered AA linked with the key metabolic pathways.
Fig. 4
Fig. 4. Effect on cellular metabolism in latency cell models during latency reversal.
a Steady-state metabolic alterations in the HIV latency cell models, J-Lat 10.6 (dark blue) and U1 (dark green), compared to Jurkat (light blue) and U937 (light green), respectively. MSEA using the KEGG Metabolism with FDR < 0.05 is shown as bubble plots. The size of the bubble represents the number of proteins and the number, the rank of the pathway based on FDR. b Viability of latency cell models J-Lat 10.6 and U1 compared to respective parental cell lines Jurkat and U937 during 48 h DON or 2-DG treatment measured using flow cytometry. c, d HIV latency activation using prostratin (6 μM) together with DON (6.25 μM) or 2-DG (10 mM) in J-Lat 10.6 cell line (c) and DON (12.5 μM) or 2-DG (1.25 mM) in U1 cell line (d). Data represented as bar graphs (mean ± SD) of three independent experiments. Flow cytometry contour plots are from a representative sample. e The upset plot of proteins with differential abundance between control vs. DON (C/DON-Ctrl, yellow), control vs. prostratin (Pros-Ctrl, green), prostratin vs. DON + prostratin (P/DON-Pros, blue), and DON + prostratin vs. DON (P/DON-C/DON, orange) in U1 cells corrected for U937 cells. Horizontal bars show the number of proteins found in each comparison. Vertical bars display intersects between comparisons as indicated in the matrix below the graph. f Network of the proteins differing significantly between control U1 and DON treated U1 (LIMMA, FDR < 0.1, n = 758). Blue colored rectangular nodes represent KEGG pathways and colored circles represent proteins. The color gradient was applied depending on log2FC for each metabolite from green (decreased in U1-DON) to red (increased in U1-DON). The size of the bubble is also proportional to log2FC. g Heatmap showing OXPHOS proteins levels in U1 treated with DON and prostratin. Proteins were selected based on comparison U1 vs U1-DON (LIMMA, FDR < 0.1) and their association with the OXPHOS KEGG pathway. Proteins were separated based on their complexes (from I to V). h Western blot analysis and quantification of OXPHOS proteins during DON treatment in U1 cells with a representative blot of three independent experiments (Fig. S10) are shown here. Quantification of western blot represented as bar graphs with mean ± SEM. i Measurement of ROS in latency cell model U1 during prostratin and DON treatments. Data represented as mean ± SD of three independent experiments All statistical analysis was performed using unpaired t-test or Mann–Whitney U-test (*p < 0.05, and **p < 0.001).
Fig. 5
Fig. 5. Effect of cART regimens on HIV activation during inhibition of glutaminolysis: effect of cART regimens (TDF + 3TC + EFV and AZT + 3TC + EFV) in combination with 2-DG and DON on HIV latency activation in U1 cells.
a Production of HIV gag during cART treatment in the presence of metabolic blockers 2-DG or DON. b Schematic showing the effect of 2-DG and DON on metabolic processes. c Effect of cART regimens on intracellular glucose, lactate, and glutamate levels when treated with 2-DG or DON during latency activation. All experiments were performed in three independent replicates. Statistical analysis was performed using the Mann–Whitney U-test (*p < 0.05, and **p < 0.001) and represented as mean ± SEM.

References

    1. Babu H., et al. Plasma metabolic signature and abnormalities in HIV-infected individuals on long-term successful antiretroviral therapy. Metabolites9, 210 (2019). - PMC - PubMed
    1. Babu H, et al. Systemic inflammation and the increased risk of inflamm-aging and age-associated diseases in people living with HIV on long term suppressive antiretroviral therapy. Front Immunol. 2019;10:1965. - PMC - PubMed
    1. Gelpi M, et al. The central role of the glutamate metabolism in long-term antiretroviral treated HIV-infected individuals with metabolic syndrome. Aging. 2021;13:22732–22751. - PMC - PubMed
    1. Rosado-Sánchez I, et al. Glutaminolysis and lipoproteins are key factors in late immune recovery in successfully treated HIV-infected patients. Clin. Sci. (Lond). 2019;133:997–1010. - PubMed
    1. Cassol E, Misra V, Dutta A, Morgello S, Gabuzda D. Cerebrospinal fluid metabolomics reveals altered waste clearance and accelerated aging in HIV patients with neurocognitive impairment. AIDS. 2014;28:1579–1591. - PMC - PubMed

Publication types