

Long Non-Coding RNA Signatures Associated with Ferroptosis Predict Prognosis in Colorectal Cancer
- PMID: 35018112
- PMCID: PMC8742603
- DOI: 10.2147/IJGM.S331378
Long Non-Coding RNA Signatures Associated with Ferroptosis Predict Prognosis in Colorectal Cancer
Abstract
Background: Currently, colorectal cancer has become a common gastrointestinal malignancy that usually occurs in the colon and rectum, and ferroptosis plays a vital role in the pathology and progression of colorectal tumors.
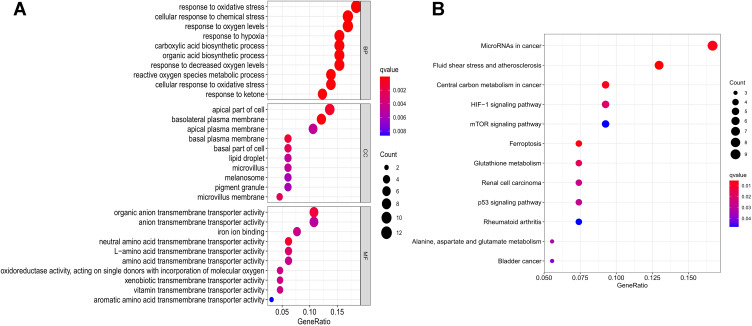
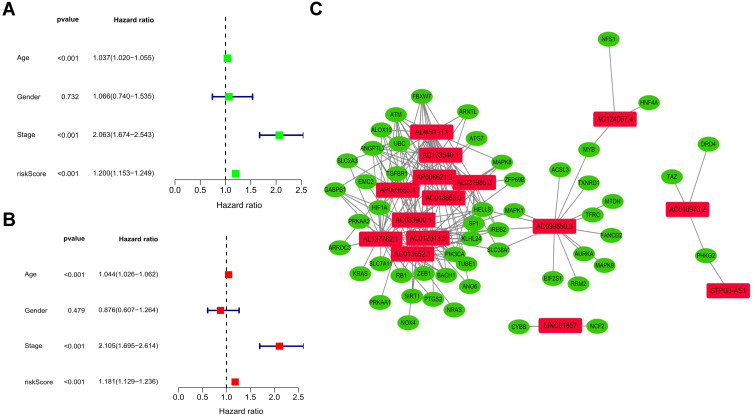
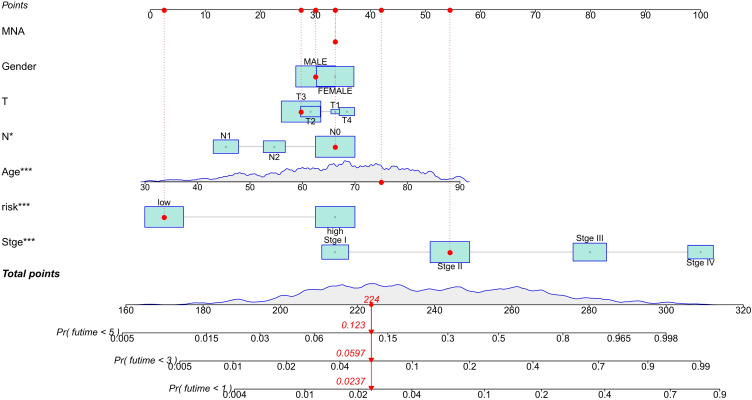
Methods: A total of 627 patients (51 normal and 644 tumor samples) from The Cancer Genome Atlas (TCGA)-COAD and TCGA-READ were included in the study. Lasso and Cox's regression was employed to analyze the characteristic lncRNAs in colorectal cancer samples, and a distinctive prognostic model of ferroptosis-related lncRNAs was established. By analyzing the divergence between the high and low-risk groups of ferroptosis-related lncRNAs, 15 characteristic lncRNAs related to the prognosis of colorectal cancer were evaluated. Kaplan-Meier analysis, operation characteristic curve (ROC), nomogram, and gene set enrichment analyses (GSEA) further confirmed the validity of the characteristic prognostic model with ferroptosis-related lncRNAs.
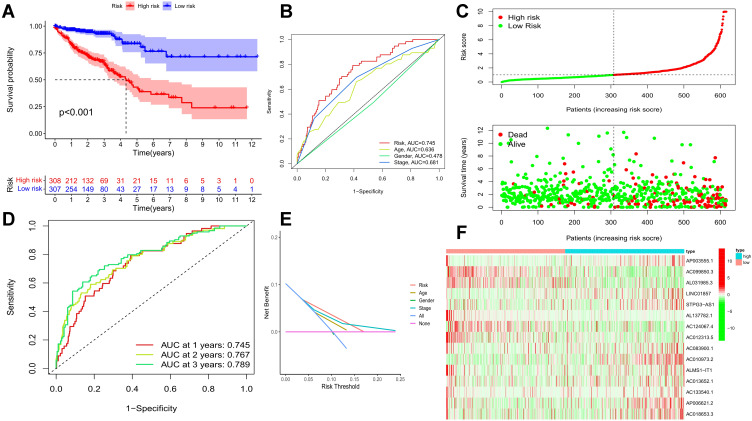
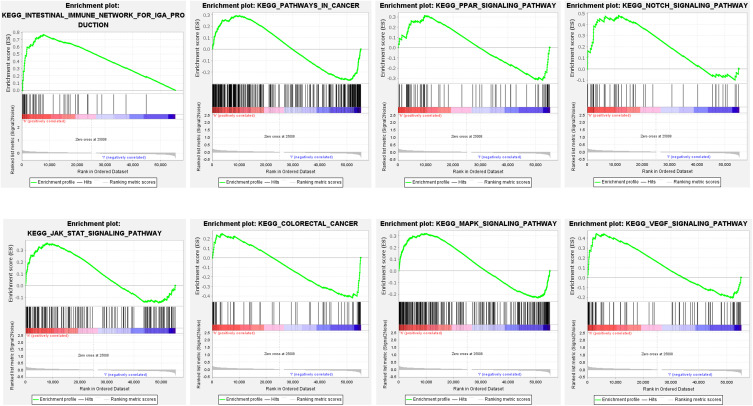
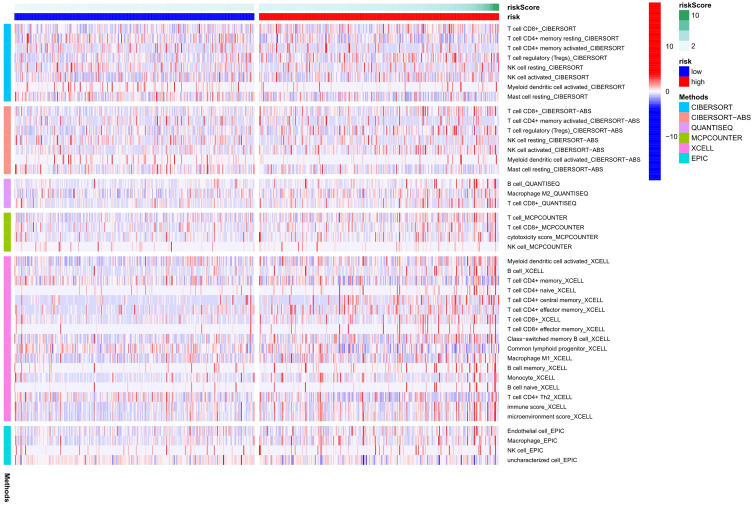
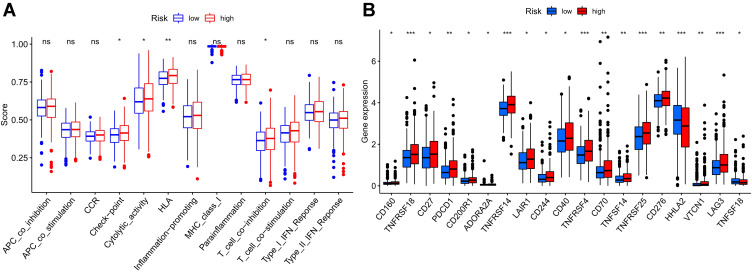
Results: Kaplan-Meier analysis confirmed a high-risk group of ferroptosis-related lncRNA interrelated with a poor prognosis in colorectal cancer. AUC estimates of 1 -, 3 -, and 5-year survival rates for ferroptosis-related lncRNA characteristic models were 0.745, 0.767 and 0.789. GSEA analysis showed that immune and malignancy-related pathways were active in the high-risk score group. In addition, differential analyses of immune function, including Checkpoint, cytolytic, HLA, and T cell co-inhibition, differed significantly betwixt low - and high-risk groups.CD160, TNFRSF18, CD27, PDCD1, CD200R1, ADORA2A, TNFRSF14, LAIR1, CD244, CD40, TNFRSF4, CD70, TNFSF14, TNFRSF25, CD276, HHLA2, VTCN1, LAG3, TNFSF18, and other immune checkpoints had different expressions betwixt the high- and low-risk group.
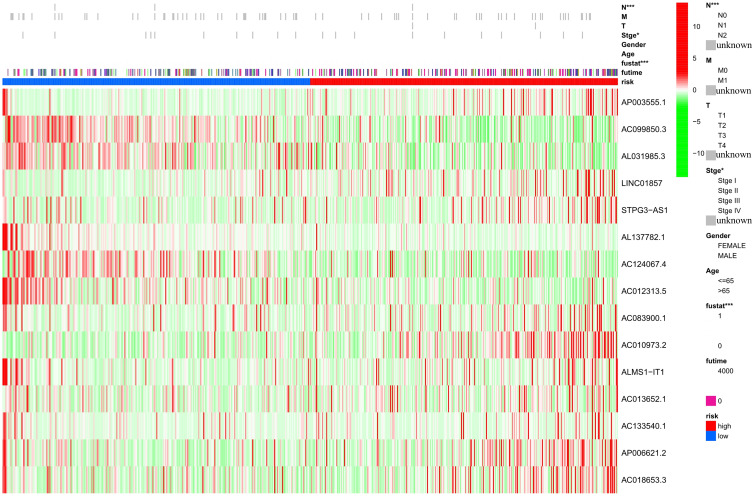
Conclusion: Fifteen kinds of lncRNAs with different expressions (AP003555.1, AC099850.3, AL031985.3, LINC01857, STPG3-AS1, AL137782.1, AC124067.4, AC012313.5, AC083900.1, AC010973.2, ALMS1-IT1, AC013652.1, AC133540.1, AP006621.2, AC018653.3) were closely associated with poor prognosis of colorectal cancer. These indicators were significantly correlated with the overall survival (OS) rate and could be used as prognostic evaluation criteria.
Keywords: TCGA; colorectal cancer; ferroptosis; immune infiltration; lncRNAs.
© 2022 Li et al.
Conflict of interest statement
The authors have declared no conflicts of interest.
Figures
Similar articles
-
The construction of a novel ferroptosis-related lncRNA model to predict prognosis in colorectal cancer patients.Medicine (Baltimore). 2023 Mar 10;102(10):e33114. doi: 10.1097/MD.0000000000033114. Medicine (Baltimore). 2023. PMID: 36897681 Free PMC article.
-
Construction and Validation of a Novel Ferroptosis-Related lncRNA Signature to Predict Prognosis in Colorectal Cancer Patients.Front Genet. 2021 Oct 28;12:709329. doi: 10.3389/fgene.2021.709329. eCollection 2021. Front Genet. 2021. PMID: 34777458 Free PMC article.
-
Systematic analysis of ferroptosis-related long non-coding RNA predicting prognosis in patients with lung squamous cell carcinoma.Transl Lung Cancer Res. 2022 Apr;11(4):632-646. doi: 10.21037/tlcr-22-224. Transl Lung Cancer Res. 2022. PMID: 35529787 Free PMC article.
-
Mechanisms of long non-coding RNAs in biological phenotypes and ferroptosis of glioma.Front Oncol. 2022 Jul 14;12:941327. doi: 10.3389/fonc.2022.941327. eCollection 2022. Front Oncol. 2022. PMID: 35912271 Free PMC article. Review.
-
LncRNAs regulate ferroptosis to affect diabetes and its complications.Front Physiol. 2022 Sep 26;13:993904. doi: 10.3389/fphys.2022.993904. eCollection 2022. Front Physiol. 2022. PMID: 36225311 Free PMC article. Review.
Cited by
-
Construction of an m6A- and neutrophil extracellular traps-related lncRNA model to predict hepatocellular carcinoma prognosis and immune landscape.Front Immunol. 2023 Oct 5;14:1231543. doi: 10.3389/fimmu.2023.1231543. eCollection 2023. Front Immunol. 2023. PMID: 37868992 Free PMC article.
-
Ferroptosis-based nano delivery systems targeted therapy for colorectal cancer: Insights and future perspectives.Asian J Pharm Sci. 2022 Aug;17(5):613-629. doi: 10.1016/j.ajps.2022.09.002. Epub 2022 Oct 1. Asian J Pharm Sci. 2022. PMID: 36382305 Free PMC article. Review.
-
Cuproptosis- and m6A-Related lncRNAs for Prognosis of Hepatocellular Carcinoma.Biology (Basel). 2023 Aug 8;12(8):1101. doi: 10.3390/biology12081101. Biology (Basel). 2023. PMID: 37626987 Free PMC article.
-
Disulfidptosis-associated long non-coding RNA signature predicts the prognosis, tumor microenvironment, and immunotherapy and chemotherapy options in colon adenocarcinoma.Cancer Cell Int. 2023 Sep 27;23(1):218. doi: 10.1186/s12935-023-03065-8. Cancer Cell Int. 2023. PMID: 37759294 Free PMC article.
-
Identification and panoramic analysis of drug response-related genes in triple negative breast cancer using as an example NVP-BEZ235.Sci Rep. 2023 Apr 12;13(1):5984. doi: 10.1038/s41598-023-32757-4. Sci Rep. 2023. PMID: 37045929 Free PMC article.
References
LinkOut - more resources
Full Text Sources
Research Materials
